

Abstract
Aim
The human Major Histocompatibility Complex (MHC) is a highly polymorphic genomic region occupying approximately 4 Mb on chromosome 6p21.3. The relationship between human MHC and type 1 diabetes (T1D) has been previously investigated. To fine map the disease locus in this region, we carried out both linkage and association analyses using the Type 1 Diabetes Genetics Consortium data.
Methods
Two-point linkage analysis was performed with a set of microsatellite markers assuming a fully recessive inheritance model, where we found clustering of high LOD (logarithm of the odds) scores across the MHC region. To narrow down the linkage region, we performed association analyses using both microsatellite and two sets of single nucleotide polymorphism (SNP) markers. We focused on the nuclear families containing a discordant sib-pair (an affected and unaffected sib). For the microsatellite markers, we computed the average repeat length for each individual and carried out a paired t-test.
Results
Microsatellite marker D6S2884 showed the highest association in a sharp peak with a p value of 3.15E–24. We confirmed this finding when using also SNP markers performing a McNemar's test for association. The SNPs that showed the most significant evidence of association mapped to almost the same location as the microsatellite markers.
Conclusions
Besides the main goal of fine mapping of T1D genes, our results also illustrated the differences and the advantage of using both linkage and association analyses. After the identification of a wide peak with linkage analysis, we were able to dramatically narrow down the region by performing association analysis.
Keywords: association analysis, diabetes, linkage analysis, major histocompatibility complex
Introduction
Type 1 diabetes (T1D) is an autoimmune disorder affecting millions of people globally [1]. Genes in both human Major Histocompatibility Complex (MHC) region and elsewhere may influence the risk of developing T1D. However, up to date, only the MHC class II genes are known to have a major impact on the disease susceptibility [2,3]. There is compelling evidence that T1D susceptibility is mostly conferred by particular haplotypes of human leucocyte antigen (HLA)-DRB1, HLA-DQA1, and HLA-DQB1 [4,5]. The Type 1 Diabetes Genetics Consortium (T1DGC) is an international, multicentre program organized to promote genetic research on T1D [6]. One major goal of the program is to establish resources and make them available to the research community for identifying T1D disease genes. In the current MHC Fine-Mapping project, T1DGC has performed high-density genotyping [microsatellites and single nucleotide polymorphisms (SNPs)] in the MHC region using its family samples collected across the world. To identify possible susceptibility loci in the human MHC region, we applied both linkage and association analyses in this data set.
Materials and Methods
The genotype data used in our study are the T1DGC MHC Fine Mapping data 2007 February release. This data set contains family genotyping data from nine different cohorts collected by T1DGC centre. The nine cohorts (and their corresponding number of pedigrees) include: Asia-Pacific (191), British Diabetes Association (BDA) (423), Danish (147), Europe (475), Human Biological Data Interchange (HBDI) (436), Joslin (118), North America (338), Sardinian (77), and United Kingdom (116). In total, there are 2321 families in this data collection and the majority of them are nuclear families with one affected sib-pair.
The pedigrees were genotyped using two high-density oligonucleotide pool assay (OPA) SNP marker panels (1536 SNPs in each) and one deCODE panel (66 microsatellites) in the MHC region. The T1DGC extensively cleaned the data for both relationship inconsistencies and Mendelian errors before releasing it. Deviation from Hardy–Weinberg equilibrium (HWE) was also tested for each locus using the parental genotypes and markers out of HWE were retyped. Quality control using duplicate samples showed a genotyping error rate of 0.6% for the T1DGC MHC data.
More detailed information on sample collection, marker selection, genotyping method and data cleaning procedures can be found at the T1DGC website (www.t1dgc.org).
Linkage Analyses
Two-point linkage analysis with microsatellite markers on the nine cohorts was performed by using the MLINK program [7,8]. We assumed a fully penetrant recessive model of inheritance. To investigate the locus heterogeneity in the nine cohorts, we performed a homogeneity test (M-test [9]) among the nine cohorts for each of the microsatellite markers. First, we computed LOD scores in steps of theta of 0.02. Then we found the maximum LOD score, Zi, for the ith cohort and also the maximum LOD score, Zall, for the summed LOD scores (summed over all cohorts at the same theta). The chi-squared for heterogeneity is then given by 4.605 × (Z1 + Z2 + … + Z9 − Zall) and has eight degrees of freedom (d.f.).
Association Analyses
For association analyses, we focused only on those nuclear families containing both affected and unaffected offspring. We picked one affected and one unaffected offspring, choosing between individuals based on who had the most genotype information available, to form a discordant sib-pair. The final sample for our analysis consisted of a total of 649 discordant sib-pairs.
We carried out association tests as follows. For the microsatellite markers, we took the repeat length as a quantitative trait and wanted to test whether repeat length was significantly different between affected and unaffected individuals. Each individual contributed two observations (repeat lengths); for simplicity, we took the average, X, of the two repeat lengths in an individual as that individual's quantitative observation. To allow for the genetic correlation between members of a sib-pair, we then performed a paired two-sided t-test by computing the difference of X2 −X1 (2 = affected, 1 = unaffected) to test the hypothesis that the difference over sib-pairs was different from zero.
For the SNPs in the OPA1 and OPA2 panels, we performed a paired McNemar's test [10]. First, we built a 3 × 3 genotype table for each marker (three unaffected genotypes × three affected genotypes). Then, each sib-pair of two siblings furnished one entry in this genotype table. According to McNemar principles, only the off-diagonal elements are important because they represent the change. We would like to test whether the number of sib-pairs in the upper right triangle of the table is significantly different from the number in the lower left triangle, which is carried out with a chi-squared test with 1 d.f. Using this methodology, we can pool the data from different cohorts together without concerning the potential problem of population stratification.
Results
As a first step, we performed a two-point linkage analysis with the microsatellite markers in the nine cohorts (figure 1). The markers in figure 1 are ordered by their chromosomal positions. The graphs of LOD scores look rather similar in that we observed very high LOD scores for almost all the markers in the nine cohorts, perhaps with the exception of the Sardinian subpopulation, which showed a unique peak at marker 44 (NOTCH-47; build 36 position: 32 231 184 on chromosome 6). This may be because of the fact that the Sardinian cohort is a relatively isolated island population that may have a unique genetic pattern. We also detected one non-informative marker (D6S2830) that had an LOD score of zero in all the cohorts. T1D is a genetically heterogeneous and complex disease where different genetic factors may be involved. To test the locus heterogeneity in the microsatellite markers, we performed an M-test and found that 17 microsatellite markers showed heterogeneity across the nine cohorts at p < 0.05. The greatest heterogeneity was observed at marker 48 (D6S2886) with a p value of 0.004. However, none of these p values were significant after the Bonferroni correction. Besides performing linkage analyses in each individual cohort, we also considered the sum of the LOD scores across the nine cohorts (figure 2). The linkage results in figure 2 are clearly a widespread of high LOD scores as is often seen in linkage studies. The averaged LOD score for these 66 microsatellite markers is 115.4, and the highest LOD score of 187.9 is observed at marker 37 (D6S2793, build 36 position: 31 579 686).
Fig. 1.
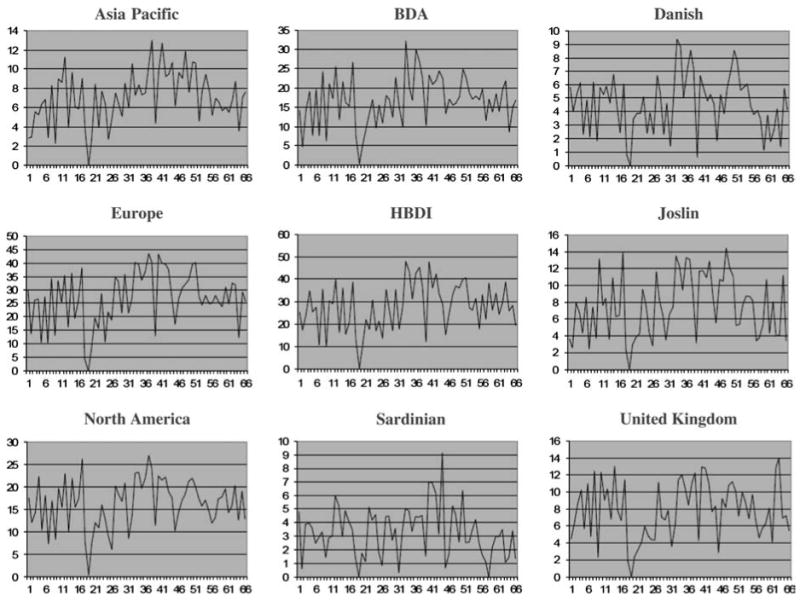
Two-point LOD scores for the microsatellite markers in the nine cohorts.
Fig. 2.

Sum of LOD scores over the nine cohorts for the microsatellite markers.
To narrow down the linkage region, we performed association analyses on this particular data to determine whether there existed any markers that showed significant evidence of association. The results of the microsatellite association test are shown in figure 3. The markers are also ordered by their chromosomal positions, while the p values are in a minus natural log scale. As we compared figure 2 and figure 3, the differences between an association analysis and a linkage analysis are evident. As expected by using association tests, our results from the microsatellite markers showed a clear peak that represents one single marker, D6S2884 (no. 49) with a p value of 3.15E–24 from the paired t-test. This p value will be still highly significant after the Bonferroni correction. D6S2884 is a dinucleotide repeat marker that has seven alleles detected in the current data. When comparing the allele frequencies between the cases and the controls, we observed the largest difference at the allele with the smallest length (120 bp). The p value from the chi-squared test (2.20E–16) is much larger than what we have obtained from the paired t-test that suggests the t-test is potentially more powerful at the current situation. D6S2884 (build 36 physical position: 32 505 589) is located between two genes, BTNL2 and HLA-DRA. The two neighbouring markers right next to D6S2884 span approximately 349 kb on chromosome 6 (build 36: from 32446570 to 32795325), which contains the BTNL2, HLA-DR, HLA-DQA1 and HLA-DQB1 genes.
Fig. 3.

Association study of the microsatellite markers by paired t-test: −ln(p value) vs. marker.
Using SNPs in the association analysis may further narrow down the signal region because of their dense coverage on the human genome. Figure 4 shows the association results for the SNP markers in the OPA1 and OPA2 sets. The markers are also ordered by their chromosomal positions, while the p values are in a minus natural log scale. We excluded those SNP markers that were either uninformative or unsuccessful at the genotyping step. Figure 4 shows a very sharp peak in the MHC class II region along with many low peaks. The highest peaks for the OPA1 and OPA2 panels are located around 32.7 Mb, which is at approximately the same position as we observed in the microsatellite markers. Most of the p values in the two OPA panels are quite small and 296 of them are still highly significant after the most stringent Bonferroni correction for multiple testing.
Fig. 4.

Association study of the SNPs in the OPA1 and OPA2 sets: −ln(p value) vs. marker.
Here, we present the top 20 significant SNPs in table 1. The markers in table 1 are ordered by their physical positions, and in addition their relative positions to the MHC genes are also listed. These 20 SNPs are located in a narrow 284-kb region (build 36: from 32509195 to 32793528) on the human MHC that is almost the same peak location as we observed in the microsatellite markers. The region covers human MHC from HLA-DRA to HLA-DQB. Furthermore, we observed the smallest p value of 2.80E–32 at marker rs6927022 that falls in between HLA-DQA1 and HLA-DQB1.
Table 1.
Twenty most significant SNPs in the association analyses (the SNPs are listed in the chromosomal order)
| Rank | Reference ID | p value | Position (bp) | Location to the genes |
|---|---|---|---|---|
| 15 | rs3135338 | 3.92E–21 | 32509195 | Between BTNL2 and HLA-DRA |
| 10 | rs3135335 | 5.91E–23 | 32509823 | Between BTNL2 and HLA-DRA |
| 11 | rs2395178 | 5.91E–23 | 32513340 | Between BTNL2 and HLA-DRA |
| 8 | rs3129871 | 7.67E–25 | 32514320 | HLA-DRA |
| 14 | rs3129883 | 3.96E–22 | 32518115 | HLA-DRA |
| 20 | rs660895 | 2.86E–18 | 32685358 | Between HLA-DRB5 and HLA-DQA1 |
| 17 | rs2040410 | 8.36E–20 | 32710676 | Between HLA-DRB5 and HLA-DQA1 |
| 1 | rs6927022 | 2.80E–32 | 32720375 | Between HLA-DQA1 and HLA-DQB1 |
| 18 | rs7744001 | 1.52E–19 | 32734064 | Between HLA-DQA1 and HLA-DQB1 |
| 12 | rs1063355 | 1.77E–22 | 32735692 | HLA-DQB1 |
| 5 | rs9275184 | 2.60E–27 | 32762692 | Between HLA-DQB1 and HLA-DQA2 |
| 16 | rs2157051 | 5.02E–20 | 32766602 | Between HLA-DQB1 and HLA-DQA2 |
| 7 | rs2856726 | 2.16E–25 | 32774699 | Between HLA-DQB1 and HLA-DQA2 |
| 6 | rs2647050 | 5.28E–26 | 32777745 | Between HLA-DQB1 and HLA-DQA2 |
| 4 | rs9275495 | 3.82E–28 | 32781552 | Between HLA-DQB1 and HLA-DQA2 |
| 19 | rs2647087 | 5.87E–19 | 32789027 | Between HLA-DQB1 and HLA-DQA2 |
| 13 | rs2858331 | 2.80E–22 | 32789255 | Between HLA-DQB1 and HLA-DQA2 |
| 2 | rs7454108 | 2.13E–29 | 32789461 | Between HLA-DQB1 and HLA-DQA2 |
| 3 | rs3998159 | 7.35E–29 | 32789997 | Between HLA-DQB1 and HLA-DQA2 |
| 9 | rs3916765 | 7.91E–24 | 32793528 | Between HLA-DQB1 and HLA-DQA2 |
HLA, human leucocyte antigen; SNP, single nucleotide polymorphism.
Besides these high peak markers, we also observed many significant markers as low peaks. Some of these low peak markers are quite interesting as they reside in the coding sequences of a gene. We know that most SNPs are located outside the coding sequences of the genome. SNPs falling within the coding sequences are of a particular interest because they may change the amino acid and the function of proteins. Among the 296 significant SNPs, we found that 28 of them are located in the coding regions of known genes (table 2). Furthermore, 16 of these SNPs can lead to missense mutations, while the others are synonymous and will not change the structure of a protein. We observed several genes with multiple significant SNPs falling into their coding sequences. Among them, BAT2 and NOTCH4 are situated upstream of the high peak region. We detected seven and six coding SNPs, respectively, in these two genes; and some of these SNPs can cause missense mutations. The SNPs that can lead to missense mutation of genes are worthy of further investigation.
Table 2.
Significant single nucleotide polymorphisms in the coding regions of the MHC genes
| Reference ID | Position (bp) | p value | Gene | Gene description | Mutation type |
|---|---|---|---|---|---|
| rs3130071 | 31702607 | 3.5291E–08 | BAT2 | HLA-B associated transcript 2 | Synonymous |
| rs1046080 | 31703861 | 1.4404E–10 | BAT2 | HLA-B associated transcript 2 | Missense |
| rs3130626 | 31706468 | 2.5048E–09 | BAT2 | HLA-B associated transcript 2 | Synonymous |
| rs1046089 | 31710946 | 6.7448E–10 | BAT2 | HLA-B associated transcript 2 | Missense |
| rs9267522 | 31711749 | 1.5047E–09 | BAT2 | HLA-B associated transcript 2 | Synonymous |
| rs3132453 | 31712023 | 8.2357E–06 | BAT2 | HLA-B associated transcript 2 | Missense |
| rs10885 | 31712570 | 3.3488E–08 | BAT2 | HLA-B associated transcript 2 | Missense |
| rs3130617 | 31735502 | 2.2413E–09 | C6orf47 | Chromosome 6 open reading frame 47 | Missense |
| rs3130618 | 31740113 | 2.5048E–09 | BAT4 | HLA-B associated transcript 4 | Missense |
| rs707938 | 31837338 | 6.6872E–06 | MSH5 | mutS homologue 5 | Synonymous |
| rs2227956 | 31886251 | 1.6992E–12 | HSPA1L | Heat shock 70 kDa protein 1-like | Missense |
| rs4151659 | 32026443 | 3.7743E–07 | CFB | Complement factor B | Missense |
| rs1150752 | 32172704 | 8.2357E–06 | TNXB | Tenascin XB | Missense |
| rs1800684 | 32259972 | 9.3664E–13 | AGER | Advanced glycosylation end product–specific receptor | Synonymous |
| rs8192583 | 32271252 | 1.9032E–07 | NOTCH4 | Notch homologue 4 (Drosophila) | Synonymous |
| rs8192579 | 32271777 | 4.2004E–07 | NOTCH4 | Notch homologue 4 (Drosophila) | Synonymous |
| rs3134942 | 32276749 | 7.0482E–06 | NOTCH4 | Notch homologue 4 (Drosophila) | Synonymous |
| rs1044506 | 32280043 | 6.117E–14 | NOTCH4 | Notch homologue 4 (Drosophila) | Synonymous |
| rs8192591 | 32293774 | 5.733E–07 | NOTCH4 | Notch homologue 4 (Drosophila) | Missense |
| rs915894 | 32298368 | 3.5545E–06 | NOTCH4 | Notch homologue 4 (Drosophila) | Missense |
| rs7775397 | 32369230 | 5.7901E–08 | C6orf10 | Chromosome 6 open reading frame 10 | Missense |
| rs1265754 | 32411670 | 5.7901E–08 | C6orf10 | Chromosome 6 open reading frame 10 | Missense |
| rs2076523 | 32478813 | 5.0643E–06 | BTNL2 | Butyrophilin-like protein 2 | Missense |
| rs3135391 | 32518965 | 4.0409E–10 | HLA-DRA | MHC class II, DR alpha | Synonymous |
| rs1049110 | 32834781 | 5.7452E–12 | HLA-DQB2 | MHC class II, DQ beta 2 | Missense |
| rs1573649 | 32839236 | 9.0492E–11 | HLA-DQB2 | MHC class II, DQ beta 2 | Missense |
| rs2071554 | 32892653 | 1.9149E–08 | HLA-DOB | MHC class II, DO beta | Synonymous |
| rs516535 | 33050280 | 2.4573E–08 | BRD2 | Bromodomain-containing protein 2 | Synonymous |
HLA, human leucocyte antigen; MHC, major histocompatibility complex.
Discussion
This study involved both linkage analyses and microsatellite-based and SNP-based association analyses for T1D in the human MHC region. For linkage analysis, we adopted a fully penetrant recessive model with no phenocopies and low disease allele frequency. Knapp et al. [11] demonstrated that analysis under such a recessive model of inheritance is equivalent to identity-by-descent (IBD) sharing analysis when parents are unaffected in the nuclear families. As most parents in our data are unaffected with T1D, which can also be true for some other affected sib-pair (ASP) studies, our model-based linkage analysis can emulate non-parametric IBD sharing method, the mean test [12]. As a result, two approaches (MLINK and ASP means test) obtained almost identical results with this particular data (the results are not shown in the paper). Therefore, our results illustrate how we can determine the non-parametric IBD sharing in a real ASP data by using a parametric LOD score method.
We performed two-point, rather than multipoint, linkage analysis in our data. Most multipoint linkage methods assume linkage equilibrium among markers. However, this assumption is only valid for sparsely spaced maps. The dense SNP and microsatellite maps used in our study will result in markers in strong linkage disequilibrium (LD), which can inflate the type 1 error rate in multipoint linkage analysis. Two-point linkage analysis is not affected by LD; hence, it can produce more reliable results.
In addition to linkage analyses, we also implemented family-based association tests with the data. Our results provided a good example for illustrating the difference and the advantage of using both linkage and association analyses. The linkage results showed a general widespread significant region. By performing associations on the same data, we were able to narrow down the peak dramatically. Our results also illustrated how we can detect the same signal by using different type of markers (microsatellites and SNPs) and from different statistical approaches (paired t-test and McNemar's test).
As we detected 296 significant SNPs in a narrow genomic region, some of these markers will be very close to each other and in strong LD. Therefore, although we have SNPs that stand for independent signals without LD, some high-LD markers can produce correlated associations in this study. Intermarker LD and haplotype-based analysis can help to improve statistical tests when single marker tests are not sufficient. However, high-LD and long haplotype blocks will also deter fine mapping precisely. Our SNPs with the smallest p values fell into the HLA-DR and HLA-DQ region that confers the major genetic risks for T1D as reported in the previous studies. SNPs with less significant p values were also detected at other places or even in the MHC genes. The relationship between the less significant MHC genes and the risk for T1D is worthy of further investigation.
Acknowledgments
This research used resources provided by the T1DGC, a collaborative clinical study sponsored by the National Institute of Diabetes and Digestive and Kidney Diseases (NIDDK), National Institute of Allergy and Infectious Diseases (NIAID), National Human Genome Research Institute (NHGRI), National Institute of Child Health and Human Development (NICHD), and Juvenile Diabetes Research Foundation International (JDRF) and supported by U01 DK062418. The authors thank Chad Haynes and Yaning Yang who provided programming and statistical help. This work has been supported by grant MH44292 from the U.S. National Institute of Mental Health and NSFC grant (project number 30730057) from the National Science Foundation of China.
Footnotes
Conflict of Interest: The authors declare that they have no conflicts of interest in the publication of this article.
References
- 1.Karvonen M, Viik-Kajander M, Moltchanova E, Libman I, LaPorte R, Tuomilehto J. Incidence of childhood type 1 diabetes worldwide. Diabetes Mondiale (DiaMond) Project Group. Diabetes Care. 2000;23:1516–1526. doi: 10.2337/diacare.23.10.1516. [DOI] [PubMed] [Google Scholar]
- 2.Todd JA, Walker NM, Cooper JD, et al. Robust associations of four new chromosome regions from genome-wide analyses of type 1 diabetes. Nat Genet. 2007;39:857–864. doi: 10.1038/ng2068. [DOI] [PMC free article] [PubMed] [Google Scholar]
- 3.Wellcome Trust Case Control Consortium. Genome-wide association study of 14,000 cases of seven common diseases and 3,000 shared controls. Nature. 2007;447:661–678. doi: 10.1038/nature05911. [DOI] [PMC free article] [PubMed] [Google Scholar]
- 4.Aly TA, Ide A, Jahromi MM, et al. Extreme genetic risk for type 1A diabetes. Proc Natl Acad Sci U S A. 2006;103:14074–14079. doi: 10.1073/pnas.0606349103. [DOI] [PMC free article] [PubMed] [Google Scholar]
- 5.Aly TA, Eller E, Ide A, et al. Multi-SNP analysis of MHC region: remarkable conservation of HLA-A1-B8-DR3 haplotype. Diabetes. 2006;55:1265–1269. doi: 10.2337/db05-1276. [DOI] [PubMed] [Google Scholar]
- 6.Rich SS, Concannon P, Erlich H, et al. The Type 1 Diabetes Genetics Consortium. Ann N Y Acad Sci. 2006;1079:1–8. doi: 10.1196/annals.1375.001. [DOI] [PubMed] [Google Scholar]
- 7.Lathrop GM, Lalouel JM, Julier C, Ott J. Strategies for multilocus analysis in humans. Proc Natl Acad Sci U S A. 1984;81:3443–3446. doi: 10.1073/pnas.81.11.3443. [DOI] [PMC free article] [PubMed] [Google Scholar]
- 8.Cottingham RW, Jr, Idury RM, Schäffer AA. Faster sequential genetic linkage computations. Am J Hum Genet. 1993;53:252–263. [PMC free article] [PubMed] [Google Scholar]
- 9.Morton NE. The detection and estimation of linkage between the genes for elliptocytosis and the Rh blood type. Am J Hum Genet. 1956;8:80–96. [PMC free article] [PubMed] [Google Scholar]
- 10.McNemar Q. Note on the sampling error of the difference between correlated proportions or percentages. Psychometrika. 1947;12:153–157. doi: 10.1007/BF02295996. [DOI] [PubMed] [Google Scholar]
- 11.Knapp M, Seuchter SA, Baur MP. Linkage analysis in nuclear families. 2. Relationship between affected sib-pair tests and lod score analysis. Hum Hered. 1994;44:44–51. doi: 10.1159/000154188. [DOI] [PubMed] [Google Scholar]
- 12.Blackwelder WC, Elston RC. A comparison of sib-pair linkage tests for disease susceptibility loci. Genet Epidemiol. 1985;2:85–97. doi: 10.1002/gepi.1370020109. [DOI] [PubMed] [Google Scholar]