Abstract
The interest of the scientific community in regulatory CD4+ T cells has reached an enormously high level. Common agreement is that they inhibit not only the proliferation of CD4 and CD8 lymphocytes, but also the activities of natural killer cells and macrophages. However, very important issues concerning actual mechanism(s) and specificity of the action of regulatory T cells (Tregs) upon responder cells are still unsolved or vague. The best known marker for Tregs is the expression of transcription factor FoxP3, widely used for their enumeration. It is known that FoxP3 inhibits cytokine production so the most probable action of Tregs is direct. However, FoxP3 expression cannot be used for functional studies in humans. Therefore we identified human peripheral blood Tregs as a distinct, very well-defined population of peripheral blood T cells with reduced CD4 and high CD25 expression (CD4low CD25high), which fulfils the current phenotypic criteria identifying the Tregs by simultaneously expressing high amounts of FoxP3. We conclude that the definition of a CD4low CD25high phenotype is enough to unambiguously detect and study the regulatory function of these cells. On the functional level, the CD4low Tregs are able to non-specifically suppress the proliferation of autologous, previously polyclonally activated CD4+ and CD4− lymphocytes and to kill them by direct contact, probably utilizing intracellular granzyme B and perforin.
Keywords: CD4low, conjugates, human, killing mechanism, regulatory T cells
Introduction
If the number of published papers were a marker of the subject of maximum interest, then T regulatory cells (Tregs) would appear among the ‘hottest’ fields in immunology. The idea of immune regulation, (even if it is still meant in its old sense of suppression), has returned to the limelight after decades of disinterest.1 Indeed, for a better understanding of human pathology related to the immune system both decreased activity and increased activity of Tregs are important – the former may lead to one of many autoimmune diseases, while the latter may result in a deficient immune system, poorly capable of fighting, for example, viral infections or cancers. It is therefore to be expected that huge volumes of data have been published about the changing numbers and proportions of Tregs in different human diseases, generally confirming lower number of Tregs in patients with different autoimmune diseases, and higher numbers in patients with cancers.2,3 Initially, the Treg phenotype was defined as CD4+ CD25+ T cells, which was based on studies in mouse models.4,5 This approach was also used for enumeration of human Tregs; however, in the peripheral blood of healthy individuals of any age, there are always CD4+ CD25+ T cells – reflecting a certain level of activation in response to environmental antigenic challenge.6–9 Taking this constant presence of presumably activated CD4+ CD25+ T cells into consideration, the newest data suggest that only those CD4+ T cells with the highest CD25 expression (the CD4+ CD25high subpopulation) have a suppressive (regulatory) activity.10,11 Unfortunately, there is no clear, uniform and satisfactory cutoff for the level of CD25 that would decide which CD25+ cells should be considered CD25high. Some authors claim that only the upper 1–2% of CD4+ CD25+ cells are Tregs,12,13 whereas others put the cutoff at the upper 7–10% of the CD4+ CD25+ cells.14 All of these limits were arbitrary. The problem with identification of human regulatory CD4+ T cells seemed to be solved once FoxP3 – a transcription factor recognized as the new marker necessary for regulatory T-cell formation – was discovered15–20 and shown to suppress the production of interleukin-2 (IL-2), interferon-γ and IL-4.21 The CD4+ CD25high FoxP3+ phenotype has therefore become established as the proper and reasonably adequate way for enumeration of Tregs in human pathology.
The main unsolved problem with regulatory cells is that the mechanism of action of human regulatory T cells is largely unknown. There are currently two or three proposed mechanisms: direct cytotoxicity via cell to cell contact,22,23 induction of responder cell apoptosis by cytokine deprivation24 and indirect modulation via ‘suppressive’ cytokines, mainly IL-10.11,25 The latter mechanism is sometimes ascribed to cells that do not belong to the Treg family, while the actual Tregs are thought to secrete no cytokines and to rely on those secreted by other cells for their survival and function.26 It is now easy to study the Treg function in mice, because genetically modified animals have been designed in which FoxP3 expression is associated with that of green fluorescent protein and living Tregs can be easily detected.27 Unfortunately, this method of assessing the FoxP3 expression as an unequivocal marker of Tregs could not, for obvious reasons, be used for functional studies in humans, and in general the FoxP3 staining procedure that requires the cells to be fixed–permeabilized before FoxP3 staining makes its detection impractical for human functional studies. Considering all the above we ask in this paper if there is an unambiguous and non-arbitrary method with which to distinguish living human Tregs and what is the mechanism of action of such defined Tregs on other cells.
We have previously described a distinct human CD4+ lymphocyte subpopulation in the peripheral blood of healthy donors, in which CD4+ expression was about half that in the majority of CD4-positive T cells, which coined it a designation of CD4low.28 We have also shown this cellular population to be CD25high, CD95high, CD28low and CTLA-4+, i.e. it has a phenotype very similar to the regulatory T cells ‘rediscovered’ at the same time – the CD4+ CD25+ cells.29,30 In this paper we test if ‘our’ CD4low CD25high lymphocytes are in fact the Tregs and what is their mode of action.
Materials and methods
Subjects
Peripheral venous blood was obtained from 20 healthy volunteers of both sexes (average age 40·6 ± 15·23 years, age range 22–58 years). All participants were informed about the purpose of the study and gave their written informed consent. The project was approved by the Local Committee for Biomedical Research Ethics at the Medical University of Gdańsk. The exclusion criteria for healthy people included autoimmune diseases, neoplasms and acute or chronic inflammation. None of the healthy volunteers were taking medication that would influence the immune system.
Surface markers staining and fluorescence-activated cell sorting analysis of the extended phenotype of CD4low CD25high cells
One hundred microlitres of peripheral blood was stained for 30 min at room temperature with fluorescein isothiocyanate (FITC)–conjugated anti-CD3 and phycoerythrin (PE)-Cy5-conjugated anti-CD4 monoclonal antibodies (mAbs), and with either PE-conjugated anti-CD25, PE-conjugated anti-CD28 mAbs (all from Dako Cytomation, Gdynia, Poland), PE-conjugated anti-CD94, PE-conjugated anti-CD16+ CD56, PE-conjugated anti-CD161, or PE-conjugated anti-iNKT (BD Biosciences-Pharmingen, San Diego, CA). The expression of CD158b antigen was assayed on the cells stained with FITC-conjugated anti-CD158b (BD Biosciences-Pharmingen), PE-conjugated anti-CD25 and PE-Cy5-conjugated anti-CD4 mAbs. Red blood cells were removed from samples with NH4Cl/KHCO3 lysis buffer, and remaining cells were washed twice with phosphate-buffered saline (PBS) before fluorocytometric analysis. Appropriate fluorochrome-conjugated irrelevant mouse immunoglobulins of corresponding isotypes (DAKO Cytomation) were used as controls. The T lymphocytes were considered CD4low if they conformed to the strict definition of this population, described in our previous work.28 Fluorocytometry analysis was performed with the fluorescence-activated cell sorting (FACS) FACScan system (BD Biosciences, San Jose, CA). All fluorocytometric data were analysed with the WinMDI 2.9 (J. Trotter, The Scripps Institute, La Jolla, CA) software.
FoxP3 protein expression
To assess the FoxP3 protein expression in subpopulations of CD4+ lymphocytes, the peripheral blood mononuclear cells (PBMC) were surface stained with PE-Cy5-conjugated anti-CD4 mAb as described above and then with the intracellular FoxP3 staining kit (eBioscience, San Diego, CA) according to the manufacturer’s protocol. Briefly, after incubation in the ‘A’ buffer for 20 min at room temperature then for 24 hr at −20°, followed by incubation in the ‘B solution for 20 min at +4°, the cells were washed with PBS, and stained with 10 μl PE-conjugated anti-FoxP3 mAb (clone h-FOX-Y) in 100 μl of flow cytometry staining buffer (FCSB) and 20 μl blocking buffer, and after 25-min of incubation the cells were washed twice with the FCSB and analysed by flow cytometry. Appropriate PE-conjugated irrelevant mouse immunoglobulins were used as isotype control.
Perforin and granzyme B expression
For the estimation of perforin expression the cells were surface-stained with FITC-conjugated anti-CD3 and PE-Cy5-conjugated anti-CD4 mAbs, while cells that were used to assess the granzyme expression were stained extracellularly with PE-Cy5-conjugated anti-CD4 mAb and either with PE-conjugated anti-CD28 or PE-conjugated anti-CD25. Surface-stained cells were fixed with 2% paraformaldehyde for 15 min at room temperature. A 0·25% saponin buffer (Sigma Aldrich Chemie GmbH, Munich, Germany) was used to wash and permeabilize the cells. Fixed-permeabilized cells were resuspended in saponin buffer before adding 20 μl of PE-conjugate anti-perforin or FITC-conjugated anti-granzyme B mAbs (BD Biosciences-Pharmingen). After 30 min incubation at +4° temperature, cells were washed once with saponin buffer and then with PBS and analysed by flow cytometry.
Apoptosis assay
Cells cultured as above were stained with FITC-conjugated anti-CD3, PE-conjugated anti-Annexin V (BD Biosciences-Pharmingen) and PE-Cy5-conjugated anti-CD4 mAbs as described above except that they were washed twice with diluted Annexin V binding buffer (BD Biosciences-Pharmingen) (1 : 9 with distilled water), not with PBS.
Conjugate formation and cytotoxicity assay
The following assay was developed to test the ability of CD4low T cells to contact (form conjugates with) and kill activated PBMC. On day 0, PBMC from healthy volunteers were isolated and stimulated with immobilized anti-CD3 mAb (BD Biosciences-Pharmingen) at 1 μg/ml or Staphylococcus enterotoxin A (SEA; Sigma Chemical Co.), at final concentration of 250 ng/ml for 72 hr. On day 3, second PBMC samples were obtained from the same donors. For distinction of free cells and their conjugates, immediately before the conjugation/killing test the stimulated target PBMC were loaded with a supravital fluorescein derivative carboxyfluorescein succinimidyl ester (CFSE; 1 μm, 15 min at 37°), and fresh effector PBMC (presumably containing Tregs) were stained with PE-Cy5-conjugated anti-CD4 mAb as above, to allow for distinction of CD4low cells. Both stimulated and freshly isolated, stained PBMC were mixed at different target to effectors ratios –25 : 1 and 1 : 1, cultured for 0, 15, 30, 60 and 120 min at 37° and the conjugate formation was examined by flow cytometry. As a control, cells used for conjugate formation tests were stained with either PE-conjugated anti-CD4 or CFSE and separately cultured for 4 hr, showing no change in the CFSE or CD4 staining intensities after that time (not shown). Also, we did not see any double-positive cells in any of these controls. Additionally, to assess the actual killing, the mixture of cells was checked for damaged cells after 240 min by 7-aminoactinomycin D (7-AAD) staining; 5 μl of the standard 7-AAD solution (BD Biosciences-Pharmingen) was added to the cell mixtures and incubated at room temperature for 15 min before the FACS analysis.
Suppression of proliferation of activated autologous T cells
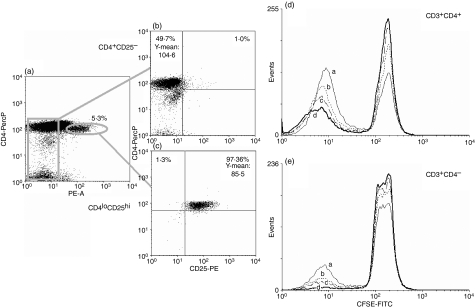
CD3+ CD4low CD25high lymphocytes and the mixed population containing the remaining CD25− lymphocytes and monocytes were sorted from the PBMC stained with appropriate monoclonal combinations using the FACS Aria (BD Biosciences-Pharmingen), as in Fig. 6a. Composition of the resulting cellular populations, especially purity of sorted CD3+ CD4low CD25high cells and the levels of CD4 expression, were determined as in Fig. 6(b, c). Sorted, CD3+ CD4low CD25high/+-depleted PBMC were loaded with CFSE as described above and stimulated with 5 μg/ml concanavalin A (Con A, Sigma) for 120 hr, without or with 5, 10 or 20% of sorted CD3+ CD4low CD25high cells added. The proportion of dividing (CFSE-diluting) cells was determined for CD3+ CD4+ and CD3+ CD4− lymphocytes after appropriate gating.
Figure 6.
CD4low CD25high lymphocytes inhibit the proliferation of autologous T cells in a dose-dependent manner. The experiment was set up as described in the Materials and methods. (a–c) Sorting strategy and the purities of resultant populations; Treg-depleted and CD25high-depleted peripheral blood mononuclear cells (PBMC) (b) purified CD4low CD25high Tregs (c). Sorted CD4low CD25high cells were admixed with the remaining Treg-depleted, CFSE-loaded, Con A-stimulated autologous PBMC at the following proportions: (a) none, (b) 5%, (c) 10% and (d) 20%, and their inhibitory activity was assessed after 120 hr in culture as the lowering proportion of CFSE-diluting proliferating CD4+ (d) and CD4− (e) lymphocytes. Both the sorting results and those of the proliferation inhibition test are representative for three experiments yielding similar results.
Cytokine production
Isolated PBMC were stimulated with phytohaemagglutinin for 4 hr, in RPMI-1640 medium containing 10% fetal calf serum and GolgiStop™ (BD Biosciences-Pharmingen). Afterwards the cells were surface-stained with PE-Cy5-conjugated anti-CD4 mAb and fixed in 2% paraformaldehyde for 30 min. The PE-conjugated anti-IL-10 mAb (BD Biosciences-Pharmingen) was added for 30 min in 0·25% saponin buffer. Stained cells were washed twice in PBS before recording the flow cytometry readout. The total of 10 000 cells per sample were collected using BD Biosciences-Pharmingen software and analysed with the WinMDI 2.9 program.
Statistical analysis
Data were analysed using a parametric unpaired or paired Student t-test after confirmation of normal distribution. All statistical analyses were performed with the StatSoft, Inc. (2005) statistica data analysis software system, version 7.1.(http://www.statsoft.com) under the Medical University of Gdańsk license agreement. P-values of ≤ 0·05 were taken to be significant in all tests.
Results
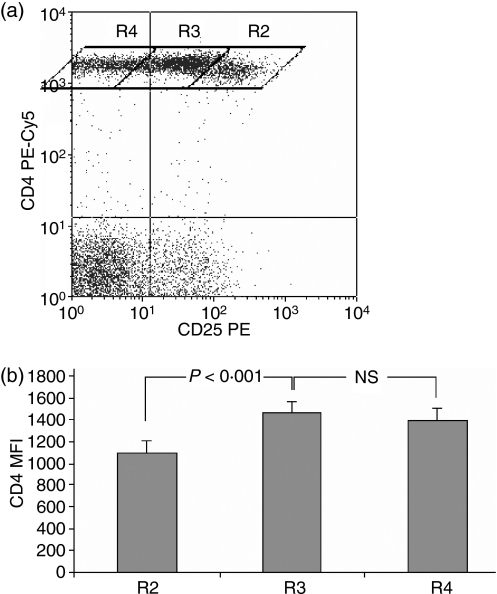
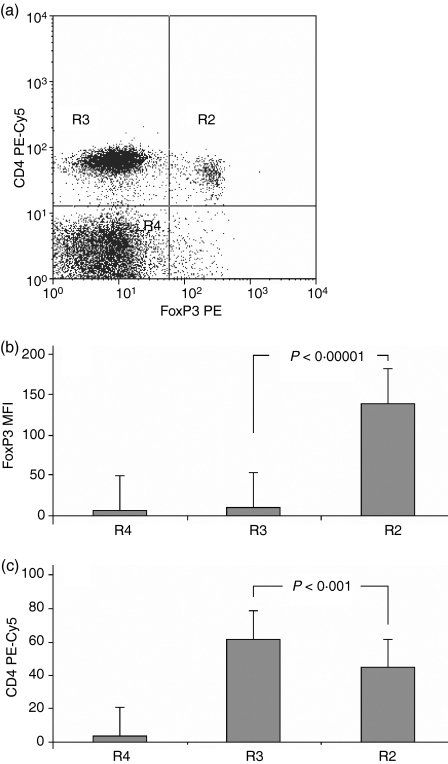
For the purpose of distinction of the CD4low from CD4+ cells and analysis of the CD25 levels in both populations we designed the plot regions to contain cells with null, low–intermediate and high CD25 expression (Fig. 1a). Rhomboid regions were adopted rather than rectangular ones, e.g. by Wang,31 because of visible overlapping of the lowest CD25 signal level shown by the CD4low population and the highest one shown by other CD4+ cells. Comparison of mean fluorescence intensities (MFIs) for the three CD4-positive subpopulations revealed that the highest mean CD25 expression occurs on the cells with the lowest CD4+ MFI and the changes are statistically significant (Fig. 1b). Thus defined, CD25high CD4low T cells were also strongly positive for FoxP3 staining (Fig. 2), gaining the phenotype description of CD4low CD25high FoxP3high. The CD4low T cells did not secrete IL-10 after 4 or 22 hr of stimulation (data not shown). Based on these results we concluded that CD4low T cells might belong to the regulatory T cells – the Treg subpopulation with a phenotype CD4low CD25high FoxP3high IL-10−.
Figure 1.
Distinct population of CD4lowlymphocytes shows the highest expression of CD25. (a) Division of the CD4+ lymphocyte population into three regions showing different CD4 and CD25 expression levels: R2, CD4low CD25high; R3, CD4+ CD25low/intermediate; R4, CD4+ CD25null based on CD25 expression and on distinction between the CD4+ and CD4low T cells, as described in ref. 28. A representative dot plot revealing the existence of three subsets of CD4+ T cells. (b) The R2 region contains CD4low T cells. The mean fluorescence of PE-Cy5-conjugated anti-CD4 is significantly lower in the R2 region compared with the R3 and R4 regions (n = 20, P < 0·001). Data are presented as means ± SD.
Figure 2.
CD4low T cells express high FoxP3 protein level. (a) A representative dot plot revealing the existence of two subpopulations of CD4+ lymphocytes differing in both their CD4 and FoxP3 expression. (b) Mean fluorescence of FoxP3 is significantly higher in region R2 containing CD4low T cells than in region R3 containing normal CD4+ lymphocytes (n = 20, P < 0·00001). (c) The mean fluorescence of CD4 expression is significantly lower in the R2 region, as compared to the R3 region, proving that the cells in the R2 region are CD4low. Data are presented as means ± SD (n = 20, P < 0·001).
The postulated role of the Tregs is to reduce (suppress) the activity of other previously activated, antigen- or stimulation-responsive, proliferating T cells. To check if putative Tregs as defined above might act via cell-to-cell contact, and if they contain mechanisms that could kill target cells, we decided to investigate whether they expressed perforin and granzyme B as well if they possess the ability to form conjugates with activated, autologous lymphocytes.
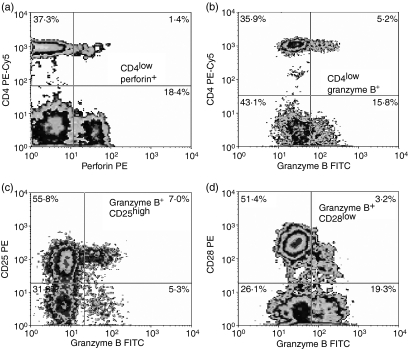
CD4low T cells express significant amounts of both intracellular perforin (Fig. 3a) and granzyme B (Fig. 3b). These granzyme-B-positive CD4low T cells also express high CD25 (in accord with their putative Treg phenotype) and low CD28 (Fig. 3c, d).
Figure 3.
CD4low T cells express perforin (a, upper right panel) and granzyme B (b, upper right panel). Granzyme-B-positive CD4low T cells are CD25high (c, upper right panel) and CD28low (d, upper right panel) compared with lymphocytes with normal CD4 expression (upper left quadrants in all panels). Representative density plots for five experiments yielding similar results are shown.
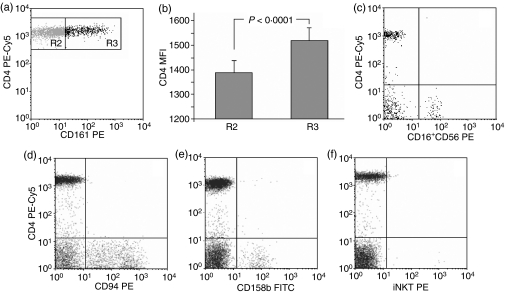
The latter feature might have suggested that the CD4low T cells belong in fact to the natural killer T (NKT) or – even less likely because of CD4 expression – to a subpopulation of the NK cells. To exclude the possibility of our putative Tregs being the NK or NKT cells, we had analysed them for the expression of common NK/NKT antigens, including: CD16, CD56, CD94, CD158b, CD161 and invariant NKT (iNKT). Staining with appropriate antibodies detecting the above-mentioned antigens revealed that – as expected – most of these antigens were not present on any CD4+ T cells (including the CD4low lymphocytes), with the exception of CD161 (Fig. 4a). However, CD4+ lymphocytes positive for CD161 had significantly higher CD4 expression than those with no CD161, as revealed by the MFI values for CD4 antibody signal on both CD161+ and CD161− populations (Fig. 4a, b), which allows us to conclude that CD4low T cells do not express CD161. Adequate specificity and working of the antibodies was confirmed by the presence of positive staining on CD4− T cells (the majority of them CD8+ T and NK cells) contained in the same samples. On the other hand, only a few NKT cells as measured by iNKT expression were found in the peripheral blood of healthy people, and they were definitely not CD4low T cells (Fig. 4f).
Figure 4.
CD4low T cells do not express any natural killer (NK) or NKT markers. Peripheral blood mononuclear cells (PBMC) were stained with anti-CD4 PE-Cy5 antibody and antibodies against CD16+56, CD94, CD158b, CD161 and iNKT markers as described in the Materials and methods. (a) The only marker present on CD4+ T cells is CD161, but the CD161-positive CD4+ T cells (R3 in a, b) had significantly higher CD4 expression, than CD161-negative CD4+ T cells (R2 in a, b) (b, data are presented as means ± SD). CD4+ T cells including the CD4low lymphocytes were negative for CD16+56 (c), CD94 (d), CD158b (e) and iNKT (f). Representative dot plots for 10 experiments yielding similar results are shown.
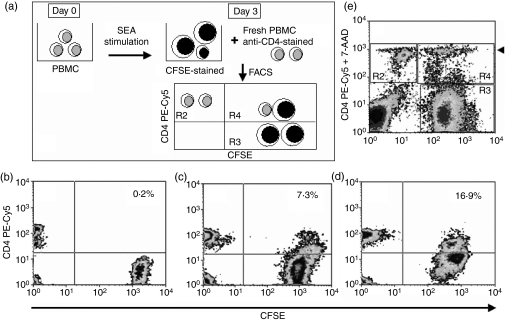
The CD4low T cells express both perforin and granzyme B and so, in essence, could kill susceptible cells on contact, so we checked their ability to form the conjugates with autologous PBMC polyclonally activated for 3 days in vitro, as target cells. These kinetic experiments showed that CD4low T cells were able to form conjugates with target cells as soon as 15 min into the test and with time the number of conjugates increased, reaching a maximum at 120 min from the moment of mixing the cells (Fig. 5). The expression of CD4 on cells forming the conjugates was significantly lower (P < 0·001) than on CD4+ T cells, which did not form conjugates, mean fluorescence of the CD4-bound antibody in these experiments being: 25·25 ± 2·41 and 45·26 ± 1·31 for conjugating and non-conjugating lymphocytes, respectively. Additionally, the percentage of conjugates formed by CD4low T cells was similar to the proportion of CD4low CD25high cells in the peripheral blood (not shown) and was greater in middle-aged groups than in young groups.
Figure 5.
CD4low T cells form conjugates with autologous activated peripheral blood mononuclear cells (PBMC) and kill them. Formation of conjugates (visualized in the region R4) was determined at 0 min (a), 30 min (b) and 120 min (c) and their proportion in the total CD4+ population is shown. The T cells forming conjugates have a significantly lower CD4 expression than the remaining CD4+ cells. (d) After 240 min of conjugate formation, the dead cells were detected with 7-AAD staining. The majority of CFSE-positive cells in conjugates in the region R4 were also 7-AAD positive, while only a few free CD4+ cells in the region R2 were also stained with 7-AAD (arrowhead). Representative figures for five experiments yielding similar results are shown.
To show if the conjugate formation was a first step to killing target autologous cells, we used an additional staining with 7-AAD to distinguish dead cells in the conjugates. The experiments revealed that after 240 min of incubation the majority of dead (7AAD+) cells were the CFSE-positive target cells (Fig. 5e). Additional staining with anti-CD4 PE-Cy5 antibody and 7-AAD showed that the CD4 T cells which formed conjugates were mostly alive (Fig. 5e), and confirmed that dead cells were within the conjugate region.
Further proof of the actual suppression of T-cell function by the CD4low CD25high lymphocytes was demonstrated in a proliferation inhibition test (Fig. 6). The PBMC of healthy individuals were depleted of the CD4low CD25high cells by FACS sorting (Fig. 6a–c), loaded with CFSE and used as proliferating targets by stimulation for 120 hr with Con A. Addition of 5–20% sorted autologous CD4low CD25high lymphocytes visibly reduced the proportion of CFSE-diluting, dividing cells both among the CD4+ and the CD4− (predominantly CD8+) populations (Fig. 6d, e). The proportion of dividing (CFSE-diluting) CD4+ cells significantly decreased from 58·1 ± 7·3% in the samples depleted of CD4low CD25high cells to 33·5 ± 7·2% at the 20% (1 : 5) ratio of putative Tregs to the targets (n= 3, P = 0·014), proving the suppressive activity of CD4low CD25high cells. For the CD4− population, the respective figures were 21·2 ± 5·8% dividing cells in Treg-depleted samples, and 3·5 ± 1·2% in the presence of 20% Tregs (P = 0·007). The latter result show that CD4low CD25high lymphocytes act as non-specific regulators–suppressors of activated T cells.
Discussion
In this study we were seeking a possible mechanism of human Treg action, based on a previous suggestion of the necessity of direct contact for their operation. We have confirmed that the CD4low CD25high lymphocytes that we described first28 also express high levels of FoxP3, which fulfils the phenotypic criterion for Treg distinction. We believe therefore that the feature of constant, significantly low expression of CD4 simultaneous with high expression of CD25 is a sufficient marker of functional human Tregs.
Using low expression of CD4 as putative alternative marker of the Treg population, we checked for the functionalities of this subpopulation, associated with Treg activities. The literature already suggested that the mechanism of action of Tregs was not associated with cytokine release26,32 and this is in full agreement with our data, showing especially a lack of any IL-10 secretion. We demonstrated that the CD4low T cells form detectable conjugates with activated autologous PBMC within 15 min of initial contact, reaching a maximum after 120 min of incubation. This effect is a prerequisite for cytotoxic killing of target cells, visible after 4 hr of conjugate formation. In our opinion, the ability to form the conjugates with and to kill autologous PBMC is a very strong indicator of the CD4low lymphocytes being the regulatory T cells acting by cell-to-cell contact. This theory is supported also by the demonstration that CD4low T cells express perforin and granzyme B, so possessing the mechanisms to perform killing of conjugated targets. The CD4+ CD28null T cells accumulating in the elderly also express granzyme B and perforin.33,34 However, in our study cohort recruited from young and middle-aged healthy volunteers the proportion of these cells in peripheral blood was less than 1% and, even more importantly, the CD4low T cells positive for granzyme B were also CD28 (low) positive. Granzyme B involvement in induced regulatory T cells (Tr1) and Treg (CD4+ CD25+) suppressive action was recently described35 in a knockout mouse model. Our demonstration of perforin expression in the cytoplasm of circulating CD4low T cells of human peripheral blood is in agreement with the suggested possible role for perforin for regulatory T-cell action.22,23 Interestingly, according to Grossman et al., human Tregs utilize granzyme A while our CD4low Tregs use granzyme B23. This may be another illustration of the complexity of the Treg system36 and supports the notion of CD4low CD25high cells being a novel human Treg population.
Our data showing their ability to eliminate the non-specifically (polyclonally) activated, autologous CD4+ cells suggest that it should be necessary for the Tregs to disappear after completion of their regulatory activity. To this end, we have observed that CD4low CD25high CD28low T cells contain an up to five times greater proportion of cells positive for Annexin V than the remaining CD4+ lymphocytes (not shown). The idea of rapid generation and disappearance of at least some Tregs is supported by a recent paper, showing a very fast turnover of CD4+ CD25high T cells in humans in vivo, possibly as progeny of memory T cells.37 It agrees also with the demonstration of strong dependency of the Tregs on cytokines supplied by activated T cells;26 the emerging picture would be that of a negative feedback, where Tregs kill the source of cytokines necessary for their own survival and then die off. Such dynamic appearance and disappearance of major regulators of adaptive immunity could be a very sensitive marker of immune status, bearing in mind reports on the low proportions of Tregs being associated with various autoimmune diseases,38 and on higher then normal proportions of Tregs detected in cancer patients.3
In the light of our findings, the most probable mode of action of human CD4low CD25high Treg cells is to ‘calm down’ the activation of the immune system by direct, non-specific elimination of activated, proliferating, target T (both CD4+ and CD8+) cells. We suggest that this action is not epitope-specific; accumulation of more Tregs, as seen for example in elderly humans39 and mice,40,41 leads to a widely observed general reduction of immune responsiveness (including its anti-cancer branch) rather than to reduced reactivity against specific pathogens.
Acknowledgments
This work was supported by a Polish State Committee for Scientific Research grant no. P05B 083 24 for E.B. We are grateful to Dr Piotr Trzonkowski for his help with FACS sorting the Treg cells. We also thank Dr Milica Vukmanovic-Stejic and Professor Arne Akbar for their critical reading of the manuscript and helpful discussions.
References
- 1.Germain RN. Special regulatory T-cell review: a rose by any other name: from suppressor T cells to Tregs, approbation to unbridled enthusiasm. Immunology. 2008;123:20–7. doi: 10.1111/j.1365-2567.2007.02779.x. [DOI] [PMC free article] [PubMed] [Google Scholar]
- 2.Tang Q, Bluestone JA. Regulatory T-cell physiology and application to treat autoimmunity. Immunol Rev. 2006;212:217–37. doi: 10.1111/j.0105-2896.2006.00421.x. [DOI] [PubMed] [Google Scholar]
- 3.Linehan DC, Goedegebuure PS. CD25+ CD4+ regulatory T-cells in cancer. Immunol Res. 2005;32:155–68. doi: 10.1385/IR:32:1-3:155. [DOI] [PubMed] [Google Scholar]
- 4.Beissert S, Schwarz A, Schwarz T. Regulatory T cells. J Invest Dermatol. 2006;126:15–24. doi: 10.1038/sj.jid.5700004. [DOI] [PubMed] [Google Scholar]
- 5.Sakaguchi S, Hori S, Fukui Y, Sasazuki T, Sakaguchi N, Takahashi T. Thymic generation and selection of CD25+ CD4+ regulatory T cells: implications of their broad repertoire and high self-reactivity for the maintenance of immunological self-tolerance. Novartis Found Symp. 2003;252:6–16. [PubMed] [Google Scholar]
- 6.Zola H, Mantzioris BX, Webster J, Kette FE. Circulating human T and B lymphocytes express the p55 interleukin-2 receptor molecule (TAC, CD25) Immunol Cell Biol. 1989;67:233–7. doi: 10.1038/icb.1989.35. [DOI] [PubMed] [Google Scholar]
- 7.Hemler ME, Brenner MB, McLean JM, Strominger JL. Antigenic stimulation regulates the level of expression of interleukin 2 receptor on human T cells. Proc Natl Acad Sci USA. 1984;81:2172–5. doi: 10.1073/pnas.81.7.2172. [DOI] [PMC free article] [PubMed] [Google Scholar]
- 8.Depper JM, Leonard WJ, Robb RJ, Waldmann TA, Greene WC. Blockade of the interleukin-2 receptor by anti-Tac antibody: inhibition of human lymphocyte activation. J Immunol. 1983;131:690–6. [PubMed] [Google Scholar]
- 9.Kapp JA. Special regulatory T-cell review: suppressors regulated but unsuppressed. Immunology. 2008;123:28–32. doi: 10.1111/j.1365-2567.2007.02773.x. [DOI] [PMC free article] [PubMed] [Google Scholar]
- 10.de KI, Wedderburn LR, Taams LS, et al. CD4+ CD25bright regulatory T cells actively regulate inflammation in the joints of patients with the remitting form of juvenile idiopathic arthritis. J Immunol. 2004;172:6435–43. doi: 10.4049/jimmunol.172.10.6435. [DOI] [PubMed] [Google Scholar]
- 11.Houot R, Perrot I, Garcia E, Durand I, Lebecque S. Human CD4+ CD25high regulatory T cells modulate myeloid but not plasmacytoid dendritic cells activation. J Immunol. 2006;176:5293–8. doi: 10.4049/jimmunol.176.9.5293. [DOI] [PubMed] [Google Scholar]
- 12.Liu W, Putnam AL, Xu-Yu Z, et al. CD127 expression inversely correlates with FoxP3 and suppressive function of human CD4+ Treg cells. J Exp Med. 2006;203:1701–11. doi: 10.1084/jem.20060772. [DOI] [PMC free article] [PubMed] [Google Scholar]
- 13.Fritzsching B, Oberle N, Pauly E, et al. Naive regulatory T cells: a novel subpopulation defined by resistance towards CD95L-mediated cell death. Blood. 2006;108:3371–8. doi: 10.1182/blood-2006-02-005660. [DOI] [PubMed] [Google Scholar]
- 14.Taams LS, Smith J, Rustin MH, Salmon M, Poulter LW, Akbar AN. Human anergic/suppressive CD4(+)CD25(+) T cells: a highly differentiated and apoptosis-prone population. Eur J Immunol. 2001;31:1122–31. doi: 10.1002/1521-4141(200104)31:4<1122::aid-immu1122>3.0.co;2-p. [DOI] [PubMed] [Google Scholar]
- 15.Khattri R, Cox T, Yasayko SA, Ramsdell F. An essential role for Scurfin in CD4+ CD25+ T regulatory cells. Nat Immunol. 2003;4:337–42. doi: 10.1038/ni909. [DOI] [PubMed] [Google Scholar]
- 16.Hori S, Nomura T, Sakaguchi S. Control of regulatory T cell development by the transcription factor Foxp3. Science. 2003;299:1057–61. doi: 10.1126/science.1079490. [DOI] [PubMed] [Google Scholar]
- 17.Suciu-Foca N, Manavalan JS, Cortesini R. Generation and function of antigen-specific suppressor and regulatory T cells. Transpl Immunol. 2003;11:235–44. doi: 10.1016/S0966-3274(03)00052-2. [DOI] [PubMed] [Google Scholar]
- 18.Chen W, Jin W, Hardegen N, et al. Conversion of peripheral CD4+ CD25− naive T cells to CD4+ CD25+ regulatory T cells by TGF-beta induction of transcription factor Foxp3. J Exp Med. 2003;198:1875–86. doi: 10.1084/jem.20030152. [DOI] [PMC free article] [PubMed] [Google Scholar]
- 19.Fontenot JD, Gavin MA, Rudensky AY. Foxp3 programs the development and function of CD4+ CD25+ regulatory T cells. Nat Immunol. 2003;4:330–6. doi: 10.1038/ni904. [DOI] [PubMed] [Google Scholar]
- 20.Itoh M, Takahashi T, Sakaguchi N, et al. Thymus and autoimmunity: production of CD25+ CD4+ naturally anergic and suppressive T cells as a key function of the thymus in maintaining immunologic self-tolerance. J Immunol. 1999;162:5317–26. [PubMed] [Google Scholar]
- 21.Bettelli E, Dastrange M, Oukka M. Foxp3 interacts with nuclear factor of activated T cells and NF-kappa B to repress cytokine gene expression and effector functions of T helper cells. Proc Natl Acad Sci USA. 2005;102:5138–43. doi: 10.1073/pnas.0501675102. [DOI] [PMC free article] [PubMed] [Google Scholar]
- 22.Shevach EM, DiPaolo RA, Andersson J, Zhao DM, Stephens GL, Thornton AM. The lifestyle of naturally occurring CD4+ CD25+ Foxp3+ regulatory T cells. Immunol Rev. 2006;212:60–73. doi: 10.1111/j.0105-2896.2006.00415.x. [DOI] [PubMed] [Google Scholar]
- 23.Grossman WJ, Verbsky JW, Barchet W, Colonna M, Atkinson JP, Ley TJ. Human T regulatory cells can use the perforin pathway to cause autologous target cell death. Immunity. 2004;21:589–601. doi: 10.1016/j.immuni.2004.09.002. [DOI] [PubMed] [Google Scholar]
- 24.Pandiyan P, Zheng L, Ishihara S, Reed J, Lenardo MJ. CD4+ CD25+ Foxp3+ regulatory T cells induce cytokine deprivation-mediated apoptosis of effector CD4+ T cells. Nat Immunol. 2007;8:1353–62. doi: 10.1038/ni1536. [DOI] [PubMed] [Google Scholar]
- 25.van Roon JA, Bijlsma JW, Lafeber FP. Diversity of regulatory T cells to control arthritis. Best Pract Res Clin Rheumatol. 2006;20:897–913. doi: 10.1016/j.berh.2006.06.006. [DOI] [PubMed] [Google Scholar]
- 26.Pandiyan P, Lenardo MJ. The control of CD4+ CD25+ Foxp3+ regulatory T cell survival. Biol Direct. 2008;3:6. doi: 10.1186/1745-6150-3-6. [DOI] [PMC free article] [PubMed] [Google Scholar]
- 27.Fontenot JD, Rasmussen JP, Williams LM, Dooley JL, Farr AG, Rudensky AY. Regulatory T cell lineage specification by the forkhead transcription factor foxp3. Immunity. 2005;22:329–41. doi: 10.1016/j.immuni.2005.01.016. [DOI] [PubMed] [Google Scholar]
- 28.Bryl E, Gazda M, Foerster J, Witkowski JM. Age-related increase of frequency of a new, phenotypically distinct subpopulation of human peripheral blood T cells expressing lowered levels of CD4. Blood. 2001;98:1100–7. doi: 10.1182/blood.v98.4.1100. [DOI] [PubMed] [Google Scholar]
- 29.Sakaguchi S. Regulatory T cells: key controllers of immunologic self-tolerance. Cell. 2000;101:455–8. doi: 10.1016/s0092-8674(00)80856-9. [DOI] [PubMed] [Google Scholar]
- 30.Chatenoud L, Salomon B, Bluestone JA. Suppressor T cells – they’re back and critical for regulation of autoimmunity! Immunol Rev. 2001;182:149–63. doi: 10.1034/j.1600-065x.2001.1820112.x. [DOI] [PubMed] [Google Scholar]
- 31.Wang J, Ioan-Facsinay A, van dV, Huizinga TW, Toes RE. Transient expression of FOXP3 in human activated nonregulatory CD4(+) T cells. Eur J Immunol. 2007;37:129–38. doi: 10.1002/eji.200636435. [DOI] [PubMed] [Google Scholar]
- 32.Vieira PL, Christensen JR, Minaee S, et al. IL-10-secreting regulatory T cells do not express Foxp3 but have comparable regulatory function to naturally occurring CD4+ CD25+ regulatory T cells. J Immunol. 2004;172:5986–93. doi: 10.4049/jimmunol.172.10.5986. [DOI] [PubMed] [Google Scholar]
- 33.Snyder MR, Muegge LO, Offord C, et al. Formation of the killer Ig-like receptor repertoire on CD4+ CD28null T cells. J Immunol. 2002;168:3839–46. doi: 10.4049/jimmunol.168.8.3839. [DOI] [PubMed] [Google Scholar]
- 34.Warrington KJ, Takemura S, Goronzy JJ, Weyand CM. CD4+ CD28− T cells in rheumatoid arthritis patients combine features of the innate and adaptive immune systems. Arthritis Rheum. 2001;44:13–20. doi: 10.1002/1529-0131(200101)44:1<13::AID-ANR3>3.0.CO;2-6. [DOI] [PubMed] [Google Scholar]
- 35.Gondek DC, Lu LF, Quezada SA, Sakaguchi S, Noelle RJ. Cutting edge: contact-mediated suppression by CD4+ CD25+ regulatory cells involves a granzyme B-dependent, perforin-independent mechanism. J Immunol. 2005;174:1783–6. doi: 10.4049/jimmunol.174.4.1783. [DOI] [PubMed] [Google Scholar]
- 36.Shevach EM. From vanilla to 28 flavors: multiple varieties of T regulatory cells. Immunity. 2006;25:195–201. doi: 10.1016/j.immuni.2006.08.003. [DOI] [PubMed] [Google Scholar]
- 37.Vukmanovic-Stejic M, Zhang Y, Cook JE, et al. Human CD4+ CD25hi Foxp3+ regulatory T cells are derived by rapid turnover of memory populations in vivo. J Clin Invest. 2006;116:2423–33. doi: 10.1172/JCI28941. [DOI] [PMC free article] [PubMed] [Google Scholar]
- 38.Baecher-Allan C, Hafler DA. Human regulatory T cells and their role in autoimmune disease. Immunol Rev. 2006;212:203–16. doi: 10.1111/j.0105-2896.2006.00417.x. [DOI] [PubMed] [Google Scholar]
- 39.Trzonkowski P, Szmit E, Mysliwska J, Mysliwski A. CD4+ CD25+ T regulatory cells inhibit cytotoxic activity of CTL and NK cells in humans – impact of immunosenescence. Clin Immunol. 2006;119:307–16. doi: 10.1016/j.clim.2006.02.002. [DOI] [PubMed] [Google Scholar]
- 40.Nishioka T, Shimizu J, Iida R, Yamazaki S, Sakaguchi S. CD4+ CD25+ Foxp3+ T cells and CD4+ CD25− Foxp3+ T cells in aged mice. J Immunol. 2006;176:6586–93. doi: 10.4049/jimmunol.176.11.6586. [DOI] [PubMed] [Google Scholar]
- 41.Sharma S, Dominguez AL, Lustgarten J. High accumulation of T regulatory cells prevents the activation of immune responses in aged animals. J Immunol. 2006;177:8348–55. doi: 10.4049/jimmunol.177.12.8348. [DOI] [PubMed] [Google Scholar]


