

Abstract
The region that surrounds the central canal of the spinal cord derives from the neural tube and retains a substantial degree of plasticity. In turtles, this region is a neurogenic niche where newborn neurons coexist with precursors, a fact that may be related with the endogenous repair capabilities of low vertebrates. Immunohistochemical evidence suggests that the ependyma of the mammalian spinal cord may contain cells with similar properties, but their actual nature remains unsolved. Here, we combined immunohistochemistry for cell-specific markers with patch-clamp recordings to test the hypothesis that the ependyma of neonatal rats contains immature neurons similar to those in low vertebrates. We found that a subclass of cells expressed HuC/D neuronal proteins, doublecortin, and PSA-NCAM (polysialylated neural cell adhesion molecule) but did not express NeuN (anti-neuronal nuclei). These immature neurons displayed electrophysiological properties ranging from slow Ca2+-mediated responses to fast repetitive Na+ spikes, suggesting different stages of maturation. These cells originated in the embryo, because we found colocalization of neuronal markers with 5-bromo-2′-deoxyuridine when injected during embryonic day 7–17 but not in postnatal day 0–5. Our findings represent the first evidence that the ependyma of the rat spinal cord contains cells with molecular and functional features similar to immature neurons in adult neurogenic niches. The fact that these cells retain the expression of molecules that participate in migration and neuronal differentiation raises the possibility that the ependyma of the rat spinal cord is a reservoir of immature neurons in “standby mode,” which under some circumstances (e.g., injury) may complete their maturation to integrate spinal circuits.
Introduction
The region that surrounds the central canal (CC) of the spinal cord is a plastic structure. For example, ependymal cells in the spinal cord of rats and mice react to injury providing limited endogenous repair (Beattie et al., 1997; Mothe and Tator, 2005; Meletis et al., 2008). This kind of plasticity is outstanding in some low vertebrates, in which the CC region organizes the reconnection of the cord after transection (Dervan and Roberts, 2003). Postnatal endogenous repair mechanisms may be related to the preservation of progenitor cells similar to those in the embryo. In the region around the CC of juvenile turtles, there are cells with functional and molecular properties of neurogenic precursors intermingled with others that express early neuronal markers and fire action potentials, indicating they are immature neurons immersed in a neurogenic environment (Fernández et al., 2002; Russo et al., 2004, 2008). Some studies suggest that the ependyma of mammals may retain similar properties which may support endogenous repair mechanisms (Danilov et al., 2006; Shechter et al., 2007).
In some niches of the adult mammalian brain, new neurons are generated throughout life (Lim et al., 2008). During differentiation, these cells initially express doublecortin (DCX) and poly-sialylated neural cell adhesion molecule (PSA-NCAM), which are typical of migrating neuroblasts (Kuhn and Peterson, 2008). As they integrate to existing circuits, they become negative for DCX and PSA-NCAM, start expressing anti-neuronal nuclei (NeuN), and acquire electrophysiological properties of mature neurons (van Praag et al., 2002). Some ependymal cells in the adult mammalian spinal cord proliferate (Johansson et al., 1999; Meletis et al., 2008), but their differentiation toward the neuronal lineage seems inhibited (Horner et al., 2000). However, immunohistochemical studies have shown that there are neuron-like cells within the ependyma that express proteins typical of neuroblasts in neurogenic niches (Alonso, 1999; Stoeckel et al., 2003; Shechter et al., 2007). Whether these neuron-like cells are similar to those in adult neurogenic niches remains unclear.
Anatomical (Vigh and Vigh-Teichmann, 1998) and immunohistochemical (Alonso, 1999, Stoeckel et al., 2003) evidences suggest that some cells in the ependyma of the rat resemble immature neurons in turtles (Russo et al., 2004). Interestingly, ependymal cells in the spinal cord have neural stem cell potential (Meletis et al., 2008) and may provide a favorable environment for neuroblasts. We thus hypothesized that some CC-contacting cells in the rat are neuroblasts similar to those in neurogenic niches. Here, we tested this hypothesis by combining immunohistochemistry for cell type specific markers with patch-clamp recordings of CC-contacting cells in neonatal rats [postnatal day 0–5 (P0–P5)]. We found that a subclass of cells expressed HuC/D, DCX, and PSA-NCAM but did not express NeuN. They displayed electrophysiological properties ranging from slow Ca2+-mediated responses to fast, repetitive Na+ spikes, and originated in the embryo as shown by 5-bromo-2′-deoxyuridine (BrdU) birthdating analysis. Our findings represent the first evidence that the ependyma in the mammalian spinal cord contains cells with molecular and functional features similar to immature neurons in adult neurogenic niches and may imply novel forms of plasticity.
Materials and Methods
General.
Neonatal rats (Sprague Dawley, P0–P5) were used following the guidelines of our local Committee for Animal Care and Research (Comisión Honoraria de Experimentación Animal, Universidad de la República, Montevideo, Uruguay). For some electrophysiological and immunohistochemical experiments, P15–P18 and P >21 rats were used.
Immunohistochemistry.
Animals were anesthetized (50 mg/kg, i.p.; Pentobarbital) and fixed by intracardiac perfusion with 10% paraformaldehyde in 0.1 m phosphate buffer (PB, pH 7.4). To identify the molecular phenotype of cells around the CC, we used the following primary antibodies: (1) anti-HuC/D (mouse monoclonal, 1:50; Invitrogen); (2) NeuN (mouse monoclonal, 1:200; Millipore); (3) PSA-NCAM (mouse monoclonal, 1:10; Developmental Studies Hybridoma Bank); (4) anti-doublecortin (goat polyclonal C-18, 1:200; Santa Cruz Biotechnology); (5) anti-BrdU (mouse monoclonal, 1:500; Dako Cytomation) or (6) anti-BrdU (rabbit polyclonal, 1:10.000; Megabase Research); (7) anti-PCNA (rabbit polyclonal, 1:100; Santa Cruz Biotechnology); (8) anti neurofilament-M (rabbit polyclonal, 1:500; Millipore Bioscience Research Reagents); (9) anti-S100β (rabbit polyclonal, 1:500; Sigma-Aldrich); and (10) anti-PCM-1 (rabbit polyclonal, 1:500; Dr. A. Merdes, Centre National de la Recherche Scientifique, Pierre Farbre, France). Tissues were sectioned with a vibrating microtome (60–80 μm) and placed in PB with 0.5% bovine serum albumin (BSA) for 30 min and then incubated with the primary antibodies diluted in PB with 0.3% Triton X-100 (Sigma-Aldrich). Incubation times and antibody concentrations were optimized for each case. After washing in PB, tissues were incubated in secondary antibodies conjugated with different fluorophores or horseradish peroxidase. The horseradish peroxidase was revealed with 3,3′-diaminobenzidine (DAB, Sigma-Aldrich). In some cases, the Zenon labeling kit (Invitrogen) was used according to the instructions of the manufacturer. When performing colabeling experiments, Alexa 488 and 633 (Invitrogen) were used to avoid cross talk. Colocalization for DCX, PSA-NCAM, and HuC/D was analyzed in 10 60-μm-thick sections that were chosen randomly to avoid subjective bias (n = 3 rats). To reveal the nuclei of CC-contacting cells, sections were stained with the nuclear stain Syto 64 (Invitrogen). We made control experiments suppressing primary antibodies during tissue processing. The histological material was visualized with light transmitted illumination, conventional epifluorescence or confocal microscopy (Olympus VF300). The images were acquired with Fluoview 5 (Olympus). Z-stacks, three-dimensional, and orthogonal views were generated and then exported to Photoshop 7 or Corel Draw for image adjustment.
Transmission electron microscopy.
Anesthetized animals were fixed by intracardiac perfusion with 4% paraformaldehyde and 1% glutaraldehyde in 0.1 m PB, pH 7.4. Tissues were sectioned with a Vibratome (50–60 μm). Transmission electron microscopy (TEM) studies were performed in postfixed tissues (1% OsO4 in PB 0.1 m) that were epoxy-resin embedded. Ultrathin sections were contrasted with uranyl acetate and lead citrate.
TEM immunohistochemistry.
Floating sections processed for revealing HuC/D and DCX with DAB (Sigma-Aldrich) using the ABComplex (Dako Cytomation) were postfixed in 1% OsO4 in PB 0.1 m, washed, and dehydrated as usual. The sections were finally resin epoxy embedded in flat molds that allowed transillumination and localization of the stained cells. After precise trimming of the block, the stained cells were ultrathin sectioned. Series of sections were mounted on one-hole grids (rectangular opening, 2 × 1 mm), covered with formvar, and contrasted with uranyl acetate and lead citrate.
Slice preparation and electrophysiology.
Rats anesthetized with isoflurane (Forane) were decapitated and the cervical enlargement was dissected out in chilled Ringer's solution of the following composition (in mm): NaCl, 101; KCl, 3.8; MgCl2, 18.7; CaCl2, 1; MgSO4.6H2O, 1.3; HEPES, 10; KH2PO4, 1.2; and glucose, 25; saturated with 5% CO2 and 95% O2, pH 7.4. Transverse 300-μm-thick slices were cut, placed in a chamber (1 ml of volume), and superfused (1 ml min−1) with Ringer's solution (in mm): NaCl, 124; KCl, 2.4; NaHCO3, 26; CaCl2, 2.4; MgSO4.6H2O, 1.3; HEPES, 1.25; KH2PO4, 1.2; and glucose, 10; saturated with 5% CO2 and 95% O2 to keep pH 7.4. All experiments were performed at room temperature. Cells were visualized with differential interference contrast (DIC) optics (Leica DM LFS) with a 40× (0.8 numerical aperture) objective. Patch-clamp whole-cell recordings were obtained with electrodes filled with (in mm): K-gluconate, 122; Na2-ATP, 5; MgCl2, 2.5; CaCl2, 0.003; EGTA, 1; Mg-gluconate, 5.6; K-HEPES, 5; H-HEPES, 5; and biocytin, 10; pH 7.4; 5–10 MΩ. In some cases, Lucifer yellow (0.1–0.5%, Sigma-Aldrich) or Alexa 488 hydrazide (250–500 μm, Invitrogen) were added to the pipette solution. Current- and voltage-clamp recordings were performed with an Axoclamp 2B or a Multiclamp 700B (Molecular Devices). Current and voltage steps were generated with pClamp10 (Molecular Devices), which was also used for further analysis. All cells were first studied in current clamp to characterize the intrinsic response properties (Russo and Hounsgaard, 1999). Series resistance and whole-cell capacitance were not compensated. In voltage clamp mode, cells were held at −70 mV, and the resting membrane potential was estimated from the current-voltage relationship (at I = 0). To subtract leak currents we used a P4 protocol provided by Clampex10 (Molecular Devices) that allowed simultaneous storage of raw and leak subtracted data. Liquid junction potentials were determined and corrected off-line (Barry and Diamond, 1970). Values are expressed as the mean ± SEM. Statistical significance (p < 0.05) was evaluated using the Mann–Whitney U test. To explore whether the different electrophysiological phenotypes of CC-contacting cells were correlated with age, we used the χ2 test at p < 0.05. As the null hypothesis (Ho), we assumed that phenotypes and postnatal age (P0–P5) were independent characteristics.
The voltage dependence of activation for K+ currents was determined from whole-cell conductance (G) versus membrane potential measurements (V m) using the formula G = I/ (V m − V reversal). The reversal potential (V reversal), was assumed to equal the K+ equilibrium potential (−102 mV) as calculated with the Nernst equation. The resulting curves were fitted with Boltzmann functions. Voltage-dependent inactivation properties were determined by applying conditioning voltage steps from a −70 mV holding potential to levels ranging from −100 to 10 mV in 10 mV steps. The membrane potential was then set to 30 mV and the peak current amplitudes were measured, normalized relative to their maximum value, and plotted versus the conditioning-voltage amplitude. The half-activation voltage (V h) and the slope factor (k h) were estimated by fitting a Boltzmann function to the data.
In some experiments, the following drugs or ionic substitutions were introduced to the normal Ringer's solution: tetrodotoxin (TTX, 1 μm; Alomone Labs) to block Na+ channels, Mn2+ (3 mm) to block the Ca2+ channels, Ni2+ (300 μm) to block the T-type Ca+2 channels, tetraethylammonium (TEA, 10 mm; Sigma-Aldrich) to block K+ channels, 4-aminophyridine (4-AP, 1–2 mm; Sigma-Aldrich) to block A-type K+ channels, and gabazine (10 μm, Tocris) to block GABAA receptors.
GABA (100 μm) and ATP (100 μm) diluted in normal Ringer's solution were pressure ejected from patch pipettes (2 μm tip diameter) using a Picospritzer III (Parker Instrumentation) controlled by Clampex10. Changes in the pH of the microenvironment surrounding the recorded cell were made by puffing a modified Ringer's solution buffered at pH 6.0 in which NaHCO3 was lowered to 17.25 mm and HEPES was replaced by 10 mm MES.
Morphological identification of recorded cells.
During whole-cell patch-clamp recordings 165 cells were filled with a fluorophore and/or biocytin. Cells were filled for at least 10 min and the slices were fixed by immersion in 4% paraformaldehyde in 0.1 m PB for 12–24 h. In some cases, cells were visualized in living slices by injecting Lucifer yellow or Alexa 488 and the resulting images were acquired with an FG7 frame grabber (Scion Instruments) using ImageJ (NIH). Although leakage from the pipette was usually sufficient to get good stainings, in most cases we applied current or voltage pulses (500 ms at 1 Hz) after the electrophysiological characterization to iontophorese either biocytin or fluorophores. After overnight PB rinsing, the slices were blocked with 0.5% BSA in PB (1 h) and then incubated in a solution containing 0.3% Triton X-100 with either the streptavidin-fluorophore complex (streptavidin-Alexa 488 or 633, 2 h). Slices incubated with fluorophores were mounted in glycerol and examined with a confocal microscope (Olympus FV 300).
Perforated patch-clamp recordings.
To avoid changing the intracellular Cl− concentration ([Cl−]i), we made perforated-patch recordings using the cation-selective ionophore gramicidin (Myers and Haydon, 1972; Kyrozis and Reichling, 1995). The gramicidin-containing pipette solution was made for each experiment from a stock solution (5 mg/ml in DMSO, stored at −20°C) in prefiltered intracellular solution to yield a final concentration of 5 μg/ml. The solution was used within 2 h after preparation. To facilitate gigaseal formation, the tip of the electrode was filled with gramicidin-free patch solution containing Alexa 488 (250 μm) by briefly (∼2–4 s) immersing the back of the pipette into the solution. The liquid junction potential (4 mV) was corrected off-line.
BrdU labeling.
To determine the date of birth of putative CC-contacting neurons we injected neonatal rats (P0–P5, n = 9) daily with BrdU (100 mg/kg, i.p.; Sigma-Aldrich). The animals were killed 1, 10, and 17 d after the last BrdU injection. Pregnant rats (n = 4) were injected with BrdU (100 mg/kg, i.p.) every 48 h between embryonic day 7–17 (E7–E17). Pups were killed during the first five postnatal days and 30 d after the last injection. Transverse spinal cord sections (60–80-μm-thick) were rinsed in PB and incubated in 2N HCl (30 min) followed by incubation with proteinase K at 0.2 mg/ml (10 min). After several rinses, sections were blocked with 5% goat serum in PB with 0.3% Triton X-100 and placed overnight in mouse anti-BrdU diluted 1:500 in PB and 0.3% Triton X-100. After washing, the tissues were incubated with a secondary serum conjugated with a fluorophore (Alexa 488, Alexa 546, or Alexa 633; Invitrogen). BrdU labeling was then combined with immunohistochemistry for HuC/D, DCX, or PSA-NCAM.
Results
Immature neurons around the CC: molecular clues
The spinal cord of turtles contains cells attached to the CC that express the early neuronal marker HuC/D (Russo et al., 2004, 2008) and display functional properties of immature neurons at various differentiation stages (Russo et al., 2004). Based on previous anatomical (Vigh and Vigh-Teichmann, 1998) and immunohistochemical (Stoeckel et al., 2003) studies, we speculated that the ependyma of neonatal rats shares common features with those of lower vertebrates and thus may contain cells with characteristics of immature neurons. To test this possibility we analyzed the expression of HuC/D in the spinal cord of neonatal rats (P0–P5). We found that HuC/D was robustly expressed in the gray matter of the spinal cord (data not shown). Figure 1 A shows a subpopulation of cells within the ependymal layer that also expressed HuC/D. In most cases, a single process could be seen projecting to the CC lumen (Figs. 1 A1, 2 A, arrowhead). Hu proteins are among the first markers expressed in newborn neurons (Marusich et al., 1994) but they are also present in mature neurons in which are thought to participate in some forms of plasticity (Deschênes-Furry et al., 2006). To test whether HuC/D+ cells close to the CC were either mature or immature neurons, we combined the use of the mature neuronal marker NeuN (Mullen et al., 1992; Kuhn and Peterson, 2008). We found that none of the HuC/D+ cells within the ependymal layer coexpressed NeuN (Fig. 1 A2), whereas all HuC/D+ cells outside this region did (Fig. 1 A2,3, arrowheads).
Figure 1.
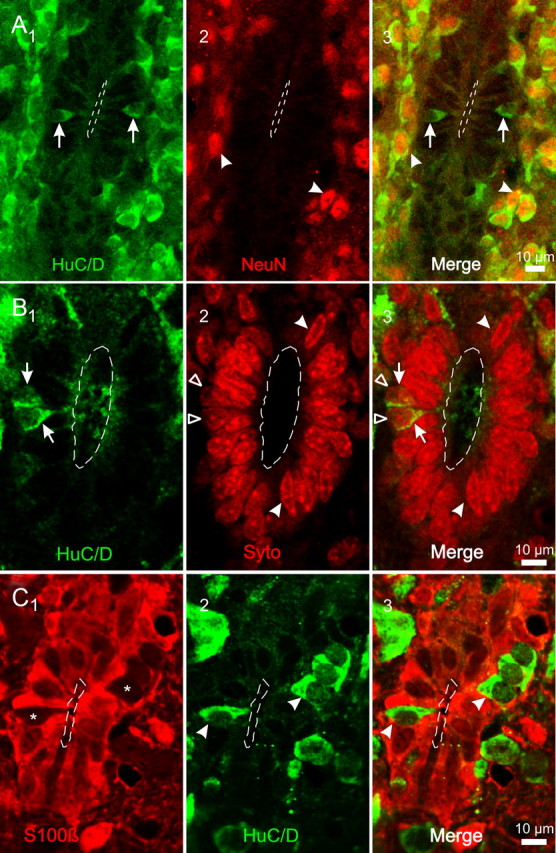
Immature neurons contacting the CC. A1–3, HuC/D+ cells (1, arrows) contacting the CC. No NeuN+ cells occurred within the ependymal layer (2). However, outside the ependyma all HuC/D+ cells had NeuN+ nuclei (3). The arrowheads in 2 and 3 point two HuC/D+ cells close to the ependymal layer with NeuN+ nuclei. B1–3, HuC/D+ cells (1, arrows) and Syto 64 labeled nuclei (2) in the ependyma of the rat. Notice that HuC/D + cells represent a minority of the cells within the ependymal layer (3) and that their nuclei (2, 3, open arrowheads) have a rounded shape that contrast with the elongated nuclei (2, 3, filled arrowheads) of most cells within the ependymal layer. C1–3, Most cells within the ependyma expressed the ependymal cell marker S100β (1). However, some S100β− cellular profiles (1, asterisks) within the ependymal layer expressed HuC/D (2–3, arrowheads). All images are single confocal optical planes. A, C, P2 rats; B, P5 rat.
Figure 2.

HuC/D+ cells express proteins of neuroblasts in neurogenic niches. A1–3, HuC/D+ in the CC (1, arrows) had an apical process contacting the CC lumen (1, arrowhead). DCX expression (2) matched almost completely that of HuC/D (2 and 3, arrows). However, some HuC/D+ cells did not express DCX (1–3, empty arrowheads) whereas few DCX+ cells did not show HuC/D immunoreactivity (1–3, empty arrow). Single optical plane. B1–3, HuC/D+ cells (1) also expressed PSA-NCAM, (2, 3). Note the characteristic punctate pattern of PSA-NCAM expression on the surface of the cell (arrowhead in 2). Z-stack projection. C1–3, The majority of DCX+ cells (1, arrow) also expressed PSA-NCAM (2 and 3). Notice the conspicuous apical processes reaching the CC lumen (arrowheads). Single confocal optical plane. A, B, P2 rat; C, P5 rat.
To analyze the relative frequency of HuC/D+ cells contacting the CC, we combined HuC/D immunohistochemistry with the nuclear stain Syto 64 (Fig. 1 B). From a total of 586 nuclei counted in 20 randomly chosen optical sections, only 56 corresponded to HuC/D+ cells (Fig. 1 B1, arrows). As shown in Figure 1 B, the nuclei of HuC/D+ cells (Fig. 1 B2, empty arrowhead) had a round shape and a light staining that contrasted with the elongated and darker nuclei of neighboring cells (Fig. 1 B2,3, arrowheads).
As stated by Peters et al. (1991a), the ependyma consists of a layer of epithelial cells that line the walls of the ventricles of the brain and the CC of the spinal cord. Because HuC/D+ cells contribute to line the CC through a narrow apical process, we asked whether they could be a specialized type of ependymal cell. To test this possibility, we combined the ependymal cell marker S100β (Chiasson et al., 1999; Spassky et al., 2005: Carlén et al., 2009) with HuC/D immunostaining. Most of the CC was lined by S100β+ ependymal cells (Fig. 1 C1; supplemental Fig. 1, available at www.jneurosci.org as supplemental material). However, HuC/D+ cells (Fig. 1 C2, arrowheads) did not coexpress the ependymal cell marker S100β (Fig. 1 C2,3, arrowheads) supporting the idea that—although within the ependymal layer—they are a distinct cell type different from ependymocytes.
The fact that some CC-contacting cells in the rat had a morphological and molecular phenotype of immature neurons raised the possibility that these cells may be similar to neuroblasts in neurogenic niches of the adult brain. We thus tested whether HuC/D+ cells also expressed DCX and PSA-NCAM, which are well known markers of immature neurons in neurogenic niches of the adult mammalian brain (Kuhn and Peterson, 2008). Double labeling experiments showed that most HuC/D+ cells also expressed DCX (104 of 105) (Fig. 2 A1–3, arrows) with only one HuC/D+ cell that expressed little or no reactivity against DCX (Fig. 2 A1–3, empty arrowhead). On the other hand, there were cells that expressed DCX but not HuC/D (7 of 111) (Fig. 2 A1–3, empty arrow). PSA-NCAM immunoreactivity with a characteristic punctate pattern on the surface of the membrane was also present in HuC/D+ cells (38 of 46) (Fig. 2 B1–3, arrowhead in 2). Finally, most DCX+ cells also expressed PSA-NCAM (61 of 67) (Fig. 2 C1–3, arrow). These results indicate that there was a slight heterogeneity within the population of cells that expressed markers of immature neurons.
We next analyzed the ultrastructure of HuC/D+ cells by performing preembedding immunoelectron microscopy. Figure 3 A shows a HuC/D+ cell within the ependymal layer (Fig. 3 A1, arrowhead) that was subsequently analyzed with TEM (Fig. 3 A2). The brown precipitate that allowed identifying the cell under light microscopy (Fig. 3 A1) appeared under TEM as an electron dense granular material in the perinuclear region (Fig. 3 A2, inset) that resulted from the reaction of the DAB-HRP complex with Os4. The nucleus of the HuC/D+ cell had a characteristic round profile (Fig. 3 A2, see N) with a light content that contrasted with the elongated shape and dark chromatic masses of the HuC/D− ependymal cells (Fig. 3 A2, see E). The occurrence of round nuclei with most of the chromatin in an extended form is one of the features considered as characteristic of neurons (Peters et al., 1991b). Because HuC/D are RNA-binding proteins (Deschênes-Furry et al., 2006), the DAB reaction was intense mainly around the nucleus, and thus, it was often difficult to unambiguously trace the apical process of HuC/D+ cells to the CC lumen. Since DCX immunohistochemistry labeled apical processes more robustly (see Fig. 2 C1), we made immunoelectron microscopy for DCX+ cells within the ependymal layer (Fig. 3 B1, arrowhead). In this case, the Os-DAB precipitate (Fig. 3 B2, lower inset) was present in the apical process contacting the CC lumen (Fig. 3 B2, upper inset). Note that similar to the HuC/D+ cell shown above, the nucleus of the DCX+ cell was round shaped and with light chromatin content. The morphological features provided by our immunoelectron microscopic images allowed us to identify presumptive neuronal-like cells in better preserved tissue, in which detergents were not used. As shown by Stoeckel et al. (2003) for P2X2-expressing CC-contacting cells, we found that some neuronal-like cells with a round nucleus (Fig. 3 C) bear a single cilium (Fig. 3 C, arrow in inset). The fine structural organization of the cytoplasm particularly rich in free ribosomes and processes lacking both longitudinally oriented microtubules and microfilaments also suggested an immature cell phenotype (Fig. 3 D1,2). In line with this, we found that neurofilament-M—a marker of mature neurons (Kuhn and Peterson, 2008)—was not expressed in CC-contacting cells but only in cells outside the ependyma (data not shown).
Figure 3.

Fine structure characteristics of immature neurons within the ependymal layer. A1, 2, Light microscope image of a HuC/D+ cell (1, arrowhead) resin-epoxy embedded. The same cell is shown under the electron microscope in 2. The osmium-DAB precipitates (2, inset) allowed to identify the limits of the cell which are outlined by a dotted line. Notice the round nucleus of the HuC/D+ cell which is lighter than the elongated nuclei of neighboring ependymal cells (2, E). B1, 2, Light microscope image of a DCX+ cell in the ependymal layer (1, arrowhead). Conspicuous osmium-DAB precipitates allowed the identification of the DCX+ cell at the TEM level (2, lower left inset). As for HuC/D+ cells, the nucleus of the DCX+ cell had a round appearance (2, N) compared with neighboring nuclei (2, E). The apical process was easily identified and contacted the CC lumen (2, upper left inset; shadowed). C, Low power electronmicrograph of a putative immature neuron (N) in better preserved tissue that was not exposed to detergents. Note the round shaped nucleus that contrasts with the elongated nuclei of adjacent cells (E). An apical process reaches the CC lumen. The inset shows a tangential view of a cilium (arrow) surrounded by a crown of slender microvilli. D1, 2, Another putative immature CC-contacting neuron with an electron dense cytoplasm containing abundant free ribosomes. Notice the process arising from the basal pole (1, asterisk). This poorly differentiated process (2, shaded in light blue) showed no evidences of either neurotubes or neurofilaments. A, B, P4 rat; C, P2 rat; D, P4 rat.
Immature neurons around the CC: functional clues
Athough the immunohistochemical data shown above suggested that some CC-contacting cells were similar to neuroblasts, the expression of DCX and PSA-NCAM does not by itself prove their neuronal nature, because these markers have been occasionally reported in glial progenitors and glial cells (Kuhn and Peterson, 2008). In addition, the early neuronal marker HuC/D and DCX are also expressed in a subset of neuronal progenitors in the embryonic spinal cord (Marusich et al., 1994) and cerebral cortex (Miyata et al., 2004; Noctor et al., 2008). We therefore made patch-clamp recordings to analyze the electrophysiological properties of CC-contacting cells under the assumption that functional clues have been very useful to clarify the nature of cells in potential neurogenic niches (van Praag et al., 2002; Bischofberger and Schinder, 2008). As shown in Figure 4, some cells (n = 34) had an electrophysiological phenotype characterized by relatively low input resistances (185.4 ± 40.5 MΩ, n = 34), hyperpolarized resting membrane potentials (−82.1 ± 2.2, n = 34), and passive responses to depolarizing current pulses (Fig. 4 A1) with linear voltage-current relationships (Fig. 4 A2). The injection of Alexa 488 revealed a cluster of dye-coupled ependymocytes that lined a substantial portion of the CC (Fig. 4 A3). Other cells, however, had active response properties when depolarized from rest. This cell type had a high input resistance (5.63 ± 0.87 GΩ, n = 19) and responded with a slow potential when the membrane was depolarized beyond a certain threshold (Fig. 4 B1). As shown in Figure 4 B1, many of these cells (15 of 19) showed spontaneous barrages of synaptic potentials (arrows). The plateau-like potential could be generated in an all-or-none manner by a short-lasting current pulse, outlasting the stimulation by hundreds of milliseconds (Fig. 4 B2). Notice that the slow potential could also be triggered by a spontaneous barrage of synaptic potentials (Fig. 4 B3, arrows). The cell recorded in Fig. 4 B had a round cell body connected to the CC lumen by a single short process (Fig. 4 B4, arrow). The slow regenerative potential remained in the presence of TTX (1 μm) but was blocked by 3 mm Mn2+ and was thus mediated by a Ca2+ conductance (Fig. 4 C1,2). However, in this cell a small early component (Fig. 4 C1, arrow) was blocked by TTX, suggesting a minor contribution of voltage-gated Na+ channels to the earliest part of the response. We also observed a small and slow spike as a rebound response to a transient hyperpolarization (Fig. 4 D1). The rebound response had a threshold of ∼−50 mV and thus resembled the low threshold spike (LTS) mediated by T-type Ca2+ channels. Indeed, the addition of low concentrations of Ni2+ (300 μm, n = 3) that block T-type but not L-type Ca2+ channels (Russo and Hounsgaard, 1996) abolished the LTS (Fig. 4 D2).
Figure 4.
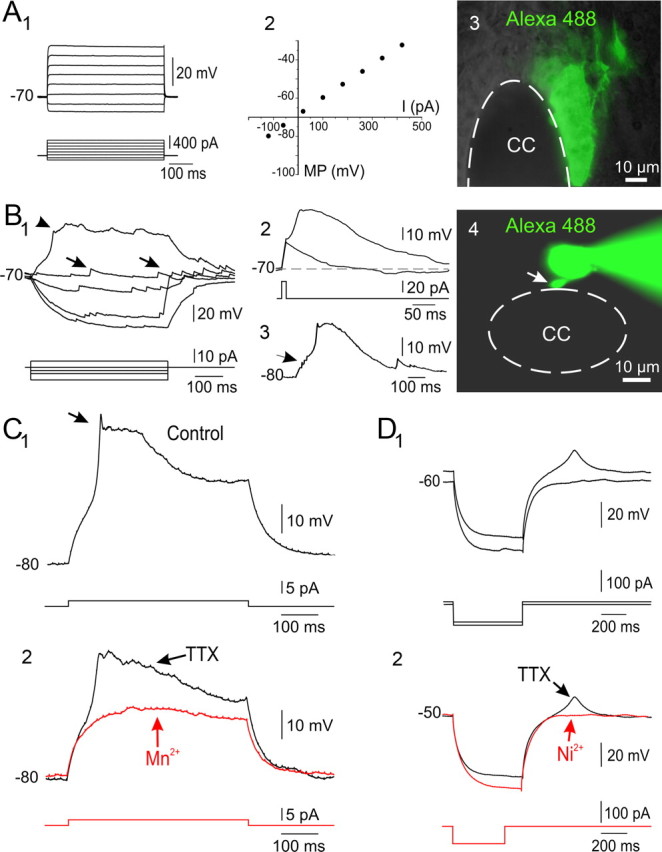
Functional phenotypes of CC-contacting cells: passive responses versus Ca2+ electrogenesis. A1–3, Responses of a CC-contacting cell to a series of current steps (1). Current-voltage (C/V, 2) relationship of the cell shown in 1. Notice the passive responses to depolarizing current pulses and the linear behavior in the C/V plot. The excitation of Alexa 488 revealed that the cell recorded in 1 appeared dye coupled with neighboring cells (3). Conventional epifluorescence and DIC in a living slice. B1–4, Active response properties in a CC-contacting cell. A depolarizing current pulse produced a slow potential (1, arrowhead). Notice the presence of spontaneous synaptic activity (1, arrows). The slow potential could be generated in an all-or-non manner by a short-lasting current pulse (2) or by a barrage of spontaneous synaptic potentials (3, arrow). As revealed by injection of Alexa 488, the cell recorded in 2 had a single short process contacting the CC (4, arrow; conventional epifluorescence). C1, 2, Slow depolarizing potential in a CC-contacting cell (1). A small and brief transient appeared at the beginning of the active response (1, arrow). The slow response was not sensitive to 1 μm TTX but the brief transient disappeared, indicating a small contribution of Na+ channels (2). Addition of 3 mm Mn2+ completely blocked the slow depolarizing potential (2), indicating the involvement of Ca2+ channels. D1, 2, Slow spike in response to a transient hyperpolarization (1). The slow response had a threshold close to –50 mV. The low threshold response was not blocked by TTX (1 μm) but was abolished by 300 μm Ni2+ (2). A, P3 rat; B, P2 rat; C, P4 rat; D, P1 rat.
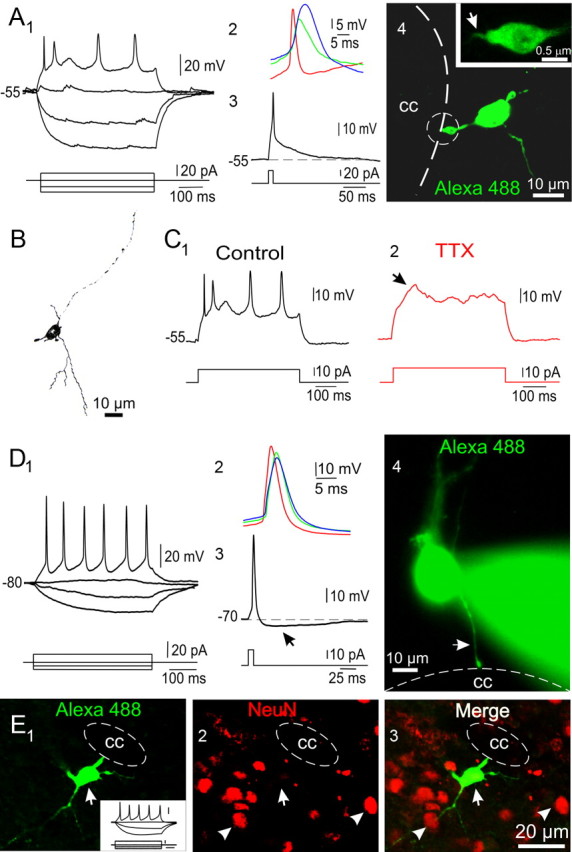
A second class of cells with active properties (n = 94) had the ability to generate a single fast spike often followed by nonregenerative membrane potential oscillations in response to a sustained depolarization (Fig. 5 A1, B1). This cell type had resting potentials of ∼−60 mV (−61.4 ± 1.49 mV, n = 85) and a mean input resistance of 3.95 ± 0.29 GΩ (n = 85) that was significantly smaller than that of cells with slow depolarizing potentials (p < 0.05). The single full spike had an amplitude of ∼38 mV (38.27 ± 1.52 mV, n = 77) and a half-amplitude duration of ∼6 ms (6.21 ± 0.55 ms, n = 77). In some cases (49 of 94 cells), a short lasting depolarizing current pulse evoked a single spike followed by a slow depolarizing potential similar to that of the nonspiking cell already described (Figs. 4 B3, 5 A2), whereas in the rest of cells the spike had a fast repolarizing phase (Fig. 5 B2). Notice, however, that these spikes had no slow after-hyperpolarization (sAHP) as typically observed in spinal neurons (Russo and Hounsgaard, 1999). In most cells, the application of the same depolarizing current from increasing levels of hyperpolarizing bias current produced a delayed depolarization that blocked the generation of an action potential (Fig. 5 C), suggesting the presence of an A-type K+ current (IA). As expected, the fast spike was blocked by 1 μm TTX (Fig. 5 D). The morphology of single spiking cells was similar to that shown by the immunohistochemistry for immature neuronal markers, with a cell body connected to the CC lumen by a single process (Fig. 5 A3). Intracellular injection of biocytin allowed the discrimination of finer morphological details than those revealed by immunohistochemistry. Overall, the intracellular staining of CC-contacting cells with active membrane properties revealed pleomorphic morphologies (see below and supplemental Fig. 2, available at www.jneurosci.org as supplemental material). For example, some single spiking cells had neurites that originated from the cell body and projected away from the CC (Fig. 5 A3). In other cases, these cells had a simpler morphology with a small cell body close the CC lumen and short thin processes (Fig. 5 B3). To confirm that single spiking cells belonged to the group of cells expressing immature neuronal markers, we combined the histochemical reaction to intracellularly injected biocytin with immunohistochemistry against HuC/D. Figure 5 E shows a single spiking CC-contacting cell (Fig. 5 E1) that expressed HuC/D (Fig. 5 E2,3).
Figure 5.

Single spiking CC-contacting cells. A1–3, Response of a cell in the ependyma to a series of current pulses. A 500 ms depolarizing current pulse applied at the resting membrane potential produced a small single fast spike followed by damped oscillations of the membrane potential (1). In this cell, a brief depolarizing current pulse applied at hyperpolarized membrane potentials produced a fast single spike followed by a slow depolarizing potential (2). Confocal image of the cell shown in 1 and 2 (3). Notice the cell body connected to the CC by a single process and several short neurites arising from the basal pole. B1–3, Single spiking cell (1) with an action potential that had a repolarizing phase without depolarizing afterpotential (2). This cell had a small cell body that contacted directly the CC lumen and very short processes (3). C, Response to the same depolarizing current pulse applied at two levels of hyperpolarizing bias current. The delayed depolarization when the cell was stimulated from hyperpolarizing potentials resulted in the blockade of action potential generation (red). D1, 2, The action potential (1) was blocked by 1 μm TTX (2). E1–3, A biocytin-filled single spiking cell (1) expressed HuC/D (2, 3). All images are Z-stack projections. A, P2 rat; B, P1 rat; C, P4 rat; D, P1 rat; E, P3 rat.
Finally, we found cells attached to the CC that were able to fire Na+ action potentials repetitively (Fig. 6 A1,D1) (n = 52). These cells had a resting potential of ∼−70 mV (−71.11 ± 2 mV, n = 42) and a mean input resistance of 4.25 ± 0.3 GΩ (n = 46) that was not statistically different from that of single spiking cells. However, the spike amplitude (56.38 ± 2.1 mV, n = 46) and half-amplitude duration (3.77 ± 0.35 ms, n = 44) were significantly larger and briefer than those in single spiking cells (p < 0.05). In this group of cells the action potential waveform varied substantially and seemed correlated with the ability to fire repetitively (Fig. 6 A3,D3). Some cells were able to fire repetitively but the half-amplitude duration during the spike train increased considerably (Fig. 6 A1,2). Other cells had a more robust repetitive spiking, with little spike amplitude attenuation and broadening during the train (Fig. 6 D1,2). The action potential in cells with robust repetitive spiking had a well developed sAHP (Fig. 6 D3, arrow). These findings suggest that the ability for repetitive spiking depends on action potential maturation. As expected, the spikes of repetitive spiking cells were blocked by 1 μm TTX (Fig. 6 C1,2). Only in a minority of cells (19 of 52) a slow TTX-resistant depolarizing potential could still be observed (Fig. 6 C2, arrow) suggesting that as the ability to fire repetitively develops, the prevalence of Ca2+ electrogenesis diminishes.
Figure 6.
Repetitive spiking CC-contacting cells. A1–4, Responses to a series of current pulses of a cell that fired repetitively (1). Notice the occurrence of spontaneous synaptic events. The first (red), second (green) and third (blue) action potentials during the spike train are shown superimposed in 2. Notice the increase in threshold and half-amplitude duration during the spike train. The action potential produced by a brief current pulse lacks a slow after-hyperpolarization (3). Confocal Z-stack projection (4) of the cell recorded in 1. The single process attached to the CC had an endfoot (4, encircled) with a single thin cilium-like process (4, arrow in inset). B, Camera lucida drawing of the cell recorded in A. Notice the presence of long (>30 μm) branching neurites arising from the cell body. C1, 2, The fast action potentials (1) in repetitive spiking cells were blocked by TTX (1 μm, 2). However, a slow depolarizing potential remained in the presence of TTX (2, arrow). D1–4, CC-contacting cell with a more robust repetitive spiking (1) than that shown in A. The first (red), second (green) and third (blue) action potentials are shown superimposed in 2. Notice the minor changes in spike amplitude, duration and threshold. The action potential in this cell had a well developed sAHP (3, arrow). The image in 4 (conventional epifluorescence) shows that this cell was still connected to the CC via a thin single process (arrow), whereas a conspicuous branching neurite originated from the basal pole. E1–3, A biocytin-filled cell (1, arrow) with a repetitive spiking phenotype (1, inset; calibration: 20 mV, 10 pA and 100 ms) connected to the CC by a single process and with well developed neurites. Immunocytochemistry for NeuN showed several reactive nuclei (2, arrowheads). The merged images (3) show that the recorded cell did not express NeuN (2, 3, arrow). Confocal optical plane. A–C, P3 rats; D, P5 rat; E, P2 rat.
All electrophysiological phenotypes were found at ages between P0 and P5 (supplemental Fig. 3, available at www.jneurosci.org as supplemental material). A χ2 test at p < 0.05 revealed that there was no relationship between the particular functional phenotype and the age of rats within the analyzed temporal window (P0–P5).
Although repetitive spiking cells had similar morphological features as those of single spiking cells, they had more developed neurites (Fig. 6 A4,B,D4,E1). Repetitive spiking cells frequently had several processes arising from the cell body that could be followed projecting into the surrounding gray matter for >30 μm (Fig. 6 B, camera lucida drawing, D4,E1). Nevertheless, a single process attached to the CC lumen by a wide endfoot could still be identified in repetitive spiking cells (Fig. 6 A4,D4, arrow, E1). In some cells, a closer examination of the CC-contacting endfoot showed a single thin process protruding into the CSF (Fig. 6 A4, arrow in inset). It is likely that the thin process corresponded to a single cilium, because spiking cells expressed the satellite centriolar protein PCM-1 in the apical process close to the CC lumen (supplemental Fig. 4, available at www.jneurosci.org as supplemental material). Despite the more mature firing pattern, repetitive spiking cells in contact with the CC did not express NeuN (Fig. 6 E1–3).
Ionic mechanisms underlying the excitability of spiking CC-contacting cells
Our current clamp data suggest that single and repetitive spiking cells are distinct cell phenotypes, probably reflecting different stages of differentiation. To explore the ionic basis of the excitability in these two types of cells, we studied the underlying currents in voltage-clamp mode focusing on Na+ and K+ voltage-gated conductances. Both in single (Fig. 7 A1) and repetitive spiking (Fig. 7 A2) cells, depolarizing voltage steps produced a brief TTX sensitive inward current followed by outward currents. The Na+ current (I Na) density for membrane potentials more depolarized than −40 mV was significantly smaller in single spiking cells (Fig. 7 B) (p < 0.05, n = 7 cells).
Figure 7.

Na+ current (INa) in single and repetitive spiking cells. A, Leak subtracted currents in single (1) and repetitive (2) spiking cells in response to depolarizing voltage steps applied from a holding potential of −70 mV. As expected the inward currents were blocked by 1 μm TTX (traces in upper right corner). B, Peak INa density at different membrane potentials in single (red) and repetitive (black) spiking cells. A 1, P3 rat; A 2, P5 rat; B, P1–P5 rats.
Outward currents were analyzed using different voltage clamp protocols. In single spiking cells, depolarizing voltage steps from a holding potential of – 90 mV evoked currents that seemed to have non-inactivating and inactivating components (Fig. 8 A1). To separate these two components we applied the same family of voltage steps but from a holding potential of −30 mV (Fig. 8 A2). Under these conditions, we observed an outward current with a slower onset and no inactivation during the 100 ms voltage step, thus suggesting the involvement of delayed rectifier K+ (I KD) channels. By subtracting the delayed non-inactivating current (Fig. 8 A2) from the total current (Fig. 8 A1), we were able to separate an outward current with a fast onset and prominent time dependent inactivation (Fig. 8 A3). A steady state inactivation protocol showed a strong voltage dependence of the inactivation, a typical feature of I A (Fig. 8 B) (Connor and Stevens, 1971). The same voltage clamp protocols in repetitive spiking cells gave similar results (Fig. 8 C,D). In both types of cells, TEA (10 mm) blocked the non-inactivating component of the outward current mediated by the delayed rectifier (I KD) (Fig. 8 E1,2) but spared the inactivating current which was blocked by 4-AP (2 mm) (Fig. 8 E3), a selective blocker of A-type K+ channels. Single and repetitive spiking cells differed in their I A, being the time course of inactivation the most striking difference. The inactivation processes were significantly different (p < 0.01, n = 10) and could be fitted to a single exponential function with a time constant (τ) of 28.76 ± 2.3 ms (n = 10) for single spiking cells (Fig. 8 F1) and 12.7 ± 1.3 ms (n = 10) for repetitive spiking cells (Fig. 8 F2). The peak I A density was also significantly larger in single spiking cells (Fig. 8 G) (p < 0.05, n = 6). However, the inactivation curves were similar with a V h for inactivation of −66.96 ± 1.52 mV and −65.7 ± 1.95 mV for single and repetitive spiking cells, respectively (Fig. 8 H) (n = 6). The V h for the activation process were 21.45 ± 1.3 mV and 26.67 ± 0.66 mV for single and repetitive spiking cells (Fig. 8 H) (n = 6). The peak I KD density (Fig. 8 I) and the activation curves (Fig. 8 J) for I KD in single (V h = 8.44 ± 0.86 mV, n = 6) and repetitive (V h = 19.46 ± 1.74, n = 6) spiking cells were similar.
Figure 8.

K+ currents in single and repetitive spiking cells. A1–3, Outward currents evoked in a single spiking cell during 100 ms depolarizing voltage steps after a 75 ms prepulse to −90 mV (1). The currents evoked with the same protocol as in 1 but after a prepulse to −30 mV have a slow onset with no inactivation (2), suggesting a delayed rectifier (I KD). The difference between the currents obtained with the protocols in 1 and 2 revealed a current with fast onset and strong time dependent inactivation (3) typical of A-type currents (I A). B, Steady state inactivation protocol shows the voltage dependence of I A inactivation. C, D, Same protocols as in A and B, but in a repetitive spiking cell. E1–3, Pharmacological separation of outward currents. TEA (10 mm) blocked the sustained component of the total outward current (1, 2), whereas 2 mm 4-AP blocked the transient K+ current (3). F1, 2, Time course of I A inactivation for single (1) and repetitive (2) spiking cells. The currents were obtained at +30 mV after a prepulse to −100 mV. The inactivation process was fitted to a single exponential function. G, Peak I A density as a function of the membrane potential for single (red, SS) and repetitive (black, RS) spiking cells. H, Activation and inactivation curves for I A in single (red, SS) and repetitive (blue, RS) spiking cells. I, Peak IKD density as a function of the membrane potential for single (red, SS) and repetitive (black, RS) spiking cells. J, Activation curves for I KD in single (red, SS) and repetitive (blue, RS) spiking cells. A, B, P4 rat; C, D, P1 rat; E, P3 rat; F, P1–P5 rats; G–J, data pooled from P1 to P3 rats for SS, and P2 and P3 rats for RS.
GABAergic signaling
GABA plays an important part during development by providing an excitatory input critical for neuronal maturation (Owens and Kriegstein, 2002). We reasoned that if CC-contacting cells were immature neurons in different stages of differentiation, GABAergic signaling should be present and may have a variety of effects. In conventional whole-cell recordings, pressure application of GABA produced a current in all cases (4 of 4) that reversed close to the expected Cl− equilibrium potential (E Cl) imposed by the pipette solution (Fig. 9 A1,2). As expected, GABAA receptors mediated the GABA-induced current because gabazine (10 μm)—a selective GABAA receptor antagonist—blocked the response (Fig. 9 A3) (3 of 3). To explore the actual effect of GABA on CC-contacting cells, we used the gramicidin-perforated patch-clamp technique. Gramicidin generates cation-selective pores in the membrane (Myers and Haydon, 1972; Kyrozis and Reichling, 1995) and therefore does not modify the normal intracellular Cl− concentration ([Cl−]i). In some cells (6 of 12) recorded with the gramicidin-perforated patch technique, GABA had an inhibitory action by eliciting a hyperpolarization from rest (Fig. 9 B1) generated by an outward current (Fig. 9 B2). The GABA-induced current in these cells reversed between −60 to −80 mV (−67.78 ± 3.32, n = 6) (Fig. 9 B2,3). As shown for the experiment illustrated in Figure 9 B, to confirm that the recordings were done in the perforated patch mode, we excited the fluorophore contained in the pipette and observed no diffusion into the cell (Fig. 9 B4, upper image). After rupturing the membrane by applying extra suction, the dye filled the cell within minutes and we could confirm that the recorded cell contacted the CC (Fig. 9 B4, arrow in lower image) and had conspicuous neurites (Fig. 9 B4, arrowhead in lower image). In other cells (6 of 12), GABA produced depolarizing responses from rest (Fig. 9 C1) that could even evoke spike firing (Fig. 9 D1) (2 of 6). The reversal potentials for the GABA-induced current in this group of cells varied from −43 to −55 mV (−46.7 ± 1.9, n = 6) (Fig. 9 C2,D2). Gabazine (10 μm) also blocked the GABA-induced responses recorded with the perforated patch-clamp technique (3 of 3, data not shown). The various reversal potentials for GABA-induced currents revealed different [Cl−]i in CC-contacting neurons, probably because of different levels of the Na+-K+-2Cl− cotransporter NKCC1 as typically found in developing neuroblasts (Tozuka et al., 2005).
Figure 9.

GABA-induced responses in CC-contacting immature neurons. A1–3, Responses of a CC-contacting cell to puff application (10 ms) of GABA (100 μm) at different membrane potentials (1). In conventional whole-cell recordings the GABA-induced current reversed at the expected Cl− equilibrium potential imposed by the internal solution (2). GABAA receptors mediated the GABA-induced current because gabazine (10 μm) blocked the response (3). B, D: GABA-induced responses recorded with the gramicidin perforated-patch technique. B1–4, In some cells, GABA application in current-clamp mode induced a strong hyperpolarizing response from rest (1). The GABA-induced currents (2) of this cell reversed at −62 mV (3). The images in 4 show the recording conditions in perforated patch mode and after rupturing the patch. Confirmation of perforated patch is evidenced by the lack of diffusion of Alexa 488 into the cell (upper image). After completion of the experiment, the membrane was ruptured and the dye diffused rapidly into the cell (lower image). Notice the apical process in contact with the CC lumen (4, arrow) and the well developed neurite arising from the cell body (4, arrowhead). Conventional epifluorescence. C1, 2, Depolarizing response induced by GABA application (1). The GABA-induced current in this CC-contacting cell reversed at −45 mV (2). D1, 2, Strong GABA-induced depolarization provoked spike firing in a single spiking CC-contacting cell (1). The inset shows the initial depolarization that generated the action potential. The GABA-induced current in this cell reversed at – 43 mV (2). A, P5 rat; B, P1 rat; C, P2 rat; D, P5 rat.
Together, our findings support the idea that some cells lining the CC of neonatal rats are immature neurons at different stages of maturation. It is possible that as the animal develops, these cells acquire the molecular and functional phenotypes of mature neurons. To explore this possibility, we made patch-clamp recordings in rats between P15–P18, because during the first two postnatal weeks, there is a fast maturation of the properties of spinal neurons and the rats acquire an adult pattern of locomotion (Vinay et al., 2000). We found that CC-contacting cells in these juvenile animals still displayed electrophysiological phenotypes of immature cells that fired a single spike (n = 4) (Fig. 10 A1–3; compare with Fig. 5 A1,2) or fired repetitively (n = 3, data not shown). In line with these results, the ependyma of adult rats remained devoid of NeuN+ cells (Fig. 10 B), whereas as described by Stoeckel et al. (2003), PSA-NCAM cells were still abundant (Fig. 10 C). These findings suggest that even beyond the early postnatal period these CC-contacting cells keep functional and molecular traits of immature neurons.
Figure 10.

CC-contacting immature neurons in older rats. A1–3, Response properties of a CC-contacting cell in a P17 rat (1). Notice the generation of a single spike in response to a long lasting depolarization. A brief depolarizing current pulse applied from hyperpolarized membrane potential evoked a small, brief spike followed by a slow depolarizing potential (2). Intracellular injection of Alexa 488 showed a morphology similar to that observed in neonatal animals with a single process contacting the CC (3, arrow). Confocal Z-stack projection. B, Immunocytochemistry for NeuN shows many positive cells in a P21 rat. However, even at this age the ependyma was devoid of NeuN+ nuclei. C, PSA-NCAM+ cells appeared in a P40 rat. B, C, Confocal single optical planes.
Acid and ATP mediated responses
Previous studies have shown that a subset of CC-contacting cells express the ATP activated P2X2 receptor (Stoeckel et al., 2003) and the polycystic-kidney-disease-like ion channel PKD2L1 (Huang et al., 2006), that belong to the set of channels implicated in sensing changes in pH. We reasoned that if CC-contacting immature neurons are sensory cells specialized for detecting changes in H+ concentration, they should respond selectively to changes of pH with respect to other spinal neurons. A brief puff (100–300 ms) of Ringer's solution buffered at pH 6 onto CC-contacting neurons produced a strong excitation (Fig. 11 A1,2,4) generated by an inward current that lasted ∼3 s (Fig. 11 A3). Spinal neurons in the ventral or dorsal horn with a mature spike firing pattern (Fig. 11 B1,4) also responded strongly to similar changes in pH (Fig. 11 B2,3). As expected, CC-contacting cells also responded to the application of ATP (100 μm) with a strong excitation (Fig. 11 C1,2) generated by a conspicuous inward current at resting potential (Fig. 11 C3). The I/V relationship of the ATP-induced current showed a strong rectification with very little current flowing at depolarized potentials (Fig. 11 C3,4), a typical behavior of currents mediated through P2X2 receptors (North, 2002).
Figure 11.

Acid and ATP mediated responses in CC-contacting immature neurons. A1–4, Single spike evoked in a CC-contacting cell by a 500 ms depolarizing current pulse (1). The cell was strongly excited by a brief application of a Ringer's solution buffered at pH 6 (2). Currents induced by different puff durations in the same cell (3). Notice that even a 100 ms puff induced almost maximal currents (3, red trace). Increasing the duration to 200 ms slightly increased the peak current and prolonged the response (3, green trace). Further increases in puff duration did not change acid induced currents (blue trace). Injection of Alexa 488 confirmed the cell contacted the CC (4). B1–4, Repetitive spiking of a cell in the ventral horn in response to a depolarizing current pulse (1). A brief puff of an acidic Ringer's solution produced a strong excitation, with robust repetitive spike firing (2). The acid-induced currents were maximally activated even by a 100 ms puff (3). The image in 4 shows the morphology and the location (inset) of the ventral horn neuron. C1–4, Repetitive spiking CC-contacting cell (1, inset, calibration: 20 mV, 10 pA and 100 ms) was strongly excited by brief application of ATP (100 μm, 2). The ATP-induced inward current showed a strong rectification, becoming almost undetectable at a holding membrane potential of −20 mV (3, 4). A, P2 rat; B, P4 rat; C, P3 rat. All images are from conventional epifluorescence.
Birth date of CC-contacting neurons
In neurogenic niches of the adult brain, proliferating neurogenic precursors transiently express DCX (Brown et al., 2003). We therefore asked whether immature neurons in the ependyma of neonatal rats could be generated postnatally. To address this question, we injected BrdU daily (100 mg/kg) between P0 and P5 (n = 9) and let the animals survive for 1 d (n = 2), 10 d (n = 4), and 17 d (n = 3) (Fig. 12 A). We then combined BrdU labeling with immunohistochemistry for HuC/D at each time point. Although we found several BrdU+ nuclei around the CC (Fig. 12 B, arrowhead), we did not find colocalization of BrdU and HuC/D staining in the same cell (Fig. 12 B, arrow). Because a slow cell cycle with a short S phase may lower the probability that potential neurogenic precursors uptake BrdU, we combined immunohistochemistry for PCNA—an endogenous cell cycle protein expressed in all phases of the cell cycle of proliferating cells—and DCX. Similar to the data obtained with BrdU, we found many cells that expressed PCNA (Fig. 12 C, arrow) in the ependyma of neonatal rats but none colocalized with DCX (Fig. 12 C, arrowhead). We then applied BrdU (100 mg/kg, i.p.) to pregnant rats between E7–E17 (n = 4) and killed the newborn rats between P0 and P5 (Fig. 12 D). This protocol revealed many cells in the ependyma that colocalized HuC/D and BrdU (Fig. 12 E, arrow). Although it is still possible that HuC/D+ or DCX+ cells are quiescent precursors, the fact that they do not express PCNA together with their ability to fire action potentials favors a postmitotic fate. Therefore, the most parsimonious interpretation of our birthdating experiments is that CC-contacting neurons are born in the embryo but retain molecular traits of immature neurons after birth. The diversity of electrophysiological phenotypes raises the possibility that these immature neurons go into standby mode at different stages of functional maturation.
Figure 12.

Birth date of CC-contacting neurons. A, BrdU protocol to test the generation of CC-contacting neuroblasts in the early postnatal life. B, Double-labeling for HuC/D and BrdU at P15. Although many ependymal cells proliferated in neonatal rats (arrowhead) none of them colocalized the early neuronal marker HuC/D (arrow). Confocal Z-stack projection. C, Some ependymal cells were positive for the cell cycle marker PCNA (arrow) but they did not colocalize with DCX (arrowhead). Single confocal optical plane. D, BrdU protocol to test the generation of CC-contacting neuroblasts in the embryo. E, In newborn rats injected between E7–E17 and killed at P0–P5 some HuC/D+ cells showed BrdU+ nuclei (arrow in main panel and orthogonal images). Confocal Z-stack projection. C, E, P2 rat.
Discussion
We show here that some CC-contacting cells in the rat display molecular and functional properties of immature neurons similar to those of adult neurogenic niches (Lledo et al., 2006). Their electrophysiological phenotypes suggest diverse stages of differentiation similar to those of spinal neurons in Xenopus embryos (Spitzer et al., 2000). Although CC-contacting neuroblasts were generated in the embryo, the expression of DCX and PSA-NCAM suggests they remain highly plastic (Bonfanti, 2006).
Immature neurons in the ependyma: reminiscences of a neurogenic niche?
In turtles, some CC-contacting cells have the molecular and electrophysiological phenotypes of neuroblasts (Russo et al., 2004) immersed in a niche of neurogenic precursors (Russo et al., 2008). Similarly, a subpopulation of CC-contacting cells in the rat expressed the early neuronal marker HuC/D but not the mature marker NeuN, suggesting they are immature neurons similar to those in spinal neurogenic niches of low vertebrates. Our findings are in line with previous studies showing that some CC-contacting cells in adult rats expressed PSA-NCAM and may therefore be neuronal progenitors (Alonso, 1999). Indeed, most HuC/D+ cells also expressed PSA-NCAM and DCX, which are transiently expressed in neuroblasts within neurogenic niches of the embryo and the adult brain (Seki, 2002; Brown et al., 2003).
Although non-neuronal cell types occasionally express HuC/D, DCX, and PSA-NCAM (Kuhn and Peterson, 2008), our patch-clamp recordings demonstrated that CC-contacting cells belonged to the neuronal lineage. Ependymocytes expressed S100β, had glial-like properties such as a low input resistance, passive responses, high resting membrane potentials, and extensive gap junction coupling (Bruni, 1998). In contrast, HuC/D+ cells were uncoupled, had high input resistances, and displayed regenerative responses suggesting they belong to the neuronal lineage and—although still contacting the CC—are different from ependymal cells.
Immature CC-contacting neurons: learning to spike?
The various electrophysiological phenotypes described in this study suggest different stages of maturation resembling the developmental sequence of developing spinal neurons in Xenopus (Spitzer et al., 2002). Indeed, CC-contacting cells dominated by Ca2+ electrogenesis strikingly resembled the earliest steps of differentiation of Xenopus spinal neurons that generate long lasting Ca2+ action potentials (Spitzer and Lamborghini, 1976). Ca2+ electrogenesis is critical for the differentiation of various neuronal features such as the expression of voltage-gated channels, neurotransmitter specification, and the growth of neurites (Spitzer et al., 2004). Interestingly, an LTS similar to that described here plays an important role in early differentiation during adult neurogenesis by amplifying small depolarizations (Schmidt-Hieber et al., 2004).
As spinal neurons in Xenopus embryos differentiate, they shift from slow Ca2+ potentials to fast Na+ action potentials (Spitzer and Lamborghini, 1976). This may be the differentiation stage of single spiking cells in the CC. At more advanced stages of maturation the ability to fire repetitively would appear. In addition to a larger and briefer action potential, repetitive spiking cells had an sAHP that single spiking cells lacked. In developing spinal neurones (Spitzer et al., 2000), repetitive firing is caused by the development of Ca2+-dependent K+ channels that generate the sAHP needed to remove Na+ channel inactivation (Russo and Hounsgaard, 1999).
The maturation of spike firing is implemented via the regulation of functional voltage-gated channels in the plasma membrane (Spitzer and Ribera, 1998). CC-contacting cells firing repetitively had a higher I Na density compared with single spiking cells. This agrees with the hypothesis that single and repetitive spiking cells represent a sequence of maturational stages because an increase in Na+ channel density is a common strategy during the maturation of the excitability in the embryo (Gao and Ziskind-Conhaim, 1998) and adult neurogenic niches (Carleton et al., 2003).
The appearance of potassium conductances in spinal neurons is important for maturation of the action potential and repetitive firing (Gao and Ziskind-Conhaim, 1998; Russo and Hounsgaard, 1999). CC-contacting neuroblasts had both a delayed rectifier and an I A. The delayed rectifier had similar properties in single and repetitive spiking cells, in line with an early development of the delayed rectifier during differentiation (Spitzer and Ribera, 1998). In contrast, single spiking cells had a higher density of an I A with slower inactivation kinetics that activated at subthreshold potentials thus regulating spike generation. The slower kinetics of I A inactivation in single spiking cells implies a wider time window for the control of excitability. This may be an efficient way to regulate the timing of Ca2+ influx, an event that plays a key role during differentiation (Spitzer et al., 2004). Faster I A inactivation kinetics in repetitive spiking cells may be related to the maturation of the action potential waveform which is determinant for repetitive firing (Connor and Stevens, 1971). Interestingly, in the subventricular zone newborn neurons first express a delayed rectifier in the rostral migratory stream to add an I A when they reach the olfactory bulb (Belluzzi et al., 2003). In a final step of maturation, newborn olfactory neurons acquire outward currents with a faster inactivation time course (Belluzzi et al., 2003). Therefore, the maturation of K+ currents in CC-contacting immature neurons may follow the same developmental plan as newborn neurons in adult neurogenic niches.
GABAergic signaling in the CC
CC-contacting immature neurons had functional GABAA receptors. GABAergic signaling plays an important part in neuronal differentiation (Owens and Kriegstein, 2002). In developing neurons, GABA provides an excitatory drive because of a depolarized ECl (∼−30–50 mV) generated by the Na+-K+-2Cl− cotransporter NKCC1 (Ge et al., 2006). As neurons mature, they express the K+-Cl− cotransporter KCC2 which lowers [Cl−]i shifting the GABA effect from excitation to inhibition (Owens and Kriegstein, 2002). Our gramicidin-perforated patch-clamp recordings showed that GABA had effects that ranged from robust excitation to inhibition, supporting the hypothesis that CC-contacting neurons are in different maturational stages. Many CC-contacting cells had E Cl more depolarized (∼46 mV) than resting potentials. GABA-induced depolarizations may be sufficient to increase intracellular Ca2+ by activation of voltage-gated Ca2+ channels (Yuste and Katz, 1991; Owens et al., 1996). CC-contacting neurons with a more immature functional phenotype had a robust Ca2+ electrogenesis which may efficiently couple with GABA signaling to promote neuronal maturation (Owens and Kriegstein, 2002). Interestingly, in immature cortical neurons the Ca2+ increase induced by GABA is mediated by Ni2+-sensitive Ca2+ channels (Fukuda et al., 1998), similar to those that generated the LTS in the CC.
The intriguing nature of CC-contacting neurons
The similarities of CC-contacting neurons with those of neurogenic niches raised the possibility that they may be generated postnatally. Shechter et al. (2007) reported the generation of new DCX+ cells in the spinal cord of the rat. However, in agreement with previous studies showing that PSA-NCAM+ or P2X2+ cells in the CC do not colocalize with BrdU injected in adult rodents (Alonso, 1999; Stoeckel et al., 2003), we did not find reliable evidences of postnatal generation of CC-contacting neurons. Instead, our study showed that these cells originated in the embryo because many colocalized with BrdU injected in pregnant rats.
The functional relevance of CC-contacting neurons is puzzling. One possibility is that they are sensory cells monitoring the composition of the CSF (Vigh and Vigh-Teichmann, 1998). Indeed, these cells express P2X2 receptors (Stoeckel et al., 2003) and PKD2L1—a polycystic-kidney-disease-like ion channel (Huang et al., 2006) —which are sensitive to changes in pH. As Huang et al. (2006), we found that CC-contacting neurons were strongly excited by a drop in pH. Furthermore, these cells had functional P2X2 receptors because ATP induced currents with an inward rectification characteristic for these channels (North, 2002). However, the fact that neurons away from the CC also responded vigorously to pH changes suggests that acid sensing is a general feature of spinal neurons (Baron et al., 2008).
The different maturational stages suggested by our study may reflect different birth times during late neurogenesis in the embryo. Alternatively, the different electrophysiological phenotypes may simply reflect heterogeneous physiological properties. Cell tracking with retroviral vectors combined with functional studies will help testing these possibilities. Although generated in the embryo, CC-contacting neurons maintained the expression of PSA-NCAM and DCX even in adult rats (Stoeckel et al., 2003; Shechter et al., 2007). Interestingly, a population of prenatally generated neurons in the paleocortex of the adult rat also express PSA-NCAM+ and DCX+ but not mature neuronal markers (Gómez-Climent et al., 2008). Because PSA-NCAM and DCX are involved in plasticity-related events such as cell migration and neurite outgrowth and regeneration (Couillard-Despres et al., 2005; Bonfanti, 2006), the CC region may retain a substantial degree of plasticity similar to neurogenic niches (Ming and Song, 2005). Indeed, in response to minimal spinal injury ependymal cells proliferate and migrate toward the lesion (Mothe and Tator, 2005; Meletis et al., 2008). In an experimental model of multiple sclerosis, Danilov et al. (2006) showed that some migrating cells were neurons. It is tempting to speculate that the ependyma of the rat spinal cord represents a reservoir of immature neurons in standby mode, which under circumstances such as injury or inflammation may resume their differentiation to incorporate within damaged spinal circuits.
Footnotes
The work described here was supported by Grant # 63/135 from Programa de Desarrollo Tecnológico and Grant R01NS048255 from the National Institute of Neurological Disorders and Stroke to R.E.R. The content is solely the responsibility of the authors and does not necessarily represent the official views of the National Institute of Neurological Disorders and Stroke or the National Institutes of Health. We thank Dr. A. Fernández and J. Cedrani for participating in an early stage of the project, G. Fabbiani and M. I. Rehermann for technical assistance and Dr. A. Merdes for the generous gift of the PCM-1 antibody. The sialylated form of the NCAM monoclonal antibody developed by Drs. T. M. Jessell and J. Dodd was obtained from the Developmental Studies Hybridoma Bank developed under the auspices of the National Institute of Child Health and Human Development and maintained by The University of Iowa, Department of Biology, Iowa City, IA.
References
- Alonso G. Neuronal progenitor-like cells expressing polysialylated neural cell adhesion molecule are present on the ventricular surface of the adult rat brain and spinal cord. J Comp Neurol. 1999;414:149–166. doi: 10.1002/(sici)1096-9861(19991115)414:2<149::aid-cne2>3.0.co;2-o. [DOI] [PubMed] [Google Scholar]
- Baron A, Voilley N, Lazdunski M, Lingueglia E. Acid sensing ion channels in dorsal spinal cord neurons. J Neurosci. 2008;28:1498–1508. doi: 10.1523/JNEUROSCI.4975-07.2008. [DOI] [PMC free article] [PubMed] [Google Scholar]
- Barry PH, Diamond JM. Junction potentials, electrode standard potentials, and other problems in interpreting electrical properties in membranes. J Membr Biol. 1970;3:93–122. doi: 10.1007/BF01868010. [DOI] [PubMed] [Google Scholar]
- Beattie MS, Bresnahan JC, Komon J, Tovar CA, Van Meter M, Anderson DK, Faden AI, Hsu CY, Noble LJ, Salzman S, Young W. Endogenous repair after spinal cord contusion injuries in the rat. Exp Neurol. 1997;148:453–463. doi: 10.1006/exnr.1997.6695. [DOI] [PubMed] [Google Scholar]
- Belluzzi O, Benedusi M, Ackman J, LoTurco JJ. Electrophysiological differentiation of new neurons in the olfactory bulb. J Neurosci. 2003;23:10411–10418. doi: 10.1523/JNEUROSCI.23-32-10411.2003. [DOI] [PMC free article] [PubMed] [Google Scholar]
- Bischofberger J, Schinder AF. Maturation and functional integration of new granule cells into the adult hippocampus. In: Gage FH, Kempermann G, Song H, editors. Adult neurogenesis. Cold Spring Harbor, NY: Cold Spring Harbor; 2008. pp. 299–319. [DOI] [PMC free article] [PubMed] [Google Scholar]
- Bonfanti L. PSA-NCAM in mammalian structural plasticity and neurogenesis. Prog Neurobiol. 2006;80:129–164. doi: 10.1016/j.pneurobio.2006.08.003. [DOI] [PubMed] [Google Scholar]
- Brown JP, Couillard-Després S, Cooper-Kuhn CM, Winkler J, Aigner L, Kuhn HG. Transient expression of doublecortin during adult neurogenesis. J Comp Neurol. 2003;467:1–10. doi: 10.1002/cne.10874. [DOI] [PubMed] [Google Scholar]
- Bruni JE. Ependymal development, proliferation, and functions: a review. Microsc Res Tech. 1998;41:2–13. doi: 10.1002/(SICI)1097-0029(19980401)41:1<2::AID-JEMT2>3.0.CO;2-Z. [DOI] [PubMed] [Google Scholar]
- Carlén M, Meletis K, Göritz C, Darsalia V, Evergren E, Tanigaki K, Amendola M, Barnabé-Heider F, Yeung MS, Naldini L, Honjo T, Kokaia Z, Shupliakov O, Cassidy RM, Lindvall O, Frisén J. Forebrain ependymal cells are Notch-dependent and generate neuroblasts and astrocytes after stroke. Nat Neurosci. 2009;12:259–267. doi: 10.1038/nn.2268. [DOI] [PubMed] [Google Scholar]
- Carleton A, Petrenau LT, Lansford R, Alvarez-Buylla A, Lledo PM. Becoming new neurons in the adult olfactory bulb. Nat Neurosci. 2003;6:507–518. doi: 10.1038/nn1048. [DOI] [PubMed] [Google Scholar]
- Chiasson BJ, Tropepe V, Morshead CM, van der Kooy D. Adult mammalian forebrain ependymal and subependymal cells demonstrate proliferative potential, but only subependymal cells have neural stem cell characteristics. J Neurosci. 1999;19:4462–4471. doi: 10.1523/JNEUROSCI.19-11-04462.1999. [DOI] [PMC free article] [PubMed] [Google Scholar]
- Connor JA, Stevens CF. Inward and delayed outward membrane currents in isolated neural somata under voltage clamp. J Physiol. 1971;213:1–19. doi: 10.1113/jphysiol.1971.sp009364. [DOI] [PMC free article] [PubMed] [Google Scholar]
- Couillard-Despres S, Winner B, Schaubeck S, Aigner R, Vroemen M, Weidner N, Bogdahn U, Winkler J, Kuhn HG, Aigner L. Doublecortin expression levels in adult brain reflect neurogenesis. Eur J Neurosci. 2005;21:1–14. doi: 10.1111/j.1460-9568.2004.03813.x. [DOI] [PubMed] [Google Scholar]
- Danilov AI, Covacu R, Moe MC, Langmoen IA, Johansson CB, Olsson T, Brundin L. Neurogenesis in the adult spinal cord in an experimental model of multiple sclerosis. Eur J Neurosci. 2006;23:394–400. doi: 10.1111/j.1460-9568.2005.04563.x. [DOI] [PubMed] [Google Scholar]
- Dervan AG, Roberts BL. Reaction of spinal cord central canal cells to cord transaction and their contribution to cord regeneration. J Comp Neurol. 2003;458:293–306. doi: 10.1002/cne.10594. [DOI] [PubMed] [Google Scholar]
- Deschênes-Furry J, Perrone-Bizzozero N, Jasmin BJ. The RNA-binding protein HuD: a regulator of neuronal differentiation, maintenance and plasticity. Bioessays. 2006;28:822–833. doi: 10.1002/bies.20449. [DOI] [PubMed] [Google Scholar]
- Fernández A, Radmilovich M, Trujillo-Cenóz O. Neurogenesis and gliogenesis in the spinal cord of turtles. J Comp Neurol. 2002;453:131–144. doi: 10.1002/cne.10388. [DOI] [PubMed] [Google Scholar]
- Fukuda A, Muramatsu K, Okabe A, Shimano Y, Hida H, Fujimoto I, Nishino H. Changes in intracellular Ca2+ induced by GABAA receptor activation and reduction in Cl- gradient in neonatal rat neocortex. J Neurophysiol. 1998;79:439–446. doi: 10.1152/jn.1998.79.1.439. [DOI] [PubMed] [Google Scholar]
- Gao BX, Ziskind-Conhaim L. Development of ionic currents underlying changes in action potential waveforms in rat spinal motoneurons. J Neurophysiol. 1998;80:3047–3061. doi: 10.1152/jn.1998.80.6.3047. [DOI] [PubMed] [Google Scholar]
- Ge S, Goh EL, Sailor KA, Kitabatake Y, Ming GL, Song H. GABA regulates synaptic integration of newly generated neurons in the adult brain. Nature. 2006;439:589–593. doi: 10.1038/nature04404. [DOI] [PMC free article] [PubMed] [Google Scholar]
- Gómez-Climent MA, Castillo-Gómez E, Varea E, Guirado R, Blasco-Ibáñez JM, Crespo C, Martínez-Guijarro FJ, Nácher J. A population of prenatally generated cells in the rat paleocortex maintains an immature neuronal phenotype into adulthood. Cereb Cortex. 2008;18:2229–2240. doi: 10.1093/cercor/bhm255. [DOI] [PubMed] [Google Scholar]
- Horner PJ, Power AE, Kempermann G, Kuhn HG, Palmer TD, Winkler J, Thal LJ, Gage FH. Proliferation and differentiation of progenitor cells throughout the intact adult rat spinal cord. J Neurosci. 2000;20:2218–2228. doi: 10.1523/JNEUROSCI.20-06-02218.2000. [DOI] [PMC free article] [PubMed] [Google Scholar]
- Huang AL, Chen X, Hoon MA, Chandrashekar J, Guo W, Tränkner D, Ryba NJ, Zuker CS. The cells and logic for mammalian sour taste detection. Nature. 2006;442:934–938. doi: 10.1038/nature05084. [DOI] [PMC free article] [PubMed] [Google Scholar]
- Johansson CB, Momma S, Clarke DL, Risling M, Lendahl U, Frisén J. Identification of a neural stem cell in the adult mammalian central nervous system. Cell. 1999;96:25–34. doi: 10.1016/s0092-8674(00)80956-3. [DOI] [PubMed] [Google Scholar]
- Kuhn HG, Peterson DA. Detection and phenotypic characterization of adult neurogenesis. In: Gage FH, Kempermann G, Song H, editors. Adult neurogenesis. Cold Spring Harbor, NY: Cold Spring Harbor; 2008. pp. 25–47. [DOI] [PMC free article] [PubMed] [Google Scholar]
- Kyrozis A, Reichling DB. Perforated-patch recording with gramicidin avoids artifactual changes in intracellular chloride concentrarion. J Neurosci Methods. 1995;57:27–35. doi: 10.1016/0165-0270(94)00116-x. [DOI] [PubMed] [Google Scholar]
- Lim DA, Huang YC, Alvarez-Buylla . Adult subventricula zone and olfactory bulb neurogenesis. In: Gage FH, Kempermann G, Song H, editors. Adult neurogenesis. Cold Spring Harbor, NY: Cold Spring Harbor; 2008. pp. 175–206. [Google Scholar]
- Lledo PM, Alonso M, Grubb MS. Adult neurogenesis and functional plasticity in neuronal circuits. Nat Rev Neurosci. 2006;7:179–193. doi: 10.1038/nrn1867. [DOI] [PubMed] [Google Scholar]
- Marusich MF, Furneaux HM, Henion PD, Weston JA. Hu neuronal proteins are expressed in proliferating neurogenic cells. J Neurobiol. 1994;25:143–155. doi: 10.1002/neu.480250206. [DOI] [PubMed] [Google Scholar]
- Meletis K, Barnabé-Heider F, Carlén M, Evergren E, Tomilin N, Shupliakov O, Frisén J. Spinal cord injury reveals multilineage differentiation of ependymal cells. PLoS Biol. 2008;6:e182. doi: 10.1371/journal.pbio.0060182. [DOI] [PMC free article] [PubMed] [Google Scholar]
- Ming GL, Song H. Adult neurogenesis in the mammalian central nervous system. Annu Rev Neurosci. 2005;28:223–250. doi: 10.1146/annurev.neuro.28.051804.101459. [DOI] [PubMed] [Google Scholar]
- Miyata T, Kawaguchi A, Saito K, Kawano M, Muto T, Ogawa M. Asymmetric production of surface-dividing and non-surface-dividing cortical progenitor cells. Development. 2004;131:3133–3145. doi: 10.1242/dev.01173. [DOI] [PubMed] [Google Scholar]
- Mothe AJ, Tator CH. Proliferation, migration, and diferentiation of endogenous ependymal region stem/progenitor cells following minimal spinal cord inury in the adult rat. Neuroscience. 2005;131:177–187. doi: 10.1016/j.neuroscience.2004.10.011. [DOI] [PubMed] [Google Scholar]
- Mullen RJ, Buck CR, Smith AM. NeuN, a neuronal specific nuclear protein in vertebrates. Development. 1992;116:201–211. doi: 10.1242/dev.116.1.201. [DOI] [PubMed] [Google Scholar]
- Myers VB, Haydon DA. Ion transfer across lipid membranes in the presence of gramicidin A. II. The ion selectivity. Biochim Biophys Acta. 1972;274:313–322. doi: 10.1016/0005-2736(72)90179-4. [DOI] [PubMed] [Google Scholar]
- Noctor SC, Martínez-Cerdeño V, Kriegstein AR. Distinct behaviors of neural stem and progenitor cells underlie cortical neurogenesis. J Comp Neurol. 2008;508:28–44. doi: 10.1002/cne.21669. [DOI] [PMC free article] [PubMed] [Google Scholar]
- North RA. Molecular physiology of P2X receptors. Physiol Rev. 2002;82:1013–1067. doi: 10.1152/physrev.00015.2002. [DOI] [PubMed] [Google Scholar]
- Owens DF, Kriegstein AR. Is there more to GABA than synaptic inhibition? Nat Rev Neurosci. 2002;3:715–727. doi: 10.1038/nrn919. [DOI] [PubMed] [Google Scholar]
- Owens DF, Boyce LH, Davis MB, Kriegstein AR. Excitatory GABA responses in embryonic and neonatal cortical slices demonstrated by gramicidin perforated-patch recordings and calcium imaging. J Neurosci. 1996;16:6414–6423. doi: 10.1523/JNEUROSCI.16-20-06414.1996. [DOI] [PMC free article] [PubMed] [Google Scholar]
- Peters A, Palay SL, Webster Hde F. The ependyma. In: Peters A, Palay SL, Webster Hde F, editors. The fine structure of the nervous system. Neurons and their supporting cells. Oxford: Oxford UP; 1991a. pp. 312–327. [Google Scholar]
- Peters A, Palay SL, Webster Hde F. The neuronal cell body. In: Peters A, Palay SL, Webster Hde F, editors. The fine structure of the nervous system. Neurons and their supporting cells. Oxford: Oxford UP; 1991b. pp. 14–69. [Google Scholar]
- Russo RE, Hounsgaard J. Burst-generating neurones in the dorsal horn in an in vitro preparation of the turtle spinal cord. J Physiol. 1996;493:55–66. doi: 10.1113/jphysiol.1996.sp021364. [DOI] [PMC free article] [PubMed] [Google Scholar]
- Russo RE, Hounsgaard J. Dynamics of intrinsic electrophysiological properties in spinal cord neurones. Prog Biophys Mol Biol. 1999;72:329–365. doi: 10.1016/s0079-6107(99)00011-5. [DOI] [PubMed] [Google Scholar]
- Russo RE, Fernández A, Reali C, Radmilovich M, Trujillo-Cenóz O. Functional and molecular clues reveal precursor-like cells and immature neurones in the turtle spinal cord. J Physiol. 2004;560:831–838. doi: 10.1113/jphysiol.2004.072405. [DOI] [PMC free article] [PubMed] [Google Scholar]
- Russo RE, Reali C, Radmilovich M, Fernández A, Trujillo-Cenóz O. Connexin 43 delimits functional domains of neurogenic precursors in the spinal cord. J Neurosci. 2008;28:3298–3309. doi: 10.1523/JNEUROSCI.5736-07.2008. [DOI] [PMC free article] [PubMed] [Google Scholar]
- Schmidt-Hieber C, Jonas P, Bischofberger J. Enhanced synaptic plasticity in newly generated granule cells of the adult hippocampus. Nature. 2004;429:184–187. doi: 10.1038/nature02553. [DOI] [PubMed] [Google Scholar]
- Seki T. Hippocampal adult neurogenesis occurs in a microenvironment provided by PSA-NCAM-expressing immature neurons. J Neurosci Res. 2002;69:772–783. doi: 10.1002/jnr.10366. [DOI] [PubMed] [Google Scholar]
- Shechter R, Ziv Y, Schwartz M. New GABAergic interneurons supported by myelin-specific T cells are formed in intact adult spinal cord. Stem Cells. 2007;25:2277–2282. doi: 10.1634/stemcells.2006-0705. [DOI] [PubMed] [Google Scholar]
- Spassky N, Merkle FT, Flames N, Tramontin AD, García-Verdugo JM, Alvarez-Buylla A. Adult ependymal cells are postmitotic and are derived from radial glial cells during embryogenesis. J Neurosci. 2005;25:10–18. doi: 10.1523/JNEUROSCI.1108-04.2005. [DOI] [PMC free article] [PubMed] [Google Scholar]
- Spitzer NC, Lamborghini JE. The development of the action potential mechanism of amphibian neurons isolated in culture. Proc Natl Acad Sci U S A. 1976;73:1641–1645. doi: 10.1073/pnas.73.5.1641. [DOI] [PMC free article] [PubMed] [Google Scholar]
- Spitzer NC, Ribera AB. Development of electrical excitability in embryonic neurons: mechanisms and roles. J Neurobiol. 1998;37:190–197. [PubMed] [Google Scholar]
- Spitzer NC, Vincent A, Lautermilch NJ. Differentiation of electrical excitability in motoneurons. Brain Res Bull. 2000;53:547–552. doi: 10.1016/s0361-9230(00)00388-9. [DOI] [PubMed] [Google Scholar]
- Spitzer NC, Kingston PA, Manning TJ, Conklin MW. Outside and in: development of neuronal excitability. Curr Opin Neurobiol. 2002;12:315–323. doi: 10.1016/s0959-4388(02)00330-6. [DOI] [PubMed] [Google Scholar]
- Spitzer NC, Root CM, Borodinsky LN. Orchestrating neuronal differentiation: patterns of Ca2+ spikes specify transmitter choice. Trends Neurosci. 2004;27:415–421. doi: 10.1016/j.tins.2004.05.003. [DOI] [PubMed] [Google Scholar]
- Stoeckel ME, Uhl-Bronner S, Hugel S, Veinante P, Klein MJ, Mutterer J, Freund-Mercier MJ, Schlichter R. Cerebrospinal fluid-contacting neurons in the rat spinal cord, a gamma-aminobutyric acidergic system expressing the P2X2 subunit of purinergic receptors, PSA-NCAM, GAP-43 immunoreactivities: light and electron microscopic study. J Comp Neurol. 2003;457:159–174. doi: 10.1002/cne.10565. [DOI] [PubMed] [Google Scholar]
- Tozuka Y, Fukuda S, Namba T, Seki T, Hisatsune T. GABAergic excitation promotes neuronal differentiation in adult hippocampal progenitor cells. Neuron. 2005;47:803–815. doi: 10.1016/j.neuron.2005.08.023. [DOI] [PubMed] [Google Scholar]
- van Praag H, Schinder AF, Christie BR, Toni N, Palmer TD, Gage FH. Funtional neurogenesis in the adult hippocampus. Nature. 2002;415:1030–1034. doi: 10.1038/4151030a. [DOI] [PMC free article] [PubMed] [Google Scholar]
- Vigh B, Vigh-Teichmann I. Actual problems of the cerebrospinal fluid-contacting neurons. Microsc Res Tech. 1998;41:57–83. doi: 10.1002/(SICI)1097-0029(19980401)41:1<57::AID-JEMT6>3.0.CO;2-R. [DOI] [PubMed] [Google Scholar]
- Vinay L, Brocard F, Pflieger JF, Simeoni-Alias J, Clarac F. Perinatal development of lumbar motoneurons and their inputs in the rat. Brain Res Bull. 2000;53:635–647. doi: 10.1016/s0361-9230(00)00397-x. [DOI] [PubMed] [Google Scholar]
- Yuste R, Katz LC. Control of postsynaptic Ca2+ influx in developing neocortex by excitatory and inhibitory neurotransmitters. Neuron. 1991;6:333–344. doi: 10.1016/0896-6273(91)90243-s. [DOI] [PubMed] [Google Scholar]