

Abstract
Performance of repetitive hand movements in patients with Parkinson's disease (PD) is characterized by slowness, reduced movement amplitude, and hesitation or arrests in ongoing movement. Currently, the factors and mechanisms contributing to impaired performance of these types of movement remain poorly understood. This study examined the effects of movement frequency and medication on the performance of unconstrained index finger flexion movements in patients with PD and matched control subjects. Movements were synchronized with an auditory tone as the frequency of the tone was increased from 1 to 3 Hz in 0.25 Hz increments. Movement performance was quantified based upon finger kinematics and electromyography (EMG) recorded from the index finger flexors and extensors. The principal finding was that patients with PD showed a dramatic reduction in movement amplitude, an increase in movement frequency, and a loss of phase when the movement frequency reached or exceeded 2 Hz. This deficit was not significantly improved with medications. In contrast, all control subjects could synchronize to 3 Hz. These findings show that movement frequency is a major determinant of hypokinesia during repetitive movements and may contribute to hesitations and movement arrest during clinical testing of bradykinesia in the upper limb of patients with PD.
Keywords: repetitive movements, Parkinson's disease, medication, movement frequency
Among the major clinical signs of Parkinson's disease (PD), bradykinesia is considered to have the greatest impact on functional disability1,2 and is the clinical parameter best correlated with disease severity and rate of progression of the disease.3,4 Clinical evaluations of bradykinesia rate the degree of movement impairment based upon movement frequency, movement amplitude, and the presence and persistence of hesitations in repetitive movements such as finger tapping. These descriptions emphasize that impaired movement is characterized by temporal, spatial, and regularity abnormalities in the kinematic profile. Yet, most quantitative studies of repetitive finger and hand movements in PD have been restricted to the temporal aspects of performance, particularly focusing on the variability of inter-movement intervals.5–10 Using the Wing and Kristofferson11,12 model of timing variability, studies have shown that both motor-delay and clock variance are increased in patients with PD relative to controls and that this variance is reduced following the oral administration of levodopa. However, the results of these studies do not explain the profound changes in movement amplitude (hypokinesia) that occur during clinical testing of repetitive movements.
Several studies have provided initial evidence that impairment in repetitive movements of the upper limb in patients with PD may be frequency dependent.10,13–15. These studies showed impaired timing10 and an increase in movement frequency at movement rates above 2 Hz.13–15 Again, the focus of these studies was on inter-movement intervals and timing variability and did not examine changes in movement amplitude, phase relative to timing cues or the effect of medication on movement performance. The purpose of this study was to examine the effects of frequency and medication on the performance of acoustically-cued repetitive finger movements in patients with PD, focusing on changes in movement amplitude, frequency, and phase. We hypothesized that: (1) high frequency movements would be more impaired than low frequency movements in patients with PD and (2) medication would improve movement performance.
Methods
Subjects
Nine patients with a diagnosis of idiopathic PD (mean age = 65 ± 11 years) and nine control subjects (mean age = 65 ± 10 years) were tested. Control subjects were age (±3 years), gender, and hand-dominance matched to patients with PD. Patients who showed akinetic rigidity in the upper limb (score of 2 or greater on items 23–25 of the unified Parkinson's Disease rating scale [UPDRS]) and a history of good response to levedopa were recruited (see Table 1). Patients with excessive tremor (UPDRS resting or action tremor score greater than 2), other neurological, cognitive, psychological, or musculoskeletal conditions that would confound the experiment were excluded. Patients were tested after a 12-hour withdrawal from their antiparkinson medications and again 1 hour after taking their optimal regimen of medication. The motor section of the UPDRS was conducted prior to performing movement tasks both off and on medication. All subjects gave their written informed consent prior to inclusion into the study, and the Institutional Review Board of Northwestern University approved the procedures.
TABLE 1. Patient information and UPDRS scores.
| UPDRS | |||||||
|---|---|---|---|---|---|---|---|
| Patient | Sex | Age | Medications (Dose in mg) | Item 23 hand tested off/on | Item 23 both hands off/on | Items 23–25 hand tested off/on | Total motor score off/on |
| 1 | F | 56 | C/L ((75/100), E (600), A (200), P(4.5) | 2.5/1.5 | 2.5/1.5 | 6.5/3.5 | 22/7.5 |
| 2 | M | 55 | C/L (100/400), E (800), A (200), P (6) | 2.5/1 | 3.5/1 | 6.5/3 | 20.5/8 |
| 3 | F | 62 | C/L (125/500), E (800), P (3.75) | 2/1 | 5/2 | 5/2 | 37/20 |
| 4 | F | 47 | C/L (137.5/550), CCR (50), E (1000), LCR (200), P (4) | 3.5/2 | 6.5/4 | 9.5/5 | 51/24.5 |
| 5 | M | 73 | C/L (125/500), R (12), CCR (250), LCR (1000) | 3/2.5 | 6/4.5 | 5/3 | 34/19 |
| 6 | F | 79 | C/L (50/200) | 2/1 | 4/2 | 4/2 | 25.5/11 |
| 7 | F | 73 | C/L (100/400) | 1/0.5 | 2/0.5 | 4/2 | 21/15 |
| 8 | M | 76 | C/L (50/200) | 2/1.5 | 4/3 | 6/5.5 | 27.5/19 |
| 9 | M | 68 | C/L (162.5/650) | 1/1 | 2/1.5 | 3/3 | 26.5/19 |
| Mean ± 1 SD | 65 ± 11 | 2.2 ± 0.83/1.3 ± 0.61 | 3.9 ± 1.65/2.2 ± 1.35 | 5.5 ± 1.92/3.2 ± 1.28 | 29.4 ± 9.85/15.8 ± 5.89 | ||
| Statistics | t = 5.000, P = 0.001 | t = 6.200, P < 0.001 | t = 4.824, P < 0.001 | t = 6.600, P < 0.001 | |||
SD, standard deviation; C/L, carbidopa/levodopa; CCR, carbidopa controlled release; LCR, levodopa controlled release; E, entacapone; A, amantadine; P, pramipexole; R, ropinirole.
Movement Task
Subjects sat in a chair with their shoulder abducted to 30°, elbow flexed at 90°, and forearm in a semi-pro-nated position with the palm facing downward. The forearm, palmar aspect of the hand, thumb and fingers 3 to 5 were supported, restricting movement to the index finger. Subjects were instructed to flex the index finger over a range of motion of ∼25°, starting from a neutral position. No external feedback was provided, and subjects were free to adjust movement amplitude to maintain a 1:1 stimulus/response ratio. In eight of nine cases, patients with PD performed the task with their most affected hand. An incremental frequency task, comparable to the paradigm described by Kelso and coworkers16–21 was used. This task consisted of a series of acoustic tones (50 ms, 500 Hz, 80 dB) presented and maintained for 15 intervals, starting at a rate of 1.0 Hz. The rate of the tone was then increased by 0.25 Hz and maintained for 15 intervals until reaching 15 intervals at 3.0 Hz. A total of 135 movements were completed per trial (see Fig. 1). Subjects were asked to synchronize movement with the tone and given 1–3 practice trials to ensure that subjects understood the task requirements. A total of five trials were collected both off and on medication. A 2-min rest period was provided between trials to prevent subject fatigue.
FIG. 1.
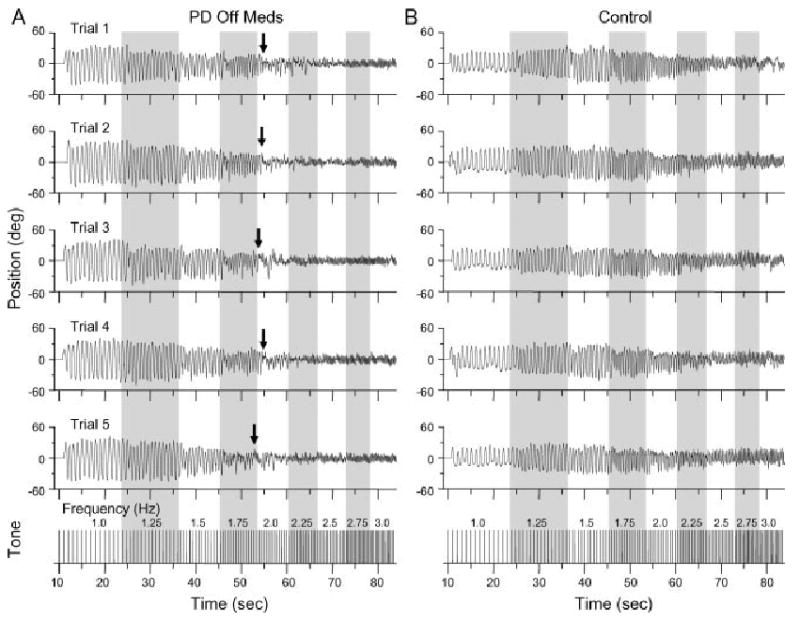
Paradigm example and raw position data shown from (A) one subject with PD off medication and (B) one control subject. Arrows indicated the point where movement performance deteriorated in the patient with PD.
Data Collection
Bipolar surface electromyography (EMG) was recorded from the first dorsal interossieous (FDI) and extensor digitorum communis (EDC) muscles. EMG signals were amplified and filtered (30–1,000 Hz) (Grass P511, Grass Technologies). Finger movement was measured using a uni-axial accelerometer (Entran EGCS-D1S-25, Measurement Specialties) placed on the dorsum of the middle phalanx of the index finger. Both EMG and accelerometer signals were collected at 2,000 samples/second using a data acquisition board (Power 1401, Cambridge Electronic Design, UK) and software (Signal 2, CED).
Data Analysis
The acceleration signal was processed by applying a 60 Hz notch filter to remove any mains noise and implementing a 2nd-order dual-pass Butterworth high-pass filter with a 1 Hz cut-off to eliminate any DC bias resulting in zero mean signals. Finger displacement was derived by double integrating the acceleration signal using a modified trapezoidal rule algorithm.
Finger displacement data was analyzed using power spectral density techniques (fast Fourier transform (FFT) with N = 8192, frequency resolution of 0.244 Hz). The mean spectral power was calculated across all trials for each tone frequency (1–3 Hz). Peak-to-peak amplitude was calculated for each movement and averaged across movements for each tone frequency. Movement frequency was calculated from the timing of each peak flexion displacement and averaged over each tone frequency. Because no constraints were placed upon the range of motion, spectral power and movement amplitude were normalized to data at 1 Hz to allow comparisons of the relative change in movement amplitude across frequencies and between-subjects.
At low tone frequencies, all subjects synchronized peak flexion with the tone. For this reason, movement phase was determined from the time of peak flexion displacement to the nearest tone. The distribution of phase shift was represented using a cumulative sum function. The function was obtained by successively summing the total number of movements in each 10° phase bin from −180 to 180°. Because of the variability in total number of movements performed across subjects, the cumulative sum was normalized to the maximum number of movements for each tone frequency. Phase variation was assessed by calculating the standard deviation of phase with respect to a mean phase of zero degrees (optimal performance) for each tone frequency and averaging this variance across subjects.
The EMG signal for both the FDI and EDC was corrected for DC offset and full-wave rectified. The area under the curve was integrated within each tone frequency interval and then divided by the period (sec) of that interval.22 EMG data was then averaged and normalized to the mean area at 1 Hz.
Statistical Analysis
A repeated measures analysis of variance was used to determine differences between groups (PD off or on meds. vs. controls) and across conditions (frequency and medication) for each dependent measure (movement amplitude, movement frequency, phase variance, and EMG area). Interaction effects were tested with t-tests with Bonferroni correction. Paired samples t-tests were completed for UPDRS comparisons.
Results
For patients with PD, there was a significant effect of medication on UPDRS finger taps and total motor scores (t < 6.6, P < 0.001) (Table 1).
Consecutive trials from one subject with PD off medication (see Fig. 1A) and one control subject (see Fig. 1B) are shown in Figure 1. The subject with PD showed an initial deterioration in performance at 1.75 Hz, but remained in phase with the tone. When the tone frequency increased to 2 Hz, there was a marked deterioration of movement performance (decrease in movement amplitude, increase in movement frequency, and loss of phase) as indicated by the arrows. The control subject showed an incremental decrease in movement amplitude at movement frequencies above 1.5 Hz, but was able to maintain a 1:1 stimulus/response ratio up to 3 Hz.
Across subjects with PD, movement performance was characterized by an initial drop in relative movement amplitude and an increase in movement frequency at tone frequencies near 1.75 Hz, followed by a more dramatic loss of amplitude and loss of phase at 2 Hz and above. This deficit is demonstrated in the normalized average power spectra across subjects (see Fig. 2A). Note the initial decrease in relative movement power compared to controls at 1.75 Hz and the nearly complete loss of movement by 2.25 Hz. Similarly, the average normalized movement amplitude and frequency data show a decrease in movement amplitude and increase in movement frequency starting near 1.75 Hz (see Fig. 2B,C, respectively). Movement amplitude was significantly different from controls at tone frequencies of 1.5 Hz and above off medication (P < 0.037) and from 2.0 to 2.5 Hz on medication (P < 0.045) (Fig. 2B). Movement frequency differed at tone frequencies of 2.25 and 2.5 Hz in the off medication state only (P < 0.026) (Fig. 2C). Medication marginally improved movement amplitude and frequency but these changes were not significant for any dependent variable (F < 3.701, P > 0.09). Control subjects showed a transition in movement amplitude near 2 Hz, but were able to maintain the 1:1 stimulus/response ratio for all tone frequencies.
FIG. 2.
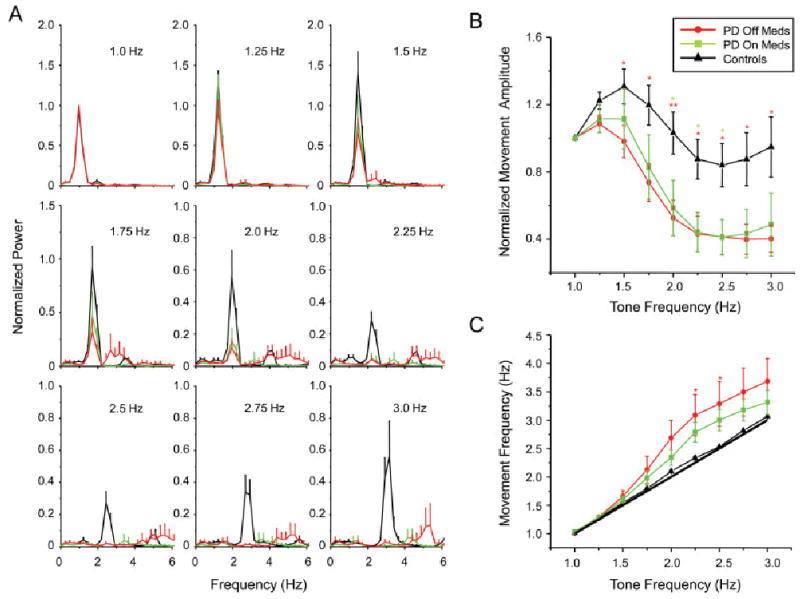
Mean and standard error for (A) normalized power spectra, (B) normalized movement amplitude, and (C) movement frequency. Asterisks designated differences between PD off ( ) and on (
 ) medication and controls, *P < 0.05, **P < 0.01, ***P < 0.001.
Movement phase was examined using a cumulative sum analysis (see Fig. 3A). The steepest portion of the sigmoidal curve indicates the phase where the majority of movements occurred. In both groups, movements were performed with a phase close to zero degrees at tone frequencies between 1 and 1.75 Hz. Above 1.75 Hz, both groups showed a transition in phase, but this change was different between groups. Six of nine patients with PD showed a flattened phase distribution (a near linear slope of the cumulative sum plots) indicative of a near-complete loss of phase (Fig. 3B). In contrast, movements by control subjects remained time-locked to the tone, but showed a wide variance in phase-lag across subjects at 2 Hz. At all frequencies above 2 Hz, the flattened phase distribution remained in the PD subjects, while movements by control subjects returned to a phase close to zero degrees.
FIG. 3.
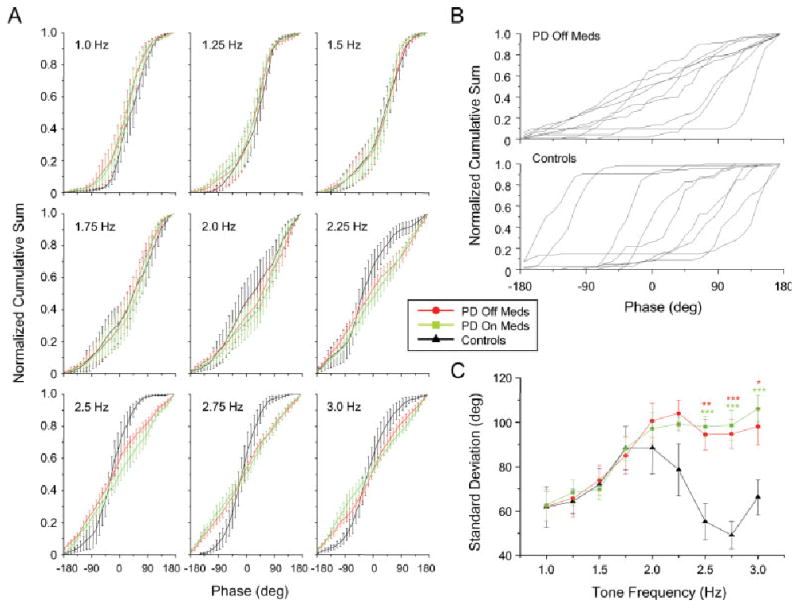
(A) Mean and standard error for normalized cumulative sum, (B) individual cumulative sums at 2.0 Hz, and (C) mean and standard error for phase variation. Asterisks designated differences between both PD off () and on () medication and controls, * P < 0.05, ** P < 0.01, *** P < 0.001.
Group differences in phase variance are shown in Figure 3C. For both groups, phase variance increased as the tone frequency increased to 1.75 Hz. At 2 Hz and above the standard deviation decreased in the control subjects but remained elevated in the subjects with PD in both medication states. Differences between groups (both medication states) were significant at 2.5 Hz and above (P < 0.013). There was no significant effect of medication (F = 4.486, P = 0.067).
Figure 4 shows normalized EMG activity for the FDI (see Fig. 4A) and EDC (see Fig. 4B) muscles across tone frequencies. In control subjects there was a monotonic increase in FDI EMG activity with increasing tone frequency. FDI activity (relative to 1 Hz) was reduced in the PD subjects but also showed a gradual increase in magnitude up to 2 Hz. However, in both medication states, FDI EMG activity ceased to increase when the tone frequency exceeded 2 to 2.25 Hz. Differences in FDI EMG were significant at 1.75 Hz and above between PD OFF meds and controls (P < 0.036) and at 1.5, 1.75, and 2.5 Hz and above between PD ON meds and controls (P < 0.041). In contrast, there were no significant differences in EDC EMG activity between groups. There was no significant effect of medication for either FDI (F = 0.631, P = 0.45) or EDC (F = 0.709, P = 0.424) activity.
FIG. 4.
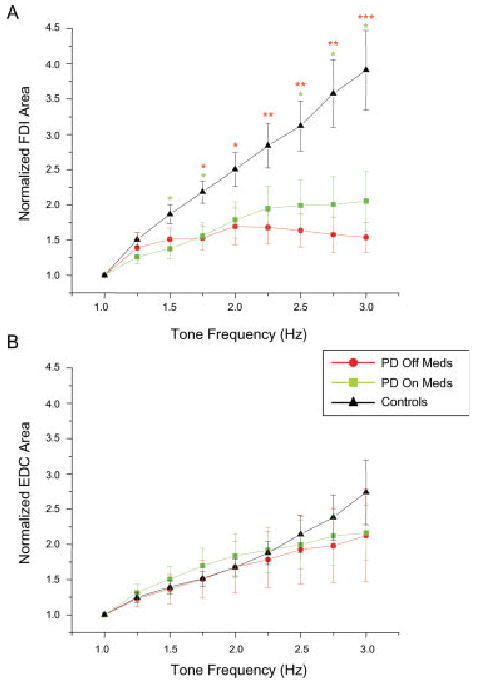
Mean and standard error for (A) normalized FDI area and (B) normalized EDC area. Asterisks designated differences between both PD off () and on () medication and controls, *P < 0.05, **P < 0.01, ***P < 0.001.
Discussion
The main finding of this experiment was that patients with mild to moderate PD showed a dramatic impairment in movement performance at tone frequencies near 2.0 Hz. This finding is consistent with previous studies suggesting that repetitive movement impairment in patients with PD is principally manifested when movement frequency exceeds 2 Hz. Pastor et al.10 reported that patients with PD showed significant deficits in the accuracy of movement timing at movement rates of 2 and 2.5 Hz, but were not significantly different from controls at lower frequencies. Similarly Nakamura et al.14 reported a marked increase (hastening) in movement frequency when patients with PD performed finger taps at rates above 2.5 Hz. However, these articles exclusively focused on movement timing. The findings of our experiments are the first to show that movement amplitude, frequency, and phase markedly deteriorate when the required movement frequency nears or exceeds 2 Hz. This impairment may be analogous to the hypokinesia, hesitations, and movement arrest observed during clinical testing of repetitive finger movements. In keeping with this idea, Agostino et al.3 have shown that repetitive index finger movements deteriorate in as little as 5 seconds when patients are instructed to “to move as fast and as widely as possible”. Under these conditions, patients moved at a mean rate of 2.1 Hz, which is consistent with the movement frequency barrier identified in the present study.
Optimal medication had little effect on the movement amplitude, frequency, and phase impairments observed above 2 Hz. This may be because of the additive effects of L-dopa, suggesting that a 12-hour withdrawal of medication may not have been long enough to elicit significant effects. However, there was a significant effect of medication on hand function when assessed with the UPDRS and several studies have shown that medication improved timing variance at rates of 2 Hz and over.9,10 The discrepancy in medication effect between the clinical ratings and our quantitative measures of movement performance may relate to the fact that clinical testing was performed without cues and thus patients could adopt a strategy of low frequency and higher amplitude. Nonetheless, our findings suggest that two factors considered to improve bradykinesia in PD, medication and external cueing, do not prevent the arrest of movement observed near 2 Hz.
There is both behavioral and electrophysiological evidence from studies in healthy individuals that movement frequencies near 2 Hz are associated with a transition in control strategy. Consistent with previous studies,23 the control subjects in our study showed a distinct change in movement amplitude, phase lag, and phase variance, but not movement frequency at a tone frequency of 2 Hz. Toma et al.23 showed that this transition is associated with a change in movement-related cortical oscillations measured from scalp surface electroencephalogram (EEG) signals. At movement rates less than 2 Hz, there was a pattern of desynchronization then synchronization of β band oscillations coupled with each movement. At movement rates above 2 Hz, β band oscillations became continuously desynchronized.
There is now considerable evidence showing that resting and movement-related oscillations in the β band are increased in patients with PD.24,25. In the present study, subjects with PD performed similarly to control subjects until reaching a movement frequency near 2 Hz. Thus, the impairment in movement performance at or above 2 Hz may be because of an impaired ability to desynchronize elevated β band oscillations when movements require continuous control. This is consistent with the idea that the basal ganglia contributes more to continuous movements (such as high frequency repetitive finger tapping) whereas the cerebellum is preferentially involved in the control of discrete movements (such as low frequency repetitive finger tapping).23,26,27,28
The emergence of co-contraction of the agonist and antagonist muscles may explain the abrupt change in movement performance near 2 Hz in patients with PD. However, analysis of the EMG signals showed that changes in movement performance were associated with a loss of increment of FDI (agonist) activity beyond 2 Hz, while there was no difference in EDC (antagonist) activity between groups. As EMG recordings were restricted to surface muscles, we cannot rule out the possibility that activation of deeper antagonist muscles, such as the extensor indicis, may have changed. Nonetheless, these data suggest that the impairment in movement performance cannot be explained by co-contraction, but rather a marked reduction in neural drive to the motor units of the agonist muscle.
In conclusion, the dramatic change in movement amplitude, frequency, and phase at tone frequencies neat to and above 2.0 Hz may be attributed to impaired motor cortical oscillations leading to a reduction in neural drive to the agonist muscle. These findings show that these factors are a major determinant of hypokinesia during repetitive movements and may contribute to hesitations and movement arrest during clinical testing of bradykinesia in the upper limb of patients with PD.
Acknowledgments
This project was supported by NIH Grant R01 NS054199 and a grant from the Parkinson Alliance. We thank Mr. Fang Gao and Dr. Lance Myers for their assistance with the data.
Footnotes
Potential conflict of interest: Nothing to report.
Author Roles: Research project: A. Conception: Elizabeth L. Stegemöller, Tanya Simuni, Colum D. MacKinnon; B. Organization: Elizabeth L. Stegemöller, Tanya Simuni, Colum D. MacKinnon; C. Execution: Elizabeth L. Stegemöller, Tanya Simuni, Colum D. MacKinnon. Statistical Analysis: A. Design: Elizabeth L. Stegemöller, Colum D. MacKinnon; B. Execution: Elizabeth L. Stegemöller; C. Review and Critique: Elizabeth L. Stegemöller, Tanya Simuni, Colum D. MacKinnon. Manuscript: A. Writing of the first draft: Elizabeth L. Stegemöller, Colum D. MacKinnon; B. Review and Critique: Elizabeth L. Stegemöller, Tanya Simuni, Colum D. MacKinnon.
References
- 1.Rocchi L, Chiari L, Horak FB. Effects of deep brain stimulation and levodopa on postural sway in Parkinson's disease. J Neurol Neurosurg Psychiatry. 2002;73:267–274. doi: 10.1136/jnnp.73.3.267. [DOI] [PMC free article] [PubMed] [Google Scholar]
- 2.Diederich NJ, Moore CG, Leurgans SE, Chmura TA, Goetz CG. Parkinson disease with old-age onset – a comparative study with subjects with middle-age onset. Arch Neurol. 2003;60:529–533. doi: 10.1001/archneur.60.4.529. [DOI] [PubMed] [Google Scholar]
- 3.Agostino R, Curra A, Giovannelli M, Modugno N, Manfredi M, Berardelli A. Impairment of individual finger movements in Parkinson's disease. Mov Disord. 2003;18:560–565. doi: 10.1002/mds.10313. [DOI] [PubMed] [Google Scholar]
- 4.Vingerhoets F, Schulzer M, Calne DB, Snow BJ. Which clinical sign of Parkinson's disease best reflects the nigrostriatal lesion? Ann Neurol. 1997;41:58–64. doi: 10.1002/ana.410410111. [DOI] [PubMed] [Google Scholar]
- 5.Harrington DL, Haaland KY, Hermanowicz N. Temporal processing in the basal ganglia. Neuropsychology. 1998;12:3–12. doi: 10.1037//0894-4105.12.1.3. [DOI] [PubMed] [Google Scholar]
- 6.Ivry R, Keele SW. Timing functions of the cerebellum. J Cogn Neurosci. 1989;1:136–152. doi: 10.1162/jocn.1989.1.2.136. [DOI] [PubMed] [Google Scholar]
- 7.Ivry RB, Keele SW, Diener HC. Dissociation of the lateral and medial cerebellum in movement timing and movement execution. Exp Brain Res. 1988;73:167–180. doi: 10.1007/BF00279670. [DOI] [PubMed] [Google Scholar]
- 8.Keele S, Ivry RB. Force control and its relation to timing. J Motor Behav. 1987;19:96–114. doi: 10.1080/00222895.1987.10735402. [DOI] [PubMed] [Google Scholar]
- 9.O'Boyle D, Freeman JS, Cody FW. The accuracy and precision of timing or self-paced, repetitive movements in subjects with Parkinson's disease. Brain. 1996;119:51–70. doi: 10.1093/brain/119.1.51. [DOI] [PubMed] [Google Scholar]
- 10.Pastor MA, Jahanshahi M, Artieda J, Obeso JA. Performance of repetitive wrist movements in Parkinson's disease. Brain. 1992;115:875–891. doi: 10.1093/brain/115.3.875. [DOI] [PubMed] [Google Scholar]
- 11.Wing AM, Kristofferson AB. Response delays and timing of discrete motor responses. Percept Psychophys. 1973;14:5–12. [Google Scholar]
- 12.Wing AM, Kristofferson AB. Timing of interresponse intervals. Percept Psychophys. 1973;13:455–460. [Google Scholar]
- 13.Freeman J, Cody FW, Schady W. The influence of external timing cues upon the rhythm of voluntary movements in Parkinson's disease. J Neurol Neurosurg Psychiatry. 1993;56:1078–1084. doi: 10.1136/jnnp.56.10.1078. [DOI] [PMC free article] [PubMed] [Google Scholar]
- 14.Nakamura R, Nagasaki H, Narabayashi H. Disturbances of rhythm formation in patients with Parkinson's disease.1. Characteristics of tapping response to periodic signals. Percept Mot Skills. 1978;46:63–75. doi: 10.2466/pms.1978.46.1.63. [DOI] [PubMed] [Google Scholar]
- 15.Yahalom G, Simon ES, Thorne R, Peretz C, Giladi N. Hand rhythmic tapping and timing in Parkinson's disease. Parkinonism Relat Disord. 2004;10:143–148. doi: 10.1016/j.parkreldis.2003.10.001. [DOI] [PubMed] [Google Scholar]
- 16.Jantzen KJ, Steinberg FL, Kelso JAS. Practice-dependent modulation of neural activity during human sensorimotor coordination: a functional magnetic resonance imaging study. Neuroscience Lett. 2002;332:205–209. doi: 10.1016/s0304-3940(02)00956-4. [DOI] [PubMed] [Google Scholar]
- 17.Jantzen KJ, Steinberg FL, Kelso JAS. Brain networks underlying human timing behavior are influenced by prior context. Proc Natl Acad Sci USA. 2004;101:6815–6820. doi: 10.1073/pnas.0401300101. [DOI] [PMC free article] [PubMed] [Google Scholar]
- 18.Jantzen KJ, Steinberg FL, Kelso JAS. Functional MRI reveals the existence of modality and coordination-dependent timing networks. Neuroimage. 2005;25:1031–1042. doi: 10.1016/j.neuroimage.2004.12.029. [DOI] [PubMed] [Google Scholar]
- 19.Mayville J, Bressler SL, Fuchs A, Kelso JAS. Spatiotemporal reorganization of electrical activity in the human brain associated with a timing transition in rhythmic auditory-motor coordination. Exp Brain Res. 1999;127:371–381. doi: 10.1007/s002210050805. [DOI] [PubMed] [Google Scholar]
- 20.Mayville J, Fuchs A, Ding M, Cheyne D, Deecke L, Kelso JAS. Event-related changes in neuromagnetic activity association with syncopation and synchronization timing tasks. Hum Brain Mapp. 2001;14:65–80. doi: 10.1002/hbm.1042. [DOI] [PMC free article] [PubMed] [Google Scholar]
- 21.Mayville JM, Jantzen KJ, Fuchs A, Steinberg FL, Kelso JAS. Cortical and subcortical networks underlying syncopated and synchronized coordination revealed using fMRI. Hum Brain Mapp. 2002;17:214–229. doi: 10.1002/hbm.10065. [DOI] [PMC free article] [PubMed] [Google Scholar]
- 22.Pfann KD, Buchman AS, Comella CL, Corcos DM. Control of movement distance in Parkinson's disease. Mov Disord. 2001;16:1048–1065. doi: 10.1002/mds.1220. [DOI] [PubMed] [Google Scholar]
- 23.Toma K, Mima T, Matsuoka T, et al. Movement rate effect on activation and functional coupling of motor cortical areas. J Neurophysiol. 2002;88:3377–3385. doi: 10.1152/jn.00281.2002. [DOI] [PubMed] [Google Scholar]
- 24.Brown P. Oscillatory nature of human basal ganglia activity: relationship to the pathophysiology of Parkinson's disease. Mov Disord. 2003;18:357–363. doi: 10.1002/mds.10358. [DOI] [PubMed] [Google Scholar]
- 25.Levy R, Dostrovsky JO, Lang AE, Sime E, Hutchison WD, Lorano AM. Effects of apomorphine on subthalamic nucleus and globus pallidus neurons in patients with Parkinson's disease. J Neurophysiol. 2001;86:249–260. doi: 10.1152/jn.2001.86.1.249. [DOI] [PubMed] [Google Scholar]
- 26.Spencer R, Ivry RM. Comparison of patients with Parkinson's disease or cerebellar lesions in the production of periodic movements involving event-based or emergent timing. Brain Cogn. 2005;58:84–93. doi: 10.1016/j.bandc.2004.09.010. [DOI] [PubMed] [Google Scholar]
- 27.Flowers K. Some frequency response characteristics of Parkinsonism. Brain. 1978;101:19–34. doi: 10.1093/brain/101.1.19. [DOI] [PubMed] [Google Scholar]
- 28.Flowers K. Lack of prediction in the motor behavior of Parkinsonism. Brain. 1978;101:35–52. doi: 10.1093/brain/101.1.35. [DOI] [PubMed] [Google Scholar]