

Abstract
The simple spike firing of cerebellar Purkinje cells encodes information on the kinematics of limb movements. However, these conclusions have been primarily based on averaging the discharge of Purkinje cells across trials and time and there is little information on whether Purkinje cell simple spike firing encodes specific motor errors during limb movements. Therefore, this study investigated single-trial correlations between the instantaneous simple spike firing of Purkinje cells with various kinematics and error signals. Purkinje cells (n = 126) were recorded in the intermediate and lateral zones centered on the primary fissure while three monkeys intercepted and tracked a target moving in a circle. Cross-correlation analysis was performed between the instantaneous simple spike firing rate and speed, the directional component of the velocity vector, and error signals during single movement trials. Significant correlations at physiologically relevant lags of ±250 ms were observed with tracking speed for 37% of Purkinje cells, with the velocity component in 39%, with direction error in 6% and speed error in 25%. Simple spike firing of the majority of Purkinje cells with significant correlation showed a negative lag with respect to speed and a positive lag with respect to error signals. We hypothesize that the cerebellum is involved in movement planning and control by continuously monitoring movement errors and making intermittent corrections that are represented as fluctuations in the speed profile.
Keywords: Cerebellum, Purkinje cell, Submovements, Tracking errors, Motor primitives
Introduction
Fundamental to understanding the cerebellum’s role in the control of movements is to understand the parameters encoded in the discharge of cerebellar neurons. Studies in behaving monkeys have shown that the simple spike firing of Purkinje cells modulate in relation to the kinematics of limb movements including position, movement direction and speed/velocity (Thach 1968; Fortier et al. 1989; Marple-Horvat and Stein 1987; Fu et al. 1997; Coltz et al. 1999; Liu et al. 2003; Roitman et al. 2005). Most of these investigations were based on Purkinje cells recorded in the paravermal and neighboring lateral zones in lobules IV–VI, a region known to be involved with the control of limb movements (Fortier et al. 1989; Fu et al. 1997). Furthermore, recent evidence shows that Purkinje cells in this area have very limited sensitivity to large changes in limb dynamics produced by external force fields (Pasalar et al. 2006).
The cerebellum has been widely implicated in both feed-forward control as well as error monitoring and movement correction (Oscarsson 1980; Ojakangas and Ebner 1994; Kitazawa et al. 1998; Diedrichsen et al. 2005; Morton and Bastian 2006; Bastian 2006). Also, the hypothesis that the cerebellum is the site of internal models of the motor apparatus generally requires that the cerebellum has access to motor error signals to adjust the internal model (Miall et al. 1993; Wolpert et al. 1998; Diedrichsen et al. 2005; Tseng et al. 2007). Although a number of studies have found that complex spikes are modulated by errors in limb movements (Gilbert and Thach 1977; Ojakangas and Ebner 1994; Kitazawa et al. 1998; Norris et al. 2004), there is little, if any, information on whether simple spike firing encodes specific movement errors.
Previous studies assessing the relation of Purkinje cell simple spike firing to movement parameters have primarily relied on averaging the discharge over a number of trials as well as averaging over time epochs (Thach 1968; Mano and Yamamoto 1980; Fortier et al. 1989; Marple-Horvat and Stein 1987; Fu et al. 1997; Coltz et al. 1999; Liu et al. 2003; Roitman et al. 2005). Recently, it has been shown that the single trial variations in simple spike firing of Purkinje cells in the floccular complex of the cerebellum are correlated with those in eye position, velocity and acceleration during smooth pursuit (Medina and Lisberger 2007). This strong neuron-behavior correlation is consistent with the concept that simple spike firing is involved directly in the control of eye movements. Therefore, it is of interest to determine if the simple spike firing during limb movements shows robust correlations with movement kinematics during single trials.
The correlation between simple spike discharge and kinematics of limb movements during single trials is of interest from another perspective. Complex limb movements are segmented into submovements, also referred to as intermittencies. Submovements are evident in the speed profiles as bell-shaped irregularities (Miall et al. 1986; Doeringer and Hogan 1998; Novak et al. 2000; Roitman et al. 2004). Submovements have both feed-forward and feedback characteristics and have been hypothesized to be scalable elemental blocks used to generate complex movements (Miall et al. 1986; Milner and Ijaz 1990; Doeringer and Hogan 1998; Roitman et al. 2004). Submovements are not simply biomechanical in nature (Roitman et al. 2004; Pasalar et al. 2005) and segmentation occurs in the EMG activity during slow finger movements, demonstrating that the final motor command is inherently intermittent (Vallbo and Wessberg 1993). However, little is known about the central structures involved in producing and controlling submovements or the neural correlates of submovements at the single cell level.
An argument can be made for a possible role for the cerebellum in the control and production of submovements. The two strongest arguments linking the cerebellum to submovements are, first, that the same kinematic parameters (position, movement direction, and speed) used to control visually guided manual tracking (Engel and Soechting 2000) are involved in the control of submovements (Roitman et al. 2004) and Purkinje cell simple spike discharge is highly modulated in relation to the same kinematic parameters (Marple-Horvat and Stein 1987; Fortier et al. 1989; Coltz et al. 1999; Roitman et al. 2005). Second, as detailed above, both the cerebellum and submovements have been implicated in feed-forward and feedback control. Therefore, the purpose of this study was to investigate the relation between instantaneous simple spike firing of Purkinje cells and various kinematic parameters during single trials and to assess whether the cerebellum participates in the control of submovements.
Materials and methods
Behavioral task
Three monkeys (H, M, and P; female; Macaca mulatta; 5–6 kg) performed a visually guided circular tracking task (Roitman et al. 2004). Experimentation was in accordance with the Policy on the Use of Animals in Neuroscience Research as endorsed by the Society for Neuroscience and was approved by the Institutional Animal Care and Use Committee of the University of Minnesota. The monkeys moved a cursor (1 cm black cross-hair) on a vertically mounted screen by moving a two-jointed manipulandum in the horizontal plane (Fig. 1a). Each trial was initiated by the monkey holding the cursor on a centrally located “hold” target (1.8 cm diameter red circle) for a random time (1–2 s, Hold period). A cue target (2.5 cm diameter yellow circle) then appeared at a radius of 5 cm at one of four different start angles (0, 90, 180, or 270°) and moved either clockwise (CW) or counterclockwise (CCW) for 180° (Cue period) at a constant speed ranging from 3.1 to 9.6 cm/s. The target then changed to red signaling the monkey to intercept the circularly moving target within 65° of target travel (Intercept period) and to track the target for an additional 360° (Track period). At any point in the trial sequence, deviation of the cursor from the hold or moving target aborted the trial. Target speeds (four or five depending on the monkey), start angles (four), and tracking directions (two) were randomly presented in a block. A total of ten blocks (320 or 400 trials) were recorded for each cell.
Fig. 1.

a The four periods of the circular tracking task. Sample single trial tracking paths (b), speed profiles (c), and simple spike discharge (d). Each panel in b–d shows data from five single trials (CCW, target speed 5.7 cm/s, start angle 90°, gray traces) with their averages (black trace)
Behavioral and neural data acquisition
Hand position was acquired at 200 samples/s using precision potentiometers and was used to drive the cursor position on the monitor. Hand velocity was calculated by numerical differentiation of the position signal and was lowpass filtered at 12 Hz to preserve the physiologically relevant frequencies of the arm movements (Roitman et al. 2004).
The recording chamber was stereotaxically positioned over the parietal cortex ipsilateral to the tracking arm, targeting the intermediate and neighboring lateral zones of lobule V (Thach 1968; Fu et al. 1997; Coltz et al. 1999). The chamber was centered over the posterior parietal area, 2–3 mm anterior to the intraparietal sulcus. Histological results for monkeys H and M confirmed that the recordings were in the targeted areas as documented in a previous publication (Roitman et al. 2005). Monkey P is still being studied. Purkinje cells were recorded extracellularly using one or two paralyene-coated tungsten microelectrodes and identified by the presence of complex spikes (Thach 1968). Conventional techniques were used to amplify the spike waveforms prior to spike discrimination (MSD, Alpha-Omega Engineering). Simple spike data were stored at 1 kHz and transformed to a continuous, instantaneous discharge rate using fractional interspike intervals with downsampling to 200 Hz (Taira et al. 1996).
Data analysis
Cross-correlation analysis was performed between the simple spike firing and several kinematic and error variables. Analyses were restricted to the data from the Tack period. First, we describe each of these variables and the rationale for their use. Second, we describe in detail below the calculation of the cross-correlations for single trials, including the assessment of tracking direction, speed and start angle on the correlations and the method used to determine if a correlation was significant.
The primary kinematic variable examined was movement speed because simple spike firing is known to be modulated by speed (Mano and Yamamoto 1980; Marple-Horvat and Stein 1987; Coltz et al. 1999; Johnson and Ebner 2000; Greger et al. 2004; Roitman et al. 2005). Also, we examined speed because the fluctuations in the speed are used to define submovements (Miall et al. 1986; Doeringer and Hogan 1998; Novak et al. 2000; Roitman et al. 2004). Using the approach detailed below, the instantaneous simple spike firing was correlated with tracking speed.
It is also well established that simple spike firing has directional tuning during this circular tracking paradigm and during other limb movement tasks (Fortier et al. 1989; Fu et al. 1997; Coltz et al. 1999; Liu et al. 2003; Greger et al. 2004; Roitman et al. 2005). To test if the direction of movement contributed to the simple spike firing, we also computed the cross correlation between the firing and the velocity projected onto different axes. The target velocity was subtracted from the hand velocity prior to calculating the cross-correlograms to remove the overall target movement that was common to all trials. Therefore, this velocity component (VC) variable represents the variation in the directional component of the hand velocity in a single tracking trial. The cross-correlations were computed between the instantaneous firing and the velocity component for each of the 18 axes (0–170° in 10° increments). The axis resulting in the largest amplitude contrast (maximal difference between minimum and maximum correlation) was selected for each cell, in essence a cell-specific axis of the directional sensitivity of the speed.
The correlations between the neural discharge and two previously studied error signals, modified speed error (MSE) and direction error (DE) were also examined (Roitman et al. 2004). These error signals were selected as both were shown to be highly coupled with submovements. The error signals were defined as follows:
| (1) |
where r is the position vector, v the velocity vector, t′ the unit vector in the desired direction: t′ = (cos φ, sin φ), and subscripts t and h denote the parameters of the target and hand, respectively. Current direction of hand movement is denoted by θ = ∠vh, and desired direction of motion to intercept the target during time τ (0, 100, and 200 ms were tested) is denoted by φ = ∠[(rt − rh) + τvt]. Note that for τ = 0, DE is the instantaneous direction of the hand movement relative to the target movement.
The analyses were designed to provide a rigorous test of the presence of significant, reproducible correlations between the continuous simple spike firing rate and kinematic and/or error signals. Cross-correlations were computed for the Track period of each single trial using lags from −500 to 500 ms in 5 ms increments. The cross-correlation profiles for trials with identical task parameters (start angle, direction, and speed) did not differ significantly (see “Results”) and therefore were averaged, producing one cross-correlation profile for each task condition (Fig. 2a). The amplitudes and times of occurrence of the extrema (both maximum and minimum) of the average cross-correlations were determined and analyzed for any differences across task conditions. First, we tested for differences in the times of the extrema as a function of direction, start angle, and speed with analyses of variance (ANOVA) at the cell population level using a within cell repeated measures design (α = 0.05). Second, a separate ANOVA was used to test for differences in the amplitude of the correlations as a function of direction and start angle (within cell repeated measures design, α = 0.05). Because there were no differences in any of the four measures as a function of tracking direction or start angle (see “Results”), the correlograms were averaged across tracking directions and start angles, producing one cross-correlogram for each target speed (Fig. 2e).
Fig. 2.

a Individual (gray) and average (black) firing-speed correlograms of ten single trials (CW, target speed 5.7 cm/s, start angle: 270°). b Shuffled cross-correlograms where the firing from each of the trials in a was cross-correlated with the speed of another trial from the same ten repetitions. Average cross-correlograms for each start angle (different colors) for CCW (c) and CW (d) tracking directions. Each trace is the average of ten repetitions as seen in a. Traces of the same color are different tracking speeds. e Average cross-correlograms for each target speed (different colors). Each trace is the average of all (n = 80) single trials at that target speed. f Average shuffled cross-correlograms obtained the same way as in e
The next step was to determine whether these peaks in the average correlation for each target were significant. The chance of obtaining larger correlations increases with a decreasing number of data points (Fisher 1990). Higher speed trials have fewer data points and induce a systematic increase in the absolute values of the peak cross-correlations. Therefore, to test for differences in the amplitude as a function of speed the correlation coefficients were first Fisher-transformed to obey Gaussian statistics:
| (2) |
where r is the raw correlation coefficient. Then the cross-correlation amplitudes for each pair of target speeds were compared using the z-statistic:
| (3) |
separately for maximum and minimum values. In this equation, n1 and n2 are the number of data points contributing to the Fisher-transformed correlation values and .
To test for a significant correlation, a shuffling procedure was performed by cross-correlating the firing from one trial to the speed signal from a randomly chosen trial of the same task condition (Brody 1998). The shuffled cross-correlograms were averaged in the same way as the real (matching) correlograms (Fig. 2b, f). The shuffling procedure was repeated 100 times, each time pairing the firing from one trial to the other signal (speed, velocity component, or error signals) of a randomly chosen trial with identical task conditions. A z test was used to examine whether the maximum of the absolute value of the average cross-correlograms for each speed of the matching correlations was significantly higher than those obtained from the 100 shuffled correlations (α = 0.05). Only cells for which the shuffle test was significant for at least two target speeds are included in the study and only the data at significant speeds are reported in the population statistics.
The final step was to determine the amplitude and onset of any significant correlation with speed, velocity component or the motor errors. The onset (i.e., lead/lag) for any significant maximum or minimum was defined as the time prior to the peak, at which the amplitude of the correlation significantly exceeded the distribution of the shuffled correlations (z test, α = 0.05). Specifically, for each point in the cross-correlation profile, the value of the actual (matching) correlation was tested against the 100 shuffled correlation values to determine whether the actual correlation value was significantly larger than chance. The onset of a significant correlation, defined as the time when the correlation first exceeded this threshold value prior to the peak latency, was selected as the lead/lag for that peak. We are interested in only physiologically relevant lags and therefore, retained a correlation only if the lead/lag was in the ±250 ms range.
For each of the four parameters (speed, VC, MSE and DE) we determined the population of cells for which at least one of the peaks (minimum or maximum) reached significance and the timing was in the 250 ms range. On average across these four parameters, in 65% of the cells in each population, only one peak was significant. For cells with two significant peaks, we elected to further analyze and present only the larger of the two peaks. These secondary peaks did not yield consistent results, as they were fewer in number and their amplitudes were, on average, 27% smaller than the first peak.
Results
The simple spike discharge of 126 Purkinje cells were recorded (69 from monkey H, 19 from M, and 38 from P). Example movement paths, speed profiles, and instantaneous simple spike firing rates of five single trials (gray traces) with their averages (black traces) are shown in Fig. 1b–d. Both the average position and average speed of the hand closely match those of the target whereas the single trial speed profiles show peaks and valleys that have been previously used to identify the submovements (Roitman et al. 2004). Also evident is the increased variability of the single trial discharge rate compared to the averaged firing, similar to the kinematics.
Firing-speed correlations
The example cell shown in Fig. 2 illustrates the steps to test for a significant correlation and whether the correlation is consistent across task parameters. First, the cross-correlations between the simple spike firing and speed for trials with identical task parameters were generated (n = 10, Fig. 2a, grey traces) and then averaged (Fig. 2a, black trace). Both the correlograms from the individual trials and their average showed a consistent profile. In contrast, the shuffled cross-correlograms for the same trials did not show a consistent profile and the average is flat (Fig. 2b).
Next, the average correlograms for each task condition were computed and were found to be similar (Fig. 2c, d). Tracking direction and start angle were not significant factors for any of the four measures (minimum and maximum values and their lags) across the cell population (separate ANOVAs as explained in “Materials and methods”, P > 0.05). Therefore, the cross-correlograms obtained from different tracking directions and start angles were averaged, yielding one cross-correlogram per target speed. As shown in Fig. 2e, for example, these averaged cross-correlograms were highly consistent across target speeds, showing an increase in the simple spike firing 215 ms before an increase in the speed, followed by a decrease 39 ms after the increase in the speed. The absolute value of the maximum correlation was larger than the absolute value of the minimum correlation; therefore, only the maximum correlation for this cell is reported in the population analysis (see “Materials and methods”). There were no differences in the amplitudes of the maximum correlation as a function of speed (pair-wise z test of the Fisher-transformed correlations, P > 0.05 for all pairs of speeds). The average cross-correlograms obtained from one of the 100 shuffles for this cell (Fig. 2f) showed lack of consistency across speeds and markedly smaller amplitudes than the real correlations (Fig. 2e). Furthermore, the maximum of the absolute value of the average cross-correlograms for each speed of the real correlations (Fig. 2e) was significantly higher than those obtained from the 100 shuffled correlations (z test, P < 0.05 for all speeds).
Cross-correlograms for two additional example Purkinje cells illustrate the coupling between the variations in the simple spike firing and those in the speed profile (Fig. 3a, b). For the cell in Fig. 3a, the absolute value of the minimum correlation was the largest of the extrema, and the simple spike firing decreased prior to an increase in speed (onset lag of minimum −121 ms). The Purkinje cell in Fig. 3b exhibited the opposite profile, increasing firing before an increase in speed (onset lag of maximum −217 ms). For both Purkinje cells, the time course of the cross-correlograms and the amplitudes and lags of the selected extrema were similar across target speeds (ANOVA, P > 0.05).
Fig. 3.

Firing-speed (a, b), firing-MSE (c–d), and firing-DE (e–f) cross-correlograms for two example Purkinje cells
Across the population, 46/126 cells (37%) passed all the tests required for the firing-speed correlations. There were no significant differences in either amplitudes or lags of the maximum/minimum correlation as a function of speed for any of the cells. The average amplitudes of the maximum and minimum correlations were not significantly different (Fig. 5a, maximum 0.07 ± 0.03, minimum −0.06 ± 0.02; all values are mean ± SD, unless noted otherwise). This is not unexpected because both increases and decreases in firing signal movement information. The average of the maximum absolute values of the peak correlation was 0.06 ± 0.02. The distribution of leads and lags corresponding to the onset of a significant correlation (Fig. 5b) revealed that the simple spike discharge in 35/46 (76%) of cells led the speed with an average lag of −62 ± 110 ms (significantly smaller than zero, one-tailed Student’s t test, P < 0.05).
Fig. 5.
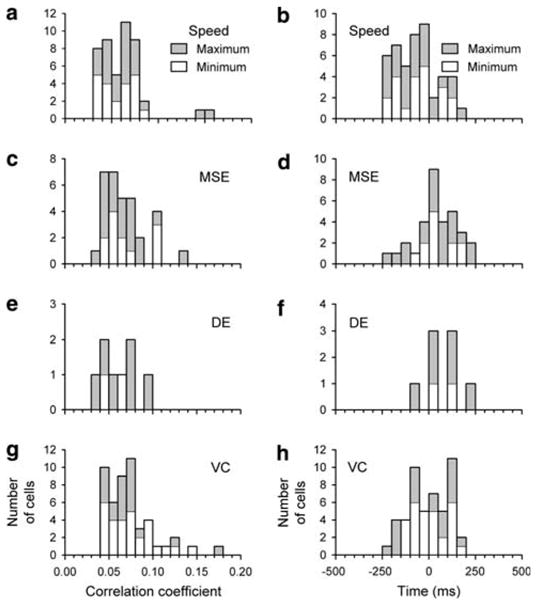
Population distributions of the absolute maximum/minimum correlations (left side) and their leads/lags (right side) a, b firing-speed, c, d firing-MSE, e, f: firing-DE and g, h firing-velocity component (VC). Whether the value was based on a maximum (filled bars) or minimum peak in correlation (open bars) is indicated
Firing-velocity component correlations
The correlations between the firing and the hand velocity projected onto different directional axes were also computed to determine the directional sensitivity. As for the correlations with speed, tracking direction and start angle were not a significant factor for any of the four measures (minimum and maximum values and their lags) across the cell population (separate ANOVAs as explained in “Materials and methods”, P > 0.05). Therefore, the cross-correlograms obtained from different tracking directions and start angles were averaged, yielding one cross-correlogram per target speed, for each projection axis. Figure 4a shows the correlograms for 18 different axes (black traces) taken at each target speed for an example Purkinje cell. The red traces correspond to the axis (170°) that produced correlation with the largest contrast (maximum to minimum) and show that the preferred axis was the same for each tracking speed. Therefore, this example cell had a directional preference with the firing best coupled to the component of submovements along the 170° axis.
Fig. 4.

a Cross-correlation between firing and velocity component along 18 different axes (black traces) at the indicated tracking speeds for an example Purkinje cell. The best axis (largest maximum–minimum difference) is shown as a bold red line, and the 0° and 90° axes are shown in magenta and orange, respectively. b Distribution of best axes across the population of Purkinje cells with a significant velocity component correlation
The instantaneous firing rate of 49/126 cells (39%) was significantly coupled to the velocity component. Across this population of cells, there were no significant differences between target speeds in either lags/leads or amplitudes of maximum/minimum correlation. The average of the maximum absolute value of the correlation amplitude was 0.07 ± 0.03 (Fig. 5g). The distribution of the preferred axes for these cells was significantly different from uniform in the 0–180° interval (Rayleigh test, P < 0.05), indicating directional preference. The mean ± the angular dispersion was 85.3 ± 35.2° (Fig. 4b). In contrast to the firing-speed correlations, the lags between firing and velocity component were equally distributed around zero (Fig. 5h, mean lag not significantly different from zero; Student’s t test; P > 0.05).
Firing-error correlations
Cross-correlations between the Purkinje cell simple spike firing and the two error signals, MSE and DE were also computed. Again, neither the extrema values nor their latencies depended on either start angle or the direction of tracking (ANOVA, P > 0.05); therefore, the cross-correlations were averaged across directions and start angles.
The instantaneous simple spike firing was significantly coupled to MSE and DE in 32/126 cells (25%) and 8/126 cells (6%), respectively. As for the speed and velocity component, the selection criteria required that the cells pass the shuffle test for at least two target speeds. Overall, in 37 of 126 cells (29%) the simple spike firing was coupled to either error signal. In three cells the simple spike firing was coupled to both error signals. As shown for the example Purkinje cell in Fig. 3c and e, the simple spike firing decreased following an increase in MSE (Fig. 3c, lag of minimum 50 ms), and the firing also decreased following an increase in DE (Fig. 3e, lag of minimum 135 ms). For the second Purkinje cell the simple spike firing increased following the increase in MSE (Fig. 3d, lag of maximum 43 ms). For this cell, the firing-DE correlation did not reach significance. For both Purkinje cells, the profile of the cross-correlograms (leads/lags and amplitudes) were consistent across target speeds for each error signal.
Across the population, there were no significant differences between target speeds in either the lags/leads or amplitude of the minimum or maximum correlations for the two error signals. There were no significant differences in the minimum/maximum correlations as a function of speed for firing-DE correlation. The average of the maximum absolute value of the correlation amplitude was 0.07 ± 0.02 (Fig. 5c) and 0.06 ± 0.02 (Fig. 5e) for the firing-MSE and firing-DE correlations, respectively.
In contrast to the largely negative distribution of firing-speed correlations and equal distribution of leads and lags for the firing-velocity component correlations, the simple spike firing lagged the motor errors. The firing lagged the MSE signal in 23/32 (72%) of cells (Fig. 5d) and the average lag was 43 ± 111 ms (significantly larger than zero, one-tailed Student’s t test, P < 0.05). The firing also lagged DE in 7/8 (88%) of cells and the average lag of 76 ± 98 ms was significantly larger than zero (Fig. 5f; one-tailed Student’s t test, P < 0.05).
The distribution of leads/lags between firing and the speed, velocity component, and the error signals were significantly different from each other (ANOVA, P < 0.05). A post hoc, multiple comparison analysis (separate ANOVAs for each pair of parameters) showed that the distribution of firing-speed leads/lags was different from the other three distributions and the distributions of the two error signals were not significantly different from each other.
The constant τ (Eq. 1) has the dimension of time and stands for the interval in which the control system makes the simple linear prediction about the future target movement. Consistent with the values used in previous studies (Engel and Soechting 2000; Roitman et al. 2004), the results above are based on τ = 100 ms. We also tested τ = 0 and τ = 200 ms. The resulting firing-error correlations showed only subtle qualitative changes with respect to variations in τ (data not shown), consistent with the previous behavioral results (Roitman et al. 2004). Importantly, different τ values did not shift the leads/lags of extrema of average cross-correlograms: the lags for either MSE or DE correlations did not significantly differ between the tested τ values (ANOVA, P > 0.05). This demonstrates that the leads and lags of the cross-correlation extrema are not a function of τ, but instead reflect the temporal coupling between the neural discharge and the errors.
Overlap in correlations and spatial distribution
The Venn diagram in Fig. 6 summarizes the numbers of cells with significant correlations for the kinematic and error signals studied, as well as their respective overlaps. The single-trial variations in firing were significantly correlated with one of the signals in 75 cells (56%). For Purkinje cells with significant correlations to at least one variable, 56% (42/75) had significant correlations with more than one variable. The two largest groups of cells had correlations with speed (46 cells, 37%) and the velocity component (49 cells, 39%). The overlap in these two groups consisted of 26 cells. This reflects that the firing in some Purkinje cells were directional, while others responded in all directions.
Fig. 6.
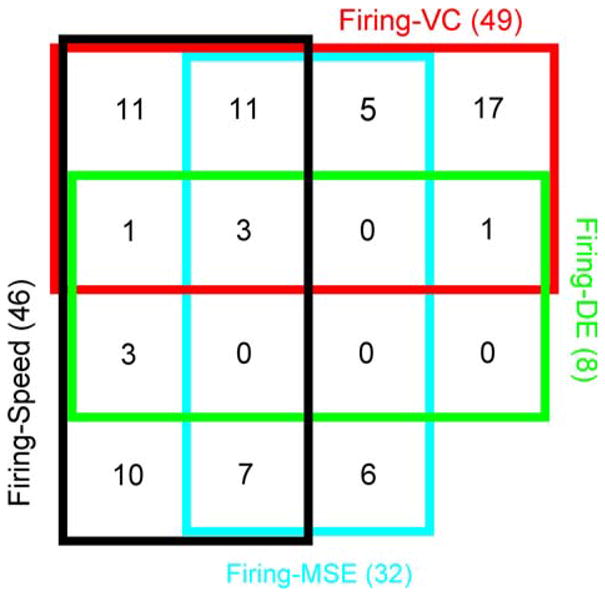
Venn diagram showing the summary of significant correlations between firing and four variables for the population of Purkinje cells
In 37 cells there were significant correlations to either MSE or DE, and in three cells there were significant correlations to both error signals. These three cells also had significant correlations with speed and velocity component signals. While this small number of cells showed significant correlations with all signals, the majority of cells were significantly correlated with only a subset of the measures investigated. This suggests that the potential control mechanism for monitoring errors and generating corrective movements occurs to a great degree at the population level.
Finally, we assessed if there was any spatial organization to the correlations relative to the location of the Purkinje cells. Separate ANOVAs were performed on the medio-lateral and antero-posterior coordinates of the recording locations with significant correlations for each of the four parameters. There were no significant differences (P > 0.05) and hence no evidence of clustering or spatial segregation of the encoded signals. However, that conclusion has to be tempered by the fact that the analysis was based only on the anterior–posterior and medial–lateral recording positions relative to the chamber and cerebellar surface and not a rigorous, three dimensional reconstruction of recording sites.
Discussion
The major findings of this study are the prominent and consistent cross-correlations between Purkinje cell simple spike firing and hand speed, velocity component, and the motor error signals. The results were based on analyzing single trial data, in contrast with the traditional approach of analyzing the firing and behavioral data averaged across trials (Mano and Yamamoto 1980; Marple-Horvat and Stein 1987; Fortier et al. 1989; Fu et al. 1997; Coltz et al. 1999; Liu et al. 2003; Roitman et al. 2005). Also, most previous studies related the average firing to behavioral measures in time epochs. We applied stringent criteria to ensure that the correlations were not spurious. Neither starting position nor direction of movement affected the amplitude or times of the extrema values. Furthermore, the correlograms were not sensitive to tracking speed. The cross-correlations between firing with the velocity component and with the direction and speed errors were equally robust. Therefore, the couplings are invariant of trial-specific parameters.
The correlations between the simple spike firing and the variations in tracking speed confirm and extend previous findings that Purkinje cells are modulated by speed (Mano and Yamamoto 1980; Marple-Horvat and Stein 1987; Coltz et al. 1999; Roitman et al. 2005). Tracking speed acts as a gain factor for the spatial tuning profile (i.e., position and directional tuning) of the simple spike discharge (Roitman et al. 2005). The present cross-correlation results confirm that the simple spike coupling to speed holds across the range of different hand positions and movement directions.
To determine if the correlations observed with speed possessed a directional component, the cross-correlations between the simple spike firing and the velocity component were computed. The velocity by itself is inherently directional, representing both the magnitude and direction of speed. Compared with the other parameters tested, the largest number of Purkinje cells exhibited a significant correlation with the velocity component and the magnitude of the correlation was dependent on the projection axes. These findings demonstrate that the directionality of the fluctuations in speed is an important determinant of the simple spike firing, confirming and extending the previous findings that movement direction is encoded in the discharge of Purkinje cells (Fortier et al. 1989; Fu et al. 1997; Coltz et al. 1999; Greger et al. 2004; Roitman et al. 2005). The velocity component has characteristics of both speed and error (the target speed was subtracted from it, see “Materials and methods”), and, therefore, it is not unexpected that the firing-velocity leads/lags (Fig. 5h) were equally distributed around zero, unlike the largely negative lags for firing-speed and largely positive lags for firing-error correlations.
The distribution of the best directional axes was not uniform with the majority of cells preferring a center-out axis as shown previously (Fortier et al. 1989; Fu et al. 1997; Coltz et al. 1999; Johnson and Ebner 2000). The reason for this lack of uniformity has not been fully resolved. The potential for sampling errors has not been excluded. Although the Purkinje cells in this study were recorded throughout both intermediate and more lateral zones surrounding the primary fissure (see Roitman et al. 2005), one cannot dismiss the possibility that Purkinje cells in other regions of the cerebellar cortex are tuned to other directions of movements. However, a number of findings suggest that the non-uniform distribution of perferred directions is not due to sampling limitations. Neurons of the dorsal spinocerebellar tract (Bosco and Poppele 1997) and the primary sensory cortex (Cohen et al. 1994) both have preferred directional tuning in the anterior–posterior axes and both provide input to the cerebellar cortex. A nonuniform distribution of preferred directions exists in the vestibulo-cerebellum and has been hypothesized to correspond to the afferent axes of the semicircular canals and/or effector axes of the extraocular muscles (Gomi et al. 1998; Graf et al. 1988; Stone and Lisberger 1990). Therefore, one possibility is that the preferred tuning represents a type of intrinsic coordinate system for the control of arm movements (Johnson and Ebner 2000).
One theory of the cerebellum’s role in movements is to detect and correct for errors. Psychophysical and imaging studies provide support for this concept (Maschke et al. 2004; Diedrichsen et al. 2005; Smith and Shadmehr 2005). At the single cell level, complex spike discharge in Purkinje cells has been linked to motor errors (Gilbert and Thach 1977; Ojakangas and Ebner 1994; Kitazawa et al. 1998; Norris et al. 2004). Although simple spike discharge signals movement kinematics (Fortier et al. 1989; Fu et al. 1997; Coltz et al. 1999; Roitman et al. 2005; Pasalar et al. 2006), direct evidence that the simple spike discharge is correlated with specific errors during limb movments is limited. The firing-error cross-correlations show that simple spike discharge is coupled to both speed and direction error as well as the velocity component. Furthermore, for the majority of Purkinje cells the errors lead the discharge, consistent with these cells primarily monitoring errors.
For the Purkinje cells with significant correlations of their simple spike discharge to one of the four variables investigated, the majority were correlated with at least two variables. It needs to be acknowledged that these performance and error measures are not strictly independent. For example, the velocity component and MSE are functions of the direction of movement and the deviation of the hand velocity from the target velocity. Similarly, MSE and DE can co-vary depending on tracking performance. Therefore, the correlations with more than one variable could reflect, to some degree, this lack of independence. However, the overlaps in the correlations were far from complete, demonstrating that Purkinje cells are differentially tuned to these four variables.
Implications for submovements
The trial-by-trial correlations between simple spike firing and speed and the motor errors suggest a role for the cerebellum in the control of submovments. Psychophysical observations led to the hypothesis that submovements are produced by monitoring errors and are generated when the errors reach a threshold (Roitman et al. 2004). For 76% of the Purkinje cells the onset of the significant correlations leads the hand speed suggesting that the simple spike discharge in these cells is involved in a feedforward manner consistent with the generation of submovements. Also, for the majority of cells the simple spike firing lagged the motor errors. These error signals have been shown to be involved in the submovements occuring during tracking (Roitman et al. 2004; Pasalar et al. 2005). Therefore, Purkinje cells are likely involved in both the production of submovements and the error detection process that underlies submovement generation.
What about individual Purkinje cells? Of the 37 cells coupled to MSE or DE, 25 were also coupled to speed. To assess the timing between the error and speed signals for individual cells, we first reversed the order of the correlations to evaluate the lags for motor error to firing and speed to firing (i.e., simply by multiplying the leads and lags by −1). We only considered the peak absolute correlation for each cross-correlogram. For 10 of the 25 cells (40%), the maximum correlation with error led the firing by at least 50 ms, while the maximum correlation with speed lagged the firing by at least 50 ms. Therefore, for this small group of cells the firing increased in response to errors and, in turn, the increased firing was followed by submovements. A similar analysis of the 26 cells coupled to both speed and velocity component reveals that in seven cells (27%) the firing increased in response to velocity component change and, in turn, the increased firing was followed by submovements. While these correlations cannot prove causality, the timing of the correlations, both at the population level and for a fewer number of individual cells, is consistent with errors resulting in changes in Purkinje cell activity, which in turn results in the generation of a submovement.
Although this study analyzed fluctuations in speed profile and their relation to the firing fluctuations over single trials, no attempt was made to explicitly identify the submovements. Various algorithms of submovement identification have been used in the past, including minimum jerk profiles (Flash and Hogan 1985; Lee et al. 1997), individually fitted velocity profiles (Milner 1992), or more recently developed globally optimized algorithms (Rohrer and Hogan 2006). However, these algorithms extracted submovements from the point-to-point reaching movements. Unlike reaching, the present manual tracking task is characterized by constantly sustained hand velocity. As such, it is difficult to use the previous algorithms to detect submovements. However, the single-trial correlation analysis is an indirect way of analyzing submovements, because such analysis essentially establishes the coupling over the large number of the speed and firing fluctuations. The presented correlation profiles can be viewed as an average firing behavior centered over the average speed fluctuation.
In our previous study, we found that the properties of submovements did not vary across directions and start angles of tracking (Roitman et al. 2004). The previous results were obtained from the same monkeys used in this study and performing the identical task. However, submovements do change systematically with target speed, increasing in amplitude as the speed increases (Roitman et al. 2004; Pasalar et al. 2005). The correlations between Purkinje cell firing and speed, the velocity component or the error measures also did not change with tracking directions, start angles or tracking speed. The invariance of the correlations with respect to target speed is not in contradiction with submovement amplitude being a function of speed. Correlations reflect the degree of coupling between the firing and variations in speed. Therefore, a change in amplitude in one signal (or both) will not necessarily affect the measure of that coupling. The present results indicate that, even though submovement amplitude increases with speed, the coupling between the Purkinje cell and submovements remains constant. These invariant features are consistent with Purkinje cell firing providing a stereotypical signal in relation to submovements and errors coupled to submovements, compatible with the concept that submovements are a motor primitive (Bizzi et al. 1991; D’Avella et al. 2003; Flash and Hochner 2005).
In conclusion, these findings provide a neural correlate of the previous psychophysical results suggesting the existence of an error correction system that continuously monitors the errors and generates intermittent corrections to the ongoing speed (Roitman et al. 2004). Specifically, the cerebellar Purkinje cells appear to be a part of such an error detection and correction system.
Acknowledgments
We wish to thank M. McPhee for assistance with graphics and S. Allison for assistance with programming. This work was supported by a National Institutes of Health Grant 5R01-NS-18338.
References
- Bastian AJ. Learning to predict the future: the cerebellum adapts feedforward movement control. Curr Opin Neurobiol. 2006;16:645–649. doi: 10.1016/j.conb.2006.08.016. [DOI] [PubMed] [Google Scholar]
- Bizzi E, Mussa-Ivaldi FA, Giszter S. Computations underlying the execution of movement: a biological perspective. Science. 1991;253:287–291. doi: 10.1126/science.1857964. [DOI] [PubMed] [Google Scholar]
- Bosco G, Poppele RE. Representation of multiple kinematic parameters of the cat hindlimb in spinocerebellar activity. J Neurophysiol. 1997;78:1421–1432. doi: 10.1152/jn.1997.78.3.1421. [DOI] [PubMed] [Google Scholar]
- Brody C. Spike covariations in neuronal resting potentials can lead to artefactually fast cross-correlations in their spike trains. J Neurophysiol. 1998;80:3345–3351. doi: 10.1152/jn.1998.80.6.3345. [DOI] [PubMed] [Google Scholar]
- Cohen DA, Prud’homme MJ, Kalaska JF. Tactile activity in primate primary somatosensory cortex during active arm movements: correlation with receptive field properties. J Neurophysiol. 1994;71:161–171. doi: 10.1152/jn.1994.71.1.161. [DOI] [PubMed] [Google Scholar]
- Coltz JD, Johnson MTV, Ebner TJ. Cerebellar Purkinje cell simple spike discharge encodes movement velocity in primates during visuomotor arm tracking. J Neurosci. 1999;19:1782–1803. doi: 10.1523/JNEUROSCI.19-05-01782.1999. [DOI] [PMC free article] [PubMed] [Google Scholar]
- D’Avella A, Saltiel P, Bizzi E. Combinations of muscle synergies in the construction of a natural motor behavior. Nat Neurosci. 2003;6:300–308. doi: 10.1038/nn1010. [DOI] [PubMed] [Google Scholar]
- Diedrichsen J, Hashambhoy Y, Rane T, Shadmehr R. Neural correlates of reach errors. J Neurosci. 2005;25:9919–9931. doi: 10.1523/JNEUROSCI.1874-05.2005. [DOI] [PMC free article] [PubMed] [Google Scholar]
- Doeringer JA, Hogan N. Intermittency in preplanned elbow movements persists in the absence of visual feedback. J Neurosci. 1998;80:1787–1799. doi: 10.1152/jn.1998.80.4.1787. [DOI] [PubMed] [Google Scholar]
- Engel KC, Soechting JF. Manual tracking in two dimensions. J Neurophysiol. 2000;83:3483–3496. doi: 10.1152/jn.2000.83.6.3483. [DOI] [PubMed] [Google Scholar]
- Fisher RA. In: Statistical methods, experimental design, and scientific inference. Yates F, Bennet JH, editors. New York: Oxford; 1990. [Google Scholar]
- Flash T, Hochner B. Motor primitives in vertebrates and invertebrates. Curr Opin Neurobiol. 2005;15:660–666. doi: 10.1016/j.conb.2005.10.011. [DOI] [PubMed] [Google Scholar]
- Flash T, Hogan N. The coordination of arm movements: an experimentally confirmed mathematical model. J Neurosci. 1985:1688–1703. doi: 10.1523/JNEUROSCI.05-07-01688.1985. [DOI] [PMC free article] [PubMed] [Google Scholar]
- Fortier P, Kalaska J, Smith A. Cerebellar neuronal activity related to whole-arm reaching movements in the monkey. J Neurophysiol. 1989;62:198–210. doi: 10.1152/jn.1989.62.1.198. [DOI] [PubMed] [Google Scholar]
- Fu QG, Flament D, Coltz JD, Ebner TJ. Relationship of cerebellar Purkinje cell simple spike discharge to movement kinematics in the monkey. J Neurophysiol. 1997;78:478–491. doi: 10.1152/jn.1997.78.1.478. [DOI] [PubMed] [Google Scholar]
- Gilbert PF, Thach WT. Purkinje cell activity during motor learning. Brain Res. 1977;128:309–328. doi: 10.1016/0006-8993(77)90997-0. [DOI] [PubMed] [Google Scholar]
- Gomi H, Shidara M, Takemura A, Inoue Y, Kawano K, Kawato M. Temporal firing patterns of Purkinje cells in the cerebellar ventral paraflocculus during ocular following responses in monkeys I. Simple spikes. J Neurophysiol. 1998;80:818–831. doi: 10.1152/jn.1998.80.2.818. [DOI] [PubMed] [Google Scholar]
- Graf W, Simpson JI, Leonard CS. Spatial organization of visual messages of the rabbit’s cerebellar flocculus. II. Complex and simple spike responses of Purkinje cells. J Neurophysiol. 1988;60:2091–2121. doi: 10.1152/jn.1988.60.6.2091. [DOI] [PubMed] [Google Scholar]
- Greger B, Norris SA, Thach WT. Spike firing in the lateral cerebellar cortex correlated with movement and motor parameters irrespective of the effector limb. J Neurophysiol. 2004;91:576–582. doi: 10.1152/jn.00535.2003. [DOI] [PubMed] [Google Scholar]
- Johnson MT, Ebner TJ. Processing of multiple kinematic signals in the cerebellum and motor cortices. Brain Res Rev. 2000;33:155–168. doi: 10.1016/s0165-0173(00)00027-8. [DOI] [PubMed] [Google Scholar]
- Kitazawa S, Kimura T, Yin PB. Cerebellar complex spikes encode both destinations and errors in arm movements. Nature. 1998;392:494–497. doi: 10.1038/33141. [DOI] [PubMed] [Google Scholar]
- Lee D, Port NL, Georgopoulos AP. Manual interception of moving targets II. On-line control of overlapping submovements. Exp Brain Res. 1997;116:421–433. doi: 10.1007/pl00005770. [DOI] [PubMed] [Google Scholar]
- Liu X, Robertson E, Miall RC. Neuronal activity related to the visual representation of arm movements in the lateral cerebellar cortex. J Neurophysiol. 2003;89:1223–1237. doi: 10.1152/jn.00817.2002. [DOI] [PubMed] [Google Scholar]
- Mano N, Yamamoto K. Simple-spike activity of cerebellar Purkinje cells related to visually guided wrist tracking movement in the monkey. J Neurophysiol. 1980;43:713–772. doi: 10.1152/jn.1980.43.3.713. [DOI] [PubMed] [Google Scholar]
- Marple-Horvat DE, Stein JF. Cerebellar neuronal activity related to arm movements in trained rhesus monkeys. J Physiol. 1987;394:351–366. doi: 10.1113/jphysiol.1987.sp016874. [DOI] [PMC free article] [PubMed] [Google Scholar]
- Maschke M, Gomez CM, Ebner TJ, Konczak J. Hereditary cerebellar ataxia progressively impairs force adaptation during goal-directed arm movements. J Neurophysiol. 2004;91:230–238. doi: 10.1152/jn.00557.2003. [DOI] [PubMed] [Google Scholar]
- Medina JF, Lisberger SG. Variation, signal, and noise in cerebellar sensory-motor processing for smooth-pursuit eye movements. J Neurosci. 2007;27:6832–6842. doi: 10.1523/JNEUROSCI.1323-07.2007. [DOI] [PMC free article] [PubMed] [Google Scholar]
- Miall RC, Weir DJ, Stein J. Manual tracking of visual targets by trained monkeys. Behav Brain Res. 1986;20:185–201. doi: 10.1016/0166-4328(86)90003-3. [DOI] [PubMed] [Google Scholar]
- Miall RC, Weir DJ, Wolpert DM, Stein JF. Is the cerebellum a Smith predictor? J Mot Behav. 1993;25:203–216. doi: 10.1080/00222895.1993.9942050. [DOI] [PubMed] [Google Scholar]
- Milner TE. A model for the generation of movements requiring endpoint precision. Neuroscience. 1992;49:487–496. doi: 10.1016/0306-4522(92)90113-g. [DOI] [PubMed] [Google Scholar]
- Milner TE, Ijaz MM. The effect of accuracy constraints on three-dimensional movement kinematics. Neuroscience. 1990;35:365–374. doi: 10.1016/0306-4522(90)90090-q. [DOI] [PubMed] [Google Scholar]
- Morton SM, Bastian AJ. Cerebellar contributions to locomotor adaptations during splitbelt treadmill walking. J Neurosci. 2006;26:9107–9116. doi: 10.1523/JNEUROSCI.2622-06.2006. [DOI] [PMC free article] [PubMed] [Google Scholar]
- Norris SA, Greger B, Hathaway EN, Thach WT. Purkinje cell spike firing in the posterolateral cerebellum: correlation with visual stimulus, oculomotor response, and error feedback. J Neurophysiol. 2004;92:1867–1879. doi: 10.1152/jn.01251.2003. [DOI] [PubMed] [Google Scholar]
- Novak KE, Miller LE, Houk JC. Kinematic properties of rapid hand movements in a knob turning task. Exp Brain Res. 2000;132:419–433. doi: 10.1007/s002210000366. [DOI] [PubMed] [Google Scholar]
- Ojakangas C, Ebner TJ. Purkinje cell complex spike activity during voluntary motor learning: relationship to kinematics. J Neurophysiol. 1994;72:2617–2630. doi: 10.1152/jn.1994.72.6.2617. [DOI] [PubMed] [Google Scholar]
- Oscarsson O. Functional organization of olivary projection to the cerebellar anterior lobe. In: Courville J, editor. The inferior olivary nucleus: anatomy and physiology. Raven; New York: 1980. pp. 279–290. [Google Scholar]
- Pasalar S, Roitman AV, Ebner TJ. Effects of speeds and force fields on submovements during circular manual tracking in humans. Exp Brain Res. 2005;163:214–225. doi: 10.1007/s00221-004-2169-6. [DOI] [PubMed] [Google Scholar]
- Pasalar S, Roitman AV, Durfee WK, Ebner TJ. Force field effects on cerebellar Purkinje cell discharge with implications for internal models. Nat Neurosci. 2006;9:1404–1411. doi: 10.1038/nn1783. [DOI] [PubMed] [Google Scholar]
- Rohrer B, Hogan N. Avoiding spurious submovement decompositions II: a scattershot algorithm. Biol Cybern. 2006;94:409–414. doi: 10.1007/s00422-006-0055-y. [DOI] [PubMed] [Google Scholar]
- Roitman AV, Massaquoi SG, Takahashi K, Ebner TJ. Kinematic analysis of manual tracking in monkeys: characterization of movement intermittencies during a circular tracking task. J Neurophysiol. 2004;91:901–911. doi: 10.1152/jn.00261.2003. [DOI] [PubMed] [Google Scholar]
- Roitman AV, Pasalar S, Ebner TJ. Position, direction of movement, and speed tuning of cerebellar Purkinje cells during circular manual tracking in monkey. J Neurosci. 2005;25:9244–9257. doi: 10.1523/JNEUROSCI.1886-05.2005. [DOI] [PMC free article] [PubMed] [Google Scholar]
- Smith MA, Shadmehr R. Intact ability to learn internal models of arm dynamics in Huntington’s disease but not cerebellar degeneration. J Neurophysiol. 2005;93:2809–2821. doi: 10.1152/jn.00943.2004. [DOI] [PubMed] [Google Scholar]
- Stone LS, Lisberger SG. Visual responses of Purkinje cells in the cerebellar flocculus during smooth-pursuit eye movements in monkeys I. Simple spikes. J Neurophysiol. 1990;63:1241–1261. doi: 10.1152/jn.1990.63.5.1241. [DOI] [PubMed] [Google Scholar]
- Taira M, Boline J, Smyrnis N, Georgopoulos AP, Ashe J. On the relations between single cell activity in the motor cortex and the direction and magnitude of three-dimensional static isometric force. Exp Brain Res. 1996;109:367–376. doi: 10.1007/BF00229620. [DOI] [PubMed] [Google Scholar]
- Thach W. Discharge of Purkinje and cerebellar nuclear neurons during rapidly alternating arm movements in the monkey. J Neurophysiol. 1968;31:785–797. doi: 10.1152/jn.1968.31.5.785. [DOI] [PubMed] [Google Scholar]
- Tseng YW, Diedrichsen J, Krakauer JW, Shadmehr R, Bastian AJ. Sensory prediction errors drive cerebellum-dependent adaptation of reaching. J Neurophysiol. 2007;98:54–62. doi: 10.1152/jn.00266.2007. [DOI] [PubMed] [Google Scholar]
- Vallbo AB, Wessberg J. Organization of motor output in slow finger movement in man. J Physiol. 1993;469:673–691. doi: 10.1113/jphysiol.1993.sp019837. [DOI] [PMC free article] [PubMed] [Google Scholar]
- Wolpert DM, Miall RC, Kawato M. Internal models in the cerebellum. Trends Cogn Sci. 1998;2:338–347. doi: 10.1016/s1364-6613(98)01221-2. [DOI] [PubMed] [Google Scholar]