Abstract
Actin polymerization time courses can exhibit rich, non-equilibrium dynamics that have not yet been accurately described by simplified rate equations. Sophisticated stochastic simulations and elaborate recursion schemes have been used to model the non-equilibrium dynamics resulting from the hydrolysis and subsequent exchange of the nucleotide bound within the actin molecules. In this work, we use a truncation approach to derive a set of readily-accessible, deterministic rate equations which are significantly simpler than previous attempts at such modeling. These equations may be incorporated into whole-cell motility models which otherwise quickly become computationally inaccessible if polymerization of individual actin filaments is stochastically simulated within a virtual cell. Our equations accurately predict the relative concentrations of both monomeric and polymerized actin in differing nucleotide hydrolysis states throughout entire polymerization time courses nucleated via seed filaments. We extend our model to include the effects of capping protein. We also detail how our rate-equation method may be used to extract key parameters from experimental data.
INTRODUCTION
Actin is a globular protein that can spontaneously polymerize into filaments that are an essential component of the cytoskeleton of eukaryotic cells [1]. The extent and rate of actin polymerization are regulated by a number of actin binding proteins that naturally occur in vivo [2]. Measurement of in vitro actin polymerization time courses is a useful tool for biologists and biochemists who study the effects of isolated actin binding proteins upon polymerization. These polymerization time courses are generally assayed by structure-dependent light scattering and turbidity measurements, or via fluorescence intensity of both intrinsic and artificially-bound fluorophores [3–6]. Inside each globular actin molecule, a nucleotide is bound [2]. This nucleotide may be found in the higher-free energy ATP state (adenosine triphosphate), the lower-free energy ADP state (adenosine diphosphate) or in at least one intermediate state [7–9]. The rates of monomer association with, and subunit dissociation from, existing filaments depend upon the hydrolysis state of the bound nucleotide [10]. Structural properties such as the persistence length of the actin filaments are affected by the bound nucleotide hydrolysis state as well [11]. The function of actin binding proteins can also be affected by the bound nucleotide hydrolysis state. For example, it has been shown that the filament severing protein cofilin binds with much greater affinity to a polymerized subunit binding nucleotide in the ADP hydrolysis state than to one binding nucleotide in the ATP hydrolysis state [12]. Furthermore, it has been shown that a popular fluorescence assay of actin polymerization—the pyrene assay—is strongly sensitive to the hydrolysis state of the bound nucleotide [9, 13]. It is thus crucial for researchers conducting in vitro actin polymerization experiments to know the relative concentrations of actin molecules binding nucleotide in time-varying hydrolysis states.
Actin filaments are helical and polar, having distinct plus- and minus-ends [1, 2]. Association and dissociation events at the “plus” end occur approximately ten times more frequently than events at the “minus” end1. In this work, we treat only the plus end although our presentation may be straightforwardly extended to include minus end effects.
In an equilibrium polymer [14], the binding affinities of monomers and subunits are constant over time. The net association of monomers occurs at a rate kon times the concentration of free monomers while dissociation of subunits from existing filaments occurs at a constant rate koff. The critical concentration Gc = koff/kon is the steady-state concentration of monomers where the net rates of monomer association and subunit dissociation are equal, thus leaving the total amount of polymer unchanged over time. Early measurements of actin polymerization time courses were performed such that the time to reach the critical concentration was much greater than the entire bound nucleotide hydrolysis time [3, 6]. Therefore, the actin likely was an equilibrium polymer (mainly in the bound ADP state) throughout most of the time course and the simple equilibrium model presented above will describe those polymerization time courses well. These are the type of monotonically increasing polymerization curves seen in textbook explanations of actin polymerization [1, 14–16]. However, under in vivo conditions, and in many in vitro studies, the bound nucleotide states are not in equilibrium.
In actin molecules, the bound nucleotide serves to stabilize the globular structure of the protein itself [1]. Therefore, as that nucleotide undergoes hydrolysis, the structure of the molecule changes, thus changing the binding affinity between molecules. Thus, the rates of monomer association and dissociation themselves depend upon the hydrolysis state of the bound nucleotide. Because these rates differ greatly between the ATP-bound state and the ADP-bound state, the critical concentration of ATP-bound actin is about 20-fold lower than that of ADP-bound actin [10]. In rapid nucleation experiments, it is possible to polymerize actin quickly enough that a transient steady state of polymerization determined the ATP-bound critical concentration is achieved, only to depolymerize until the ADP-bound critical concentration is ultimately reached [9]. Many polymerization experiments are conducted in the presence of excess ATP nucleotide in solution. This serves to exchange the lower-energy, ADP-bound nucleotides for higher-energy, ATP-bound nucleotides. Thus, there is a relatively constant influx of chemical energy that maintains a nonequilibrium state of polymerization above that of a purely ADP-bound state. The result is that the critical concentration is no longer simply a ratio of a single dissociation rate to a single association rate, but rather becomes a nucleotide concentration-weighted average of the differing rates for the bound nucleotide states which themselves change randomly throughout the polymerization time course2.
In the double-helical structure of actin filaments, each polymerized subunit is in direct contact with two neighboring subunits [1]. However, if one assumes that subunit dissociation is determined solely by the bound nucleotide within the subunit itself—i.e., independent of the nucleotides bound by its neighbors—then the filament may be modeled as a linear chain of successive subunits [5, 19]. The hydrolysis process within an actin subunit is an irreversible, two-step process [7]. First, ATP-bound actin hydrolyzes to an intermediate state in which inorganic phosphate remains bound to the nucleotide. Second, the bound phosphate is released, leaving the nucleotide in the ADP hydrolysis state. Thus, there are three nucleotide hydrolysis states, ATP, ADP + Pi and ADP, which we will denote later as T, Pi and D, respectively.
When an end subunit dissociates, an internal subunit is converted to an end subunit, and this process complicates the theoretical analysis. Consider, for example, the change in number of ADP + Pi tips with time. These tips may be “destroyed” by the release of inorganic phosphate or by covering them with new ATP-bound or ADP-bound subunits. However, they may also be destroyed by ADP + Pi-bound subunit dissociation provided that the subunit one position preceding the tip is in a different hydrolysis state from that of tip itself. Herein lies the crux of the problem: the net dissociation rate, and thus the critical concentration Gc, necessarily depends upon the hydrolysis state of the nucleotide bound within the plus end which, in turn, is determined by the nucleotide bound within the subunit immediately preceding the plus end. As hydrolysis and inorganic phosphate release are believed to occur with equal probability within any given subunit, the state of nucleotide bound within the preceding subunit also randomly changes (ATP→ADP + Pi→ADP). These changes are occurring simultaneously with (de)polymerization processes which, themselves, indirectly depend upon the hydrolysis state of the nucleotide bound within the preceding subunit. Thus, this nucleotide hydrolysis state is a stochastically “moving target” within a nonlinear feedback loop.
One means of dealing with the challenge of predicting the nucleotide hydrolysis state of the plus end subunit is to track the nucleotide hydrolysis state of every subunit throughout the polymerization time course. Bindschadler et al. were able to accomplish this in a clever but somewhat restricted fashion [18]. Their model imposed a constant length upon the filaments and then iterated stochastic processes over each subunit within every filament. The Green’s Function technique employed in that work to obtain the distribution of subunits binding nucleotide in various hydrolysis states would be difficult to implement within existing biochemical simulation packages. Furthermore, that work focused on steady-state solutions and was not applied to polymerization dynamics.
It is the purpose of this work to present our set of rate equations, based upon a truncation approximation for the hydrolysis states of the bound nucleotides, that accurately model non-equilibrium actin polymerization. We track only the relevant subunits as opposed to each subunit individually. This dramatically reduces the complexity of the rate equations and increases the speed at which they may be integrated numerically. We compare polymerization time courses obtained from these equations to the results of a stochastic simulation method [9] that has been shown to accurately model experimentally measured data. These readily accessible rate equations enable non-specialists to calculate the hydrolysis states of nucleotides within monomers, filaments, and filament tips.
METHODS
General Formalism
In defining our rate-equation methodology, we treat polymerization induced by seed filaments whose number concentration (N) is constant over time. We adopt the linguistically simple convention of referring to an actin molecule containing bound nucleotide in a given hydrolysis state as the molecule itself being in that state. For example, we refer to a subunit that contains a nucleotide in the ADP hydrolysis state as an “ADP subunit.” We also adopt the notation standard to the field where polymerized (filamentous) actin is denoted F while monomeric (globular) actin is denoted G. The rate equations governing the change in concentration of actin in various states of hydrolysis and polymerization are then the following:
| (1) |
| (2) |
| (3) |
| (4) |
| (5) |
We note that in Equation 1–Equation 5, the association and dissociation rates are for the plus ends only, and the superscripts indicate the hydrolysis state. For example, Th represents the number concentration of filament tips in the h hydrolysis state. We have also taken in accordance with the assumption of instantaneous release of inorganic phosphate from free actin monomers [18]. The rates of hydrolysis, inorganic phosphate release and nucleotide exchange are khyd, kphos and knex, respectively. All rates and their default values are summarized in Table I. We observe from the sum of the derivatives given in the above equations that the total concentration of actin remains constant (i.e., mass is conserved). One should note the dependence of these equations upon the tip states (Th) of the filaments. This is a departure from many simple models found in the literature [5, 19–23] where differing hydrolysis states of filament tips are ignored and all tips are assumed to be in a single hydrolysis state.
TABLE I.
Parameter values used in the computation.
| Symbol | Rate Constant | Value | Ref. |
|---|---|---|---|
| ATP monomer association | 11.6 µM−1 s−1 | [10] | |
| ADP monomer association | 2 9 µM−1 s−1 | [24] | |
| ATP subunit dissociation | 1.4 s−1 | [10] | |
| ADP+Pi subunit dissociation | 1.4 s−1 | [18] | |
| ADP subunit dissociation | 5.4 s−1 | [24] | |
| khyd | Hydrolysis | 0.30 s−1 | [21] |
| kphos | Phosphate Release | 0.002 s−1 | [25] |
| knex | Nucleotide Exchange | 0.01 s−1 | [26] |
We now give explicit rate equations governing the change in tip state as a function of time and the probability ηh that the subunit immediately preceding the plus end is in a hydrolysis state h:
| (6) |
| (7) |
| (8) |
We note that the total concentration of filament tips is conserved as must be the case since the concentration of filaments is assumed constant. It is instructive to examine one of these tip-state equations term-by-term. Consider Equation 6. The left side is simply the rate of change of the number concentration of tips (plus ends) in the ATP hydrolysis state. The first term on the right describes the “covering” of ADP+Pi and ADP tips by new ATP from the monomer pool. The second term shows how the dissociation of a ADP+Pi or ADP tip will add to the ATP tip count only if the preceding subunit is itself in the ATP state. The third term accounts for the loss of ATP tips by hydrolysis to the ADP+Pi state, uncovering of ADP+Pi and ADP tips, and covering with ADP actin from the monomer pool.
The effect of filament-tip bound nucleotide hydrolysis state on the extent of polymerization may be readily seen by considering the steady-state solution of Equation 1–Equation 5. From the summation of Equation 3–Equation 5,
| (9) |
At the steady state, the total concentration of monomeric actin is the critical concentration Gc. Equation 9 may be readily solved for that concentration:
| (10) |
The filament concentration N must always equal Thus, for a given set of rate constants, Gc is determined by the probability of finding actin in a particular hydrolysis state. For example, if all of the actin is completely hydrolyzed, then and TD = N. Thus Now, consider the effect of finite nucleotide exchange—where a small amount of ADP-bound actin is returned to the ATP state—upon Gc. Becuase ATP-bound actin polymerizes faster than ADP-bound actin, it is plausible, under various experimental conditions, that each filament maintains an ATP-bound actin cap [13, 27] while the monomer pool comprises mainly ADP-bound G-actin. In this case, the probability of finding a tip in the ATP state increases, more heavily weighting the ATP dissociation rate constant in the calculation of Gc. From Equation 10, it is seen that a fourfold drop in critical concentration from the pure ADP case. One may now immediately appreciate the large impact that a relatively small amount of ATP-bound G-actin can have upon actin polymerization.
Treatment of the Preceding Subunit States via a Truncation Method
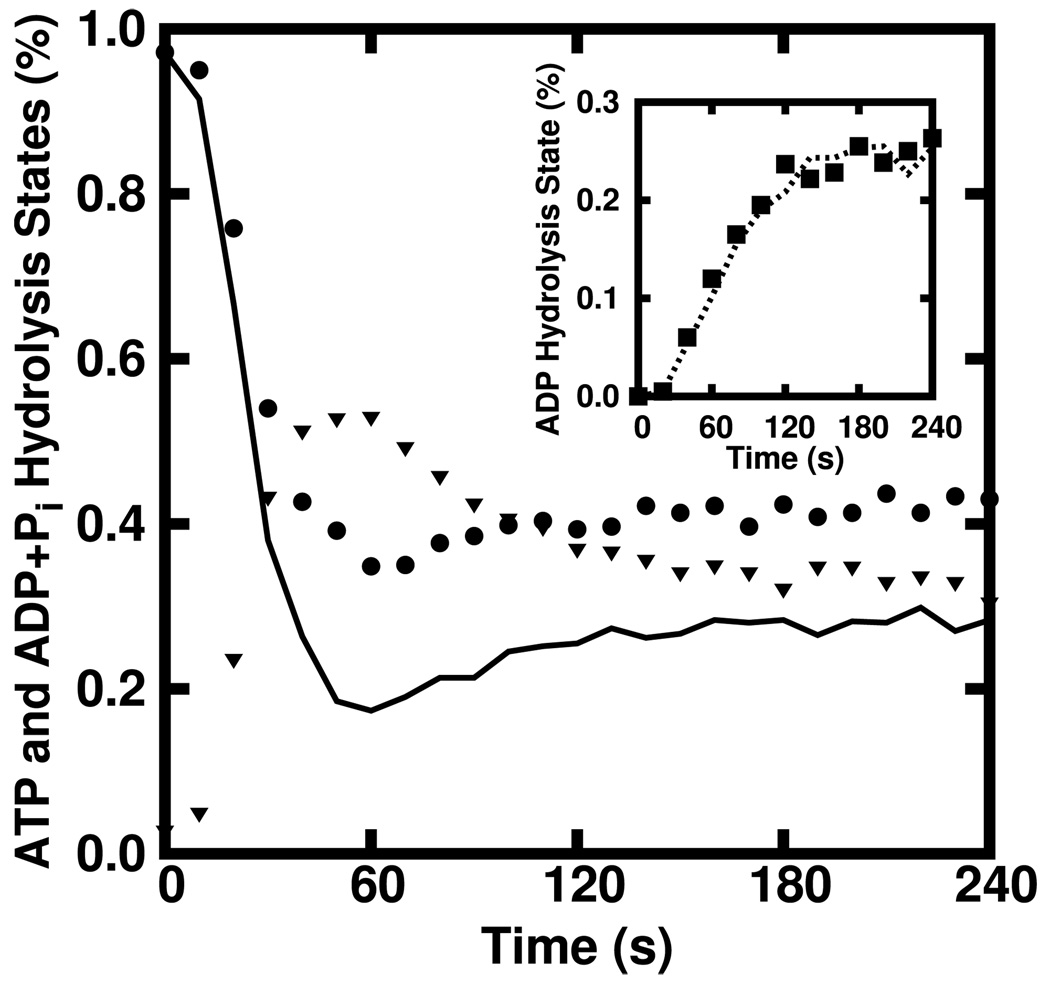
Equation 6–Equation 8 are part of a hierarchy of equations connecting tip behavior to hydrolysis states progressively farther into the filament. The key to truncating this hierarchy is to express the probability of finding a preceding subunit (ηh) in a hydrolysis state h in terms of the Th themselves. We ran the stochastic simulation code described in Ref. [9]—which tracks the hydrolysis state of each subunit—for a range of experimentally reasonable filament number and actin concentrations. Figure 1 shows Th/N (shapes) along with ηh (curves) for a representative case. First, consider the inset where ηD is seen to closely follow TD/N (squares). This suggests that we take ηD = TD/N . Next, consider ηT (solid) which is seen to follow TT/N (circles) until about 25 s, where it then drops below TT/N. At long times, the discrepancy is seen to be about 30%. It is reasonable to guess that ηT is below TT/N because the subunits preceding the tips have had more time to hydrolyze than the tips. This effect of hydrolysis over the time required for monomer addition is roughly measured by Therefore, one would expect that ηT is reduced by a factor of In fact, in Figure 1 it is seen that at long times (triangles)—consistent with the 30% observed reduction of ηT.
FIG. 1.
Time courses of TT/N (solid), ηT (circles) and (triangles) obtained via stochastic simulation of 3 µM ATP actin polymerized from 10 nM ATP pentamers. Here, it is seen that TT /N acheives only 70% of the steady-state ηT value while at the steady state. Inset) The time course of ηD closely follows that of TD /N.
We thus make the following approximations for the probability of finding a preceding subunit ηh in a hydrolysis state h:
| (11) |
| (12) |
| (13) |
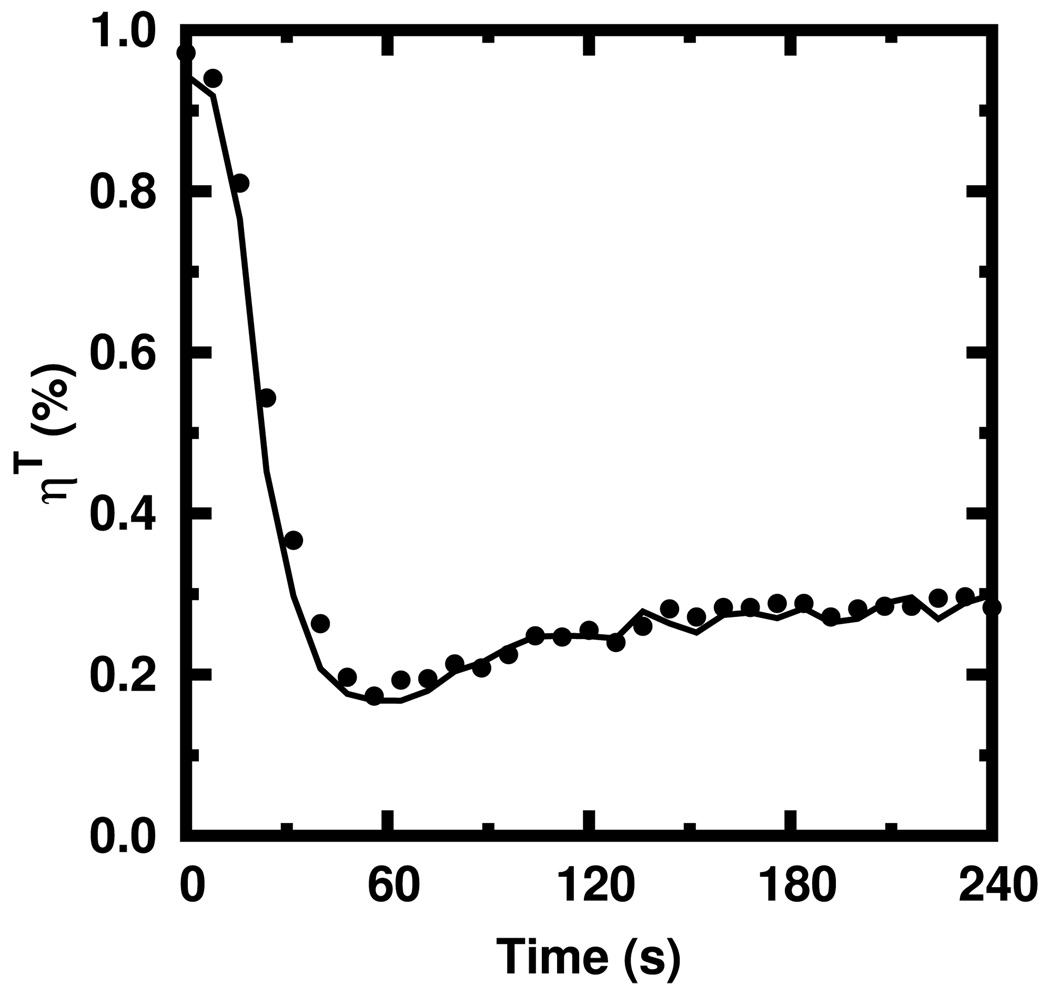
In Figure 2, we plot the simulated ηT against The agreement is very good (within 7%). This agreement was observed to occur over a range of actin and seed filament concentrations (data not shown). With these approximations, our rate equations need not continually keep track of each individual subunit. Instead, the entire polymerization process may be modeled as depending solely upon the hydrolysis state of the plus ends. This is much simpler than the rate equations offered in Ref. [18] where each subunit was tracked via a recursion relation spanning the length of an entire filament.
FIG. 2.
Values of ηT obtained from Equation 11 (solid) against those obtained via stochastic simulation (circles) of 3 µM ATP actin polymerized from 10 nM ATP pentamers.
RESULTS
The model we present in this work describes actin polymerization from the plus end only. This simplification is experimentally relevant to “seed” experiments where the protein spectrin binds the minus end of the filament but allows plus-end polymerization. For typical actin concentrations and filament lengths, the minus ends are capped permanently (by the spectrin) and the filament number remains constant throughout the entire time course. Assuming that large, rapid variations are more difficult for the rate equations to model accurately than simpler, featureless curves, we used polymerization time courses exhibiting rich dynamics as a stringent test of our method. Dramatic polymerization overshoots observed in measured polymerization time courses are the direct result of the concentration of ATP-actin relative to ADP-actin changing during rapid polymerization [9]. As we were unable to find experimentally measured time courses using the high spectrin seed concentrations required to induce such large overshoots3, we compared the results of our numerically integrated rate equations to the results of stochastically simulated polymerization time courses. Because that simulation code has already been shown to accurately model experimental polymerization data [9], we feel that this comparison is useful. For each set of experimental conditions discussed below, 64 individual polymerization time courses were simulated within the computationally-accessible volume of 10 µm3 and those results ensemble averaged. At this ensemble size, we estimate the standard deviation of the mean polymerization time course to be less than one-tenth of one percent and have thus omitted error bars from simulated time courses. To quantify the difference between a calculated (Fc (t)) and ensemble-averaged simulated time course (Fs (t)), we define the fractional error to be
| (14) |
where M is the maximum time of polymerization.
Comparison to Simulated Data
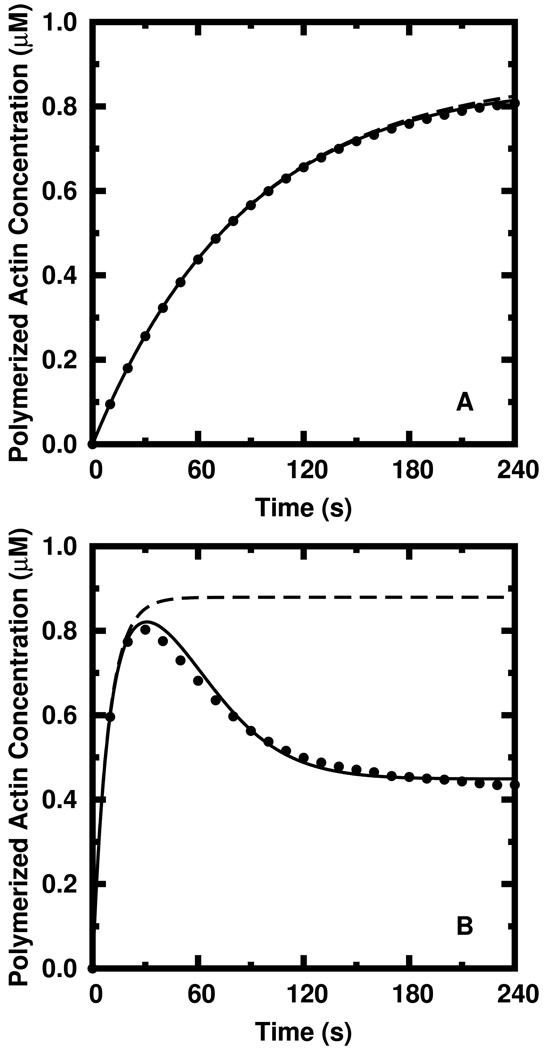
We modeled the common experimental practice of adding existing seed filaments to a known quantity of G-actin. The results of our first simulated experiment are shown in Figure 3a, where 1.0 µM ATP G-actin was polymerized from 1 nM of 1 µm-length ADP seed filaments under conditions of finite nucleotide exchange (knex = 0.01 s−1 [26]). Again following common experimental practice, we subtract a constant from the polymerization time course such that total polymerization is zero at time zero. With such a low concentration of seeds, polymerization is relatively slow and proceeds monotonically to the steady state. In this case, both our multi-tip state model (solid) and the single tip state model (dashed)—in which all tip states are assumed to be ATP—describe the data well and correspond to fractional errors calculated via Equation 14 of 0.6% and 1.2%, respectively. The entire amount of actin present in the system, including seed filaments, is 1 nM × 1 µm × 370 subunits/µm + 1 µM = 1.37 µM which is well below the critical concentration of ADP actin (≈ 1.9 µM). Without finite nucleotide exchange to maintain the system away from equilibrium, this amount of actin would completely depolymerize at long times due to hydrolysis. Figure 3b shows the result of polymerization under the same conditions except that the seed filament concentration is increased to 10 nM. Here, the failure of the single tip state model (dashed) to model the simulated time course (circles) is immediately apparent and the fractional error is unacceptably high (61%). The dramatic overshoot of the steady state polymerization is not described by the single tip state model. Our new rate equation model (solid), however, offers excellent qualitative agreement and corresponds to a low fractional error of only 2.4%.
FIG. 3.
Comparison between stochastically simulated data (circles) and calculated data (curves). A) The relatively slow polymerization of 1.0 µM ATP G-actin from N = 1 nM of 1 µm ADP seed filaments is modeled well by both the simple, single tip state model (dashed) and our multi-tip state model (solid). B) Rapid polymerization, where N is increased to 10 nM, is modeled well by our multi-tip state model but not by the single tip state model.
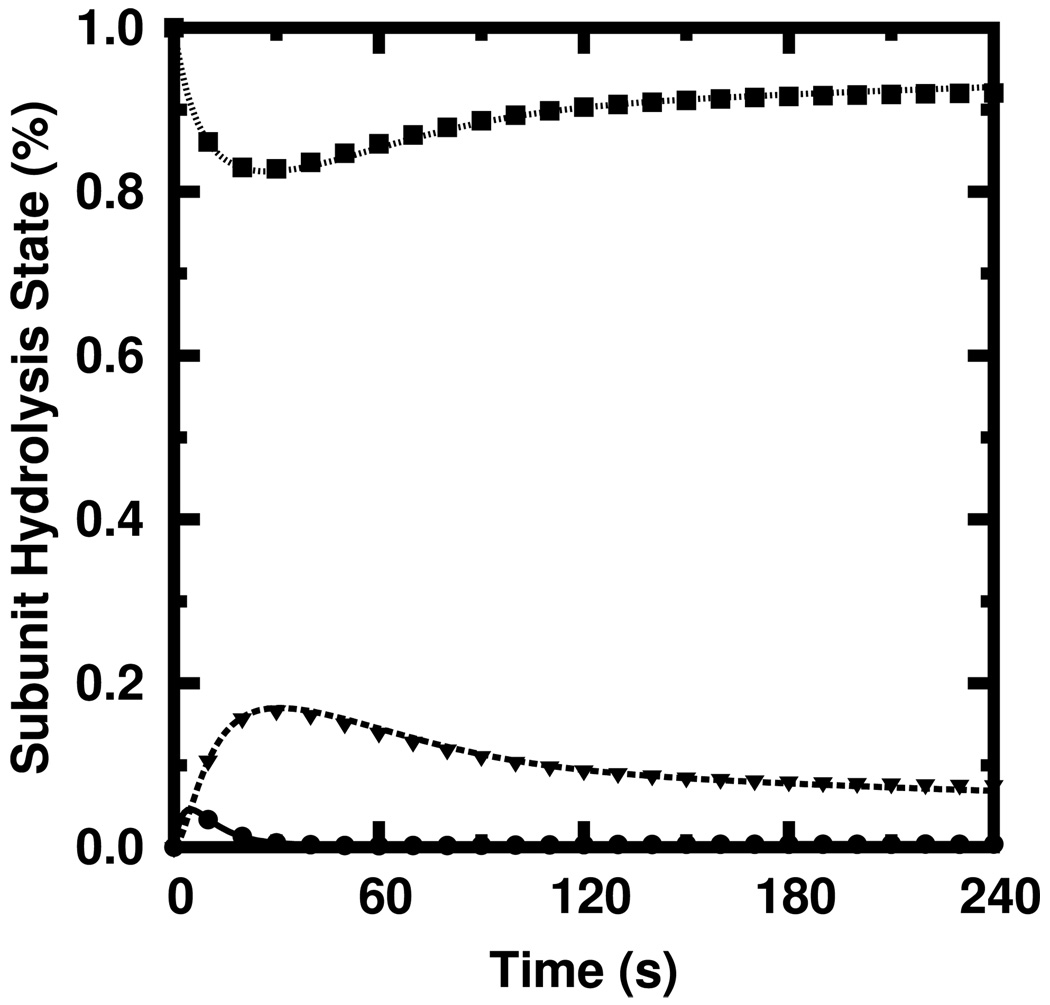
Figure 4 shows the probability of finding polymerized actin in a given hydrolysis state obtained via the stochastic simulation (shapes) against that predicted by our rate equations (curves) for the same conditions used to generate the time course shown in Figure 3b. The agreement over the entire time course is excellent for all three hydrolysis states. We computed the fractional error for each quantity and found the root-mean-square of those fractional errors to be only 2.4%.
FIG. 4.
Simulated (shapes) and calculated (curves) subunit hydrolysis states for the polymerization time course shown in Figure 3b. ATP: solid, triangles; ADP+Pi: dashed, circles. ADP: dotted, squares.
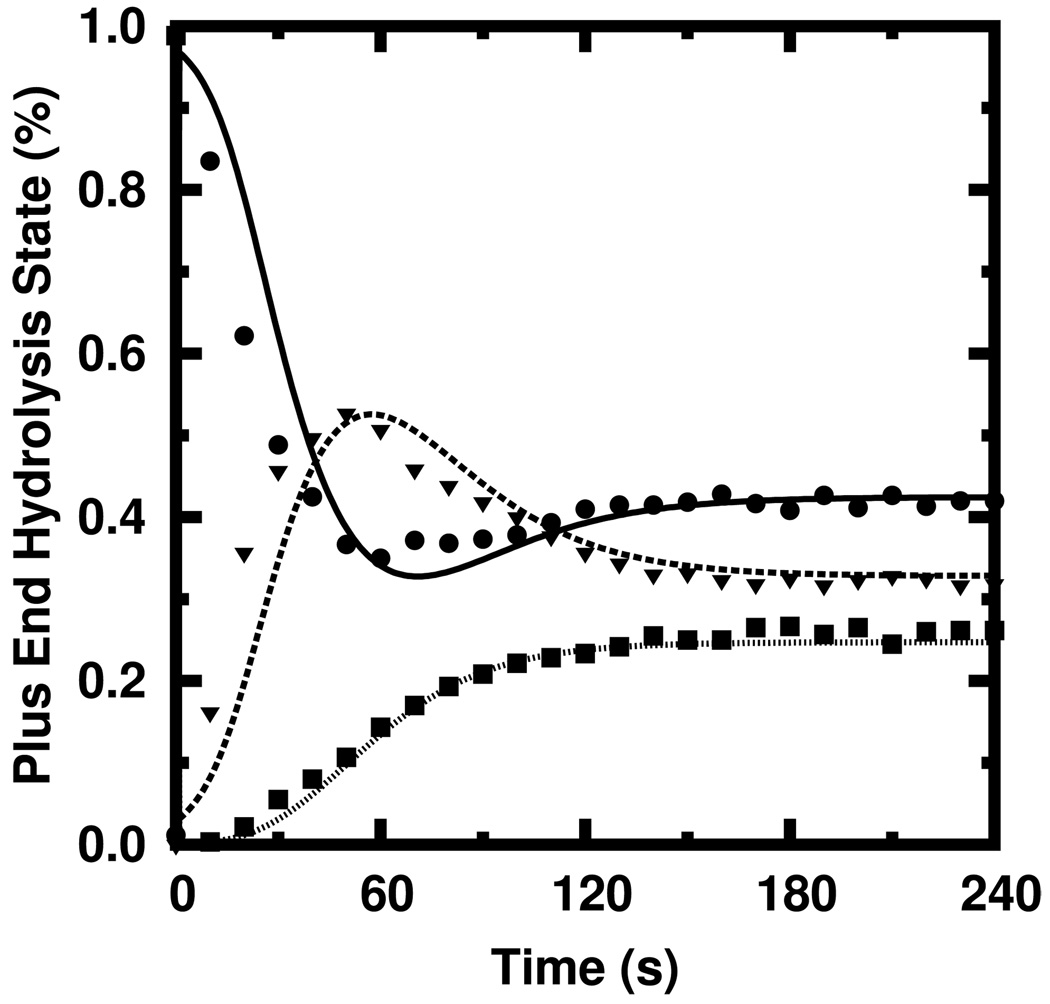
In Figure 5, we compare Th/N predicted by our rate equations (curves) against those predicted by the stochastic simulation (shapes) for the conditions used in Figure 3b. The qualitative agreement over the entire time course is reasonably good. The agreement at steady state—where the values GT and GD are to be calculated—is excellent. The number of tips in a given hydrolysis state predicted by our rate equations agrees with those of the stochastic simulations with a combined root-mean-squared fractional error of 11% over the entire time course but only 4.2% in the steady-state values.
FIG. 5.
Simulated (shapes) and calculated (curves) plus end hydrolysis states for the polymerization time course shown in Figure 3b. ATP: solid, circles; ADP + Pi: dashed, triangles. ADP: dotted, squares.
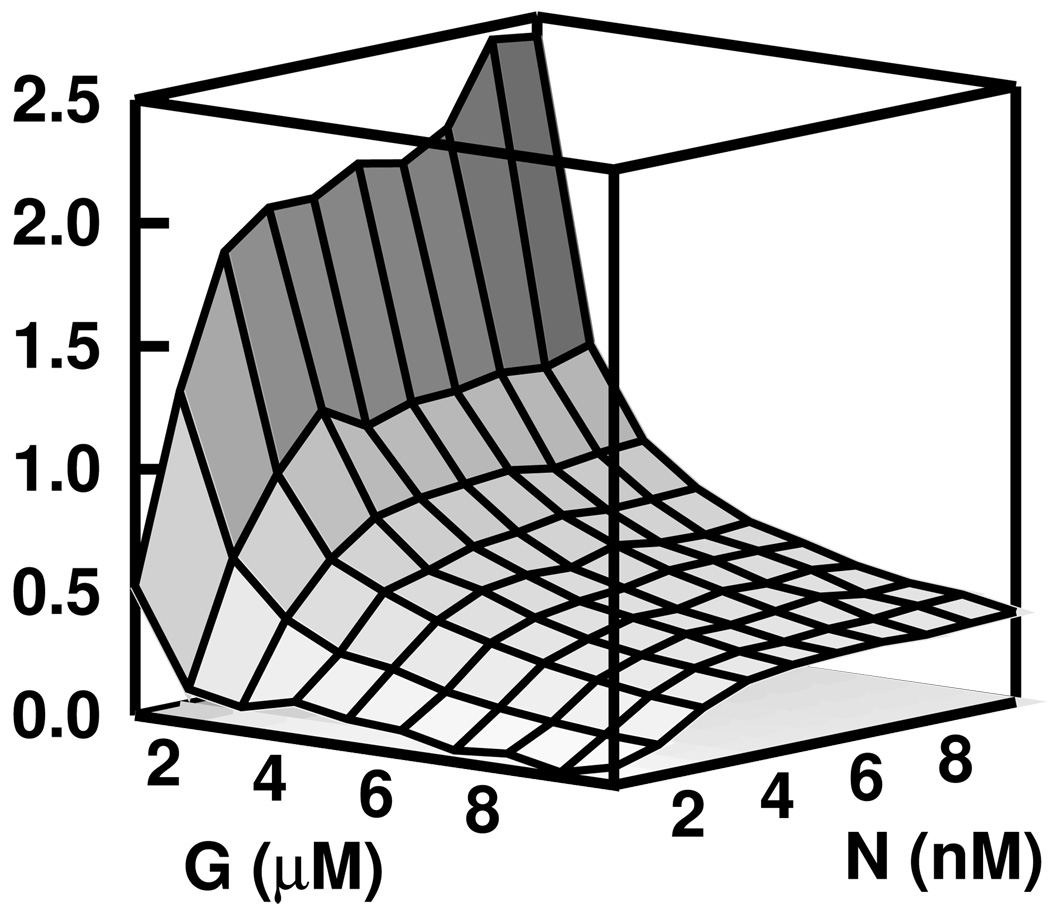
Using the stochastic stimulation code, we modeled polymerization from 1 µm ADP-bound seed filament experiments over a range of seed (1 – 10 nM) and growth actin concentrations (1 – 10 µM) that are experimentally accessible. We compared the time courses to those predicted by our rate equations and computed the fractional error. The result is shown in Figure 6 where it is seen that there is very little discrepancy across a large range of conditions. The error, however, increases for lower concentrations of G-actin. These errors can become significant when filaments completely depolymerize, as is the case when low concentrations of actin are polymerized from very short seed filaments. This is discussed in a later section, “Limitations of the Model”.
FIG. 6.
The fractional error between the polymerization time course obtained via stochastic simulation and that predicted by our rate equations is below 3.0% across a broad range of experimentally accessible conditions.
Inclusion of Plus-end Capping
Plus-end capping of existing filaments by proteins such as CapZ is crucial to the currently-accepted Dendritic Nucleation Model of actin polymerization against a cellular membrane [20, 30]. We thus extend our rate equations to include plus-end capping as follows. We assume that filaments can convert from any of the uncapped tip states to a capped tip state, denoted TZ, at constant rate kcap. Since the rate of plus-end uncapping (kunc = 4 × 10⁻⁴ s−1 [22]) is much less than the rate of inorganic phosphate release (kphos = 0.002 s−1), we assume that tips convert from the capped state to the uncapped state as ADP tips, exclusively. To Equation 6–Equation 8 we thus add the following terms, respectively,
| (15) |
| (16) |
| (17) |
We also include a new equation accounting for the number of capped tips
| (18) |
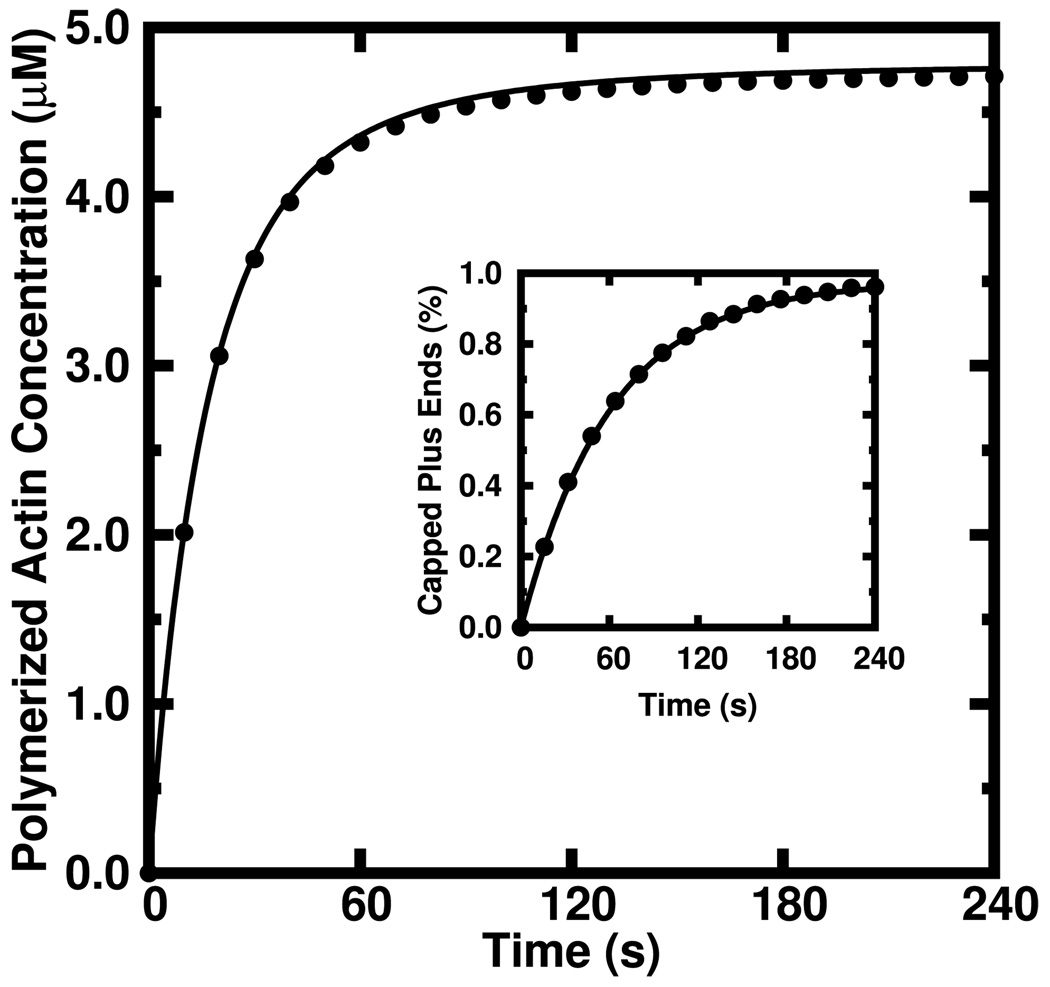
and again note that the total number of tips in all states is conserved. Using the stochastic simulation code described in Ref. [9] we simulated polymerization of 5 µM actin from 5 nM of 1 µm ADP-actin seed filaments under conditions of finite nucleotide exchange, constant kcap = 0.016 s−1 and constant kunc = 4 × 10⁻⁴ s−1. This kcap corresponds to a realistic reservoir capping protein concentration of 2 nM assuming a capper-filament association rate of 8.0 µM−1 s−1 [22]. Figure 7 shows the agreement (within 0.9%) between the simulated time course (circles) and that predicted by our rate equations (solid) while the inset shows the percentage of capped filaments predicted by the simulation (circles) and the rate equations (solid). The excellent agreement between the simulated and calculated percentage of capped plus ends persists with increasing kcap. We varied kcap from 0 to 0.08 s−1 in steps of 0.004 s−1 while holding all other conditions the same as those used the time course shown in Figure 7. This range corresponds to capping concentrations of 0 – 10 nM varied in 0.5 nM increments. The average fractional error between the simulated and calculated polymerization time courses is only 0.9% ± 0.5%. As discussed below, this agreement renders our method useful for discerning the net capping rate from experimental data.
FIG. 7.
Stochastically simulated polymerization time course (circles) of 5 µM actin from 5 nM of 1 µm ADP seed filaments in the presence of capping protein (kcap = 0.016 s−1) compared to same as predicted by our rate equations (solid). Inset) The percentage of capped filaments obtained via stochastic simulation (circles) compared to those predicted by our rate equations (solid).
DISCUSSION
Implications of Non-equilibrium Polymerization
We have seen how rapid non-equilibrium polymerization can exhibit dramatic phenomena such as overshoots (Figure 3b) while slower non-equilibrium polymerization exhibits the monotonic growth (Figure 3a) seen in Refs. [1, 3, 6, 14–16]. As discussed in the Introduction, monotonic growth can also be associated with the elongation of an equilibrium polymer. Because this work and Ref. [9] are the first to consider some of these non-equilibrium phenomena in the context of actin polymerization, we take this opportunity to discuss them in greater detail. The difference between slow and rapid ATP-bound actin polymerization processes is analogous to the difference between slow (quasistatic) and rapid adiabatic-compression processes of an ideal gas. In both systems, the ratio of the rate of dissipation to the rate of the process is an important parameter. If, after rapid compression of the gas, we relax the adiabatic presumption—that is, we give the gas a means of dissipating the additional heat energy due to rapid compression—the gas is free to return to a lower energy state nearer to that of the quasistatic compression case. In the case of rapid actin polymerization, free energy is stored within ATP-bound subunits. That energy is then dissipated via hydrolysis and subsequent phosphate release. In each example, the result is that a transient, higher-energy state gives way to a steady, lower-energy state. This is seen in the polymerization time course shown in Figure 3b as an overshoot preceding the final state.
In this context, the effect of the rate of nucleotide exhange (knex) is clear. Nucleotide exchange serves to undo the dissipation via hydrolysis of free energy stored within filaments. As knex → ∞, the lower energy state of having at least some ADP-bound subunits at the plus ends is never acheived, and no overshoot will occur as the previously-transient, high energy ATP state is maintained by the rapid nucleotide exchange. In real cells, the protein profilin binds actin monomers and enhances the in vitro knex by approximately 100-fold [26]. As the expression and binding of profilin can be regulated in vivo [30], the cell has a mechanism of tuning knex. Therefore, one may expect to observe in vivo polymerization exhibiting both monotonic and overshoot behavior even though both cases would be examples of non-equilibrium polymerization.
Limitations of the Model
The initial conditions of many seed experiments reported are unclear as to the amount of seed actin used, the length of the seed filaments, and the extent of fluorescent labeling of seed actin. Knowing the concentration of unlabeled seed actin is particularly important as only the labeled actin is detected by the fluorometer even though the system polymerizes as dictated by both the labeled and unlabeled actin. Our rate equations do not distinguish between labeled and unlabeled actin. Therefore, while our method accurately predicts total polymerization time courses, it cannot predict measured time courses unless the initial seed actin is labeled at the same percentage as the additional growth actin. This was seen to be the case in Ref. [9] where the measured fluorescence intensity of actin polymerized from unlabeled seed filaments [21] was accurately modeled via stochastic simulation only when labeled and unlabeled actin were treated separately.
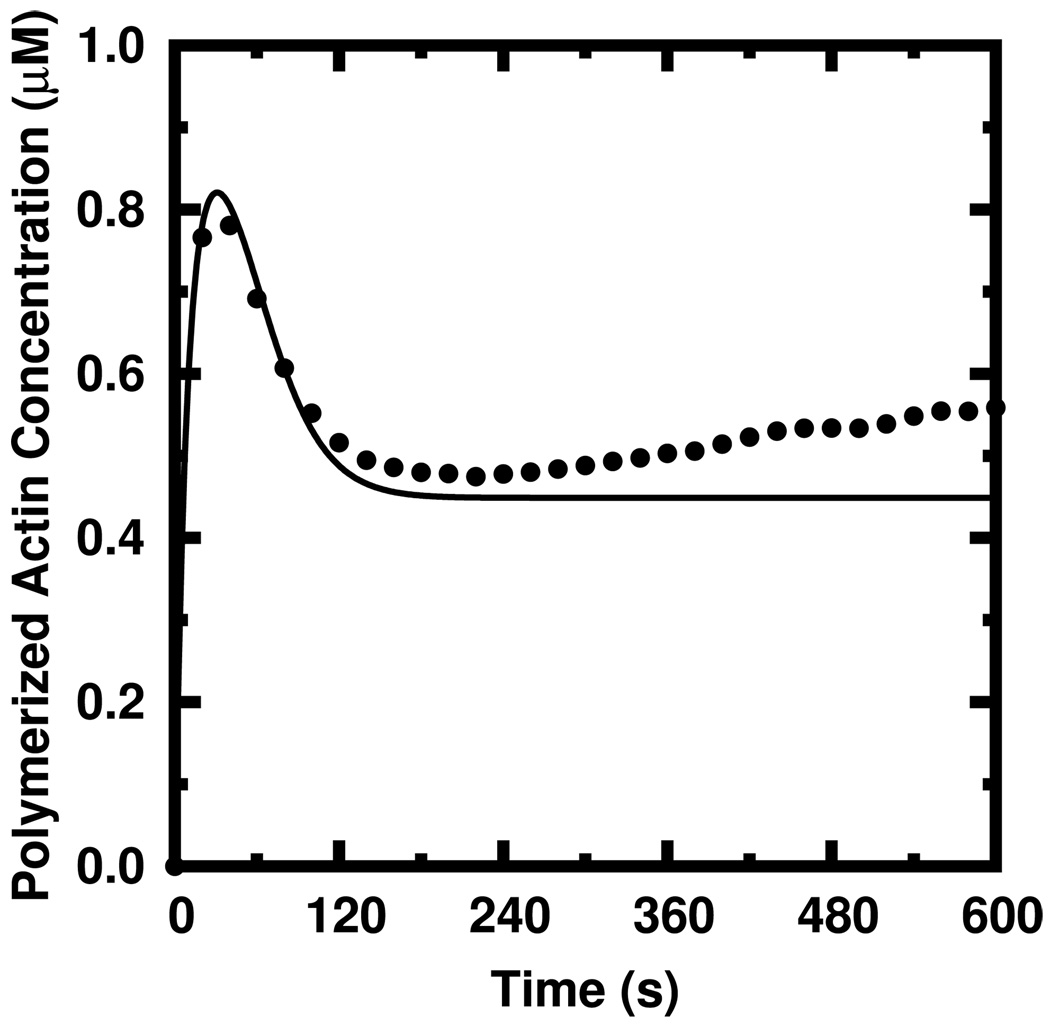
Unlike the stochastic simulation code employed here and described in Ref. [9], our rate equation method does not model the complete depolymerization of filaments. In the case of relatively long (~ 1µm) seed filaments, the length distribution is very narrow. Therefore, no filaments are short enough to completely depolymerize and our rate equation method is accurate. In the case of modeling the elongation of the seed filaments themselves from small actin nuclei, the distribution of lengths is broad and there are a significant number of filaments that are only several subunits in length. These oligomers can completely and spontaneously depolymerize. This has at least one significant effect upon polymerization. At long times, most of the free monomers in solution are in the ADP hydrolysis state. With fewer filaments, these monomers have less probability of polymerizing during a given time period and therefore an increased probability of undergoing nucleotide exchange. After sufficient time, there is an increase in the amount of ATP-bound actin which both polymerizes much faster and depolymerizes slower than ADP-bound actin. Therefore, the response to having fewer filaments can be an increase in the polymerized fraction. Such a “repolymerization” has been observed experimentally [31]. The repolymerization is observed to occur long after the polymerized fraction has achieved an apparent steady-state (Figure 8b). Thus, while all derivatives in our rate equations have become zero, this non-negligible polymerization at long times due to random, complete filament depolymerization is not accurately described. We therefore note that the method described in this work is unreliable in the specific case where filaments have a high probability of complete depolymerization. As the use of long seed filaments is regularly reported in the literature, we feel that complete depolymerization is not a severe constraint to the usefulness our model.
FIG. 8.
Time courses of 1.0 µM ATP actin polymerized from 10.0 nM ADP seed pentamers. The non-negligible repolymerization which can occur at long times as predicted via stochastic simulation (circles) is not predicted (solid) by our rate equations when many filaments completely depolymerize.
Applications of the Model
Extraction of Key Parameters from Experimental Data
Many polymerization time courses are assayed via the pyrene fluorophore which increases intensity upon polymerization [6]. It has been shown that intensity of pyrene is sensitive to the hydrolysis state of the bound nucleotide [9, 13]. The pyrene intensity Ipy(t) may be obtained from our rate equations by using the intensity coefficients derived in Ref. [9] to correctly weight the contributions of each F-actin hydrolysis state to the total intensity time course via
| (19) |
where the pyrene intensity coefficient unit vector <α, β, γ> = <0.37, 0.55, 075>. The measured and calculated intensities may each be divided by the respective maximum value and the normalized time courses compared directly.
Accurate estimation of the concentration of free plus ends from measured polymerization time courses is important to researchers studying the effects of actin binding proteins upon actin polymerization. As shown in Ref. [9], however, ignoring the sensitivity of pyrene intensity upon hydrolysis state leads to errors of near 50% in estimates of the plus end concentration. At known quantities of growth actin, and known labeling percentage of both seed and growth actin, a polymerization time course is experimentally measured. Our model may be then be employed to generate pyrene intensity time courses as described above using the concentration of filaments as a free parameter. The concentration of filaments that minimizes the fractional error (Equation 14) between the calculated and measured intensities is the best estimate.
Numerous in vitro experiments reported in the literature attempt to discern the effects of various capping-protein mutations upon the binding of capping protein to actin filaments [32, 33]. It is thus important to be able to derive the net plus-end capping rate from experimentally measured actin polymerization time courses. This may be done using our model in a two-step fashion. First, because the precise concentration of free plus ends in a batch of spectrin actin seed filaments is generally not known at the time they are employed as polymerization seeds, that concentration may be found by the method described above. The second step is then to vary kcap until the fractional error between the predicted and measured time courses is minimized. Thus, our equations enable researchers studying the effects of capping proteins a reliable means of discerning both the initial number of free plus ends as well as the plus-end capping rate from actin polymerization data.
Whole-cell Models
Our model could be incorporated into whole-cell modeling methods such as those described in Refs. [34–37], by simply including the eight spatially varying variables employed in Equation 1–Equation 8 as well as the additional terms found in 15–17 that describe the effects of capping. Additional terms would need to be added to describe variations in the number concentration of filaments. The additional effects described by our model should have a significant impact on the results. For example, the overshoot behavior seen in Figure 3b and detailed in Ref. [9] results from rapid, non-equilibrium actin polymerization. Within the whole-cell models reported in the literature, such behavior would be due only to direct pulsing of an external stimulus which immediately creates new plus ends from which polymerization can occur, but not as a dynamical feature intrinsic to actin polymerization itself. In other words, our model includes the dynamic response that occurs downstream of a stimulus after new filaments ends have already been created. Thus, employing our model can open another avenue of dynamic response to external stimuli.
Conclusion
The major finding of this work is that the nucleotide hydrolysis states of actin filament tips are accurately described by a truncation approximation which relates the average nucleotide hydrolysis states of penultimate subunits to those of tip subunits. This observation allows the development of a straightforward rate-equation model of non-equilibrium actin polymerization that accurately describes dramatic features of entire polymerization time courses. Previous models of actin polymerization time courses that ignore differing nucleotide hydrolysis states do not accurately model observed polymerization phenomena. Other models that do account for these differences, such as our stochastic simulation technique [9] or the Green’s Function model of Bindschadler et al. [18], must parse the entire set of polymerized subunits. Thus, our new probability-based approach— which describes the differing nucleotide hydrolysis states of the entire actin system solely in terms of the filament tip states—opens an entirely new avenue for understanding the fundamental properties of bulk actin polymerization. Additionally, since our truncation technique significantly reduces computational complexity over preceding attempts at such modeling, our rate equations can easily be implemented in standard kinetic packages such as Berkeley Madonna. This increases the accessibility of essential quantities—such as the relative concentrations of actin molecules binding nucleotide in time-varying hydrolysis states—to non-specialists studying the effects of actin binding proteins upon actin polymerization. As detailed above, this increased accessibility has the two-fold effect of extending the set of experimentally measured data that can be readily modeled as well as enabling the incorporation of more realistic actin polymerization into whole-cell motility models.
Our rate equations may be trivially extended to include minus-end (de)polymerization and finite (as opposed to reservoir) quantities of capping protein. An important further extension would be the inclusion of auto-catalytic branching [20, 22, 38], which has been reported in many experiments. Incorporating this effect will require a method for treating the complete depolymerization of filaments. One means of accomplishing this may be the imposition of a length distribution upon the filaments. For example, if it could be independently shown that the distribution of lengths in an autocatalytically branched filament network is exponential, then that would enable us to predict the probability that filamentous actin should be returned to the monomeric actin pool. As a first attempt, the distribution of hydrolysis states of the returned actin may be assumed equal to the overall distribution of the nucleotide hydrolysis states at any given time. As our rate equations also reveal the probability of finding a filament tip in a given hydrolysis state, the tip states may also be adjusted accordingly.
Acknowledgments
This work was supported by the National Institutes of Health under Grant R01-GM086882.
Footnotes
The plus end is also commonly referred to as the “barbed” end while the minus end is referred to as the “pointed” end.
References
- 1.Lodish HF. Molecular cell biology. 6th ed. New York: W.H. Freeman; 2008. ISBN 0716743663. [Google Scholar]
- 2.dos Remedios CG, Chhabra D, Kekic M, Dedova IV, Tsubakihara M, Berry DA, Nosworthy NJ. Physiol Rev. 2003;83:433. doi: 10.1152/physrev.00026.2002. ISSN 0031–9333 (Print). [DOI] [PubMed] [Google Scholar]
- 3.Wegner A. J Mol Biol. 1976 Nov;108:139. doi: 10.1016/s0022-2836(76)80100-3. ISSN 0022–2836 (Print). [DOI] [PubMed] [Google Scholar]
- 4.Carlier MF, Laurent V, Santolini J, Melki R, Didry D, Xia GX, Hong Y, Chua NH, Pantaloni D. J Cell Biol. 1997;136:1307. doi: 10.1083/jcb.136.6.1307. ISSN 0021–9525 (Print). [DOI] [PMC free article] [PubMed] [Google Scholar]
- 5.Du JY, Frieden C. Biochemistry. 1998;37:13276. doi: 10.1021/bi981117r. ISSN 0006–2960. [DOI] [PubMed] [Google Scholar]
- 6.Cooper JA, Walker SB, Pollard TD. J Muscle Res. 1983;Cell Motil 4:253. doi: 10.1007/BF00712034. ISSN 0142–4319 (Print). [DOI] [PubMed] [Google Scholar]
- 7.Carlier MF, Pantaloni D. Biochemistry. 1986;25:7789. doi: 10.1021/bi00372a001. ISSN 0006–2960 (Print). [DOI] [PubMed] [Google Scholar]
- 8.Bryan KE, Rubenstein PA. J Biol Chem. 2005;280:1696. doi: 10.1074/jbc.M410180200. ISSN 0021–9258 (Print). [DOI] [PubMed] [Google Scholar]
- 9.Brooks FJ, Carlsson AE. Biophys J. 2008 Aug;95:1050. doi: 10.1529/biophysj.107.123125. ISSN 1542–0086 (Electronic). [DOI] [PMC free article] [PubMed] [Google Scholar]
- 10.Pollard TD. J Cell Biol. 1986;103:2747. doi: 10.1083/jcb.103.6.2747. ISSN 0021–9525 (Print). [DOI] [PMC free article] [PubMed] [Google Scholar]
- 11.Isambert H, Venier P, Maggs AC, Fattoum A, Kassab R, Pantaloni D, Carlier MF. J Biol Chem. 1995;270:11437. doi: 10.1074/jbc.270.19.11437. ISSN 0021–9258 (Print). [DOI] [PubMed] [Google Scholar]
- 12.Andrianantoandro E, Pollard TD. Mol Cell. 2006;24:13. doi: 10.1016/j.molcel.2006.08.006. ISSN 1097–2765 (Print). [DOI] [PubMed] [Google Scholar]
- 13.Carlier MF, Pantaloni D, Korn ED. J Biol Chem. 1984;259:9983. ISSN 0021–9258 (Print). [PubMed] [Google Scholar]
- 14.Howard J. Mechanics of motor proteins and the cytoskeleton. Sinauer Associates, Publishers; Sunderland, Mass.: 2001. ISBN 0878933344. [Google Scholar]
- 15.Alberts B. Molecular biology of the cell. 5th ed. New York: Garland Science; 2008. ISBN 9780815341055 (hardcover). [Google Scholar]
- 16.Pollard TD, Earnshaw WC, Lippincott-Schwartz J. Cell biology. 2nd ed. Philadelphia: Saunders/Elsevier; 2008. ISBN 1416022554. [Google Scholar]
- 17.Pieper U, Wegner A. Biochemistry. 1996;35:4396. doi: 10.1021/bi9527045. ISSN 0006–2960 (Print). [DOI] [PubMed] [Google Scholar]
- 18.Bindschadler M, Osborn EA, Dewey CFJ, McGrath JL. Biophys J. 2004;86:2720. doi: 10.1016/S0006-3495(04)74326-X. ISSN 0006–3495 (Print). [DOI] [PMC free article] [PubMed] [Google Scholar]
- 19.Sept D, Xu J, Pollard TD, McCammon JA. Biophys J. 1999;77:2911. doi: 10.1016/s0006-3495(99)77124-9. ISSN 0006–3495 (Print). [DOI] [PMC free article] [PubMed] [Google Scholar]
- 20.Mullins RD, Heuser JA, Pollard TD. Proc Natl Acad Sci U S A. 1998 May 26;95:6181. doi: 10.1073/pnas.95.11.6181. ISSN 0027–8424 (Print). [DOI] [PMC free article] [PubMed] [Google Scholar]
- 21.Blanchoin L, Pollard TD. Biochemistry. 2002;41:597. doi: 10.1021/bi011214b. ISSN 0006–2960 (Print). [DOI] [PubMed] [Google Scholar]
- 22.Carlsson AE, Wear MA, Cooper JA. Biophys J. 2004;86:1074. doi: 10.1016/S0006-3495(04)74182-X. ISSN 0006–3495 (Print). [DOI] [PMC free article] [PubMed] [Google Scholar]
- 23.Le Clainche C, Pauly BS, Zhang CX, Engqvist-Goldstein AEY, Cunningham K, Drubin DG. EMBO J. 2007;26:1199. doi: 10.1038/sj.emboj.7601576. ISSN 0261–4189 (Print). [DOI] [PMC free article] [PubMed] [Google Scholar]
- 24.Fujiwara I, Vavylonis D, Pollard TD. Proc Natl Acad Sci U S A. 2007;104:8827. doi: 10.1073/pnas.0702510104. ISSN 0027–8424 (Print). [DOI] [PMC free article] [PubMed] [Google Scholar]
- 25.Pollard TD, Blanchoin L, Mullins RD. Annu Rev Biophys Biomol Struct. 2000;29:545. doi: 10.1146/annurev.biophys.29.1.545. ISSN 1056–8700 (Print). [DOI] [PubMed] [Google Scholar]
- 26.Selden LA, Kinosian HJ, Estes JE, Gershman LC. Biochemistry. 1999;38:2769. doi: 10.1021/bi981543c. ISSN 0006–2960 (Print). [DOI] [PubMed] [Google Scholar]
- 27.Vavylonis D, Yang Q, O’Shaughnessy B. Proc Natl Acad Sci USA. 2005;102:8543. doi: 10.1073/pnas.0501435102. ISSN 0027–8424 (Print). [DOI] [PMC free article] [PubMed] [Google Scholar]
- 28.Carlsson AE. Biophys J. 2006;90:413. doi: 10.1529/biophysj.105.069765. ISSN 0006–3495. [DOI] [PMC free article] [PubMed] [Google Scholar]
- 29.Carlier MF, Pantaloni D, Korn ED. J Biol Chem. 1985;260:6565. ISSN 0021–9258 (Print). [PubMed] [Google Scholar]
- 30.Pollard TD, Borisy GG. Cell. 2003;112:453. doi: 10.1016/s0092-8674(03)00120-x. ISSN 0092–8674 (Print). [DOI] [PubMed] [Google Scholar]
- 31.Pantaloni D, Carlier MF, Coue M, Lal AA, Brenner SL, Korn ED. J Biol Chem. 1984 May 25;259:6274. ISSN 0021–9258 (Print). [PubMed] [Google Scholar]
- 32.Yang C, Pring M, Wear MA, Huang M, Cooper JA, Svitkina TM, Zigmond SH. Dev Cell. 2005;9:209. doi: 10.1016/j.devcel.2005.06.008. ISSN 1534–5807 (Print). [DOI] [PMC free article] [PubMed] [Google Scholar]
- 33.Kim K, McCully ME, Bhattacharya N, Butler B, Sept D, Cooper JA. J Biol Chem. 2007;282:5871. doi: 10.1074/jbc.M609850200. ISSN 0021–9258 (Print). [DOI] [PMC free article] [PubMed] [Google Scholar]
- 34.Alberts JB, Odell GM. PLoS Biol. 2004;2:e412. doi: 10.1371/journal.pbio.0020412. ISSN 1545–7885 (Electronic). [DOI] [PMC free article] [PubMed] [Google Scholar]
- 35.Nishimura SI, Sasai M. Phys Rev E Stat Nonlin Soft Matter Phys. 2005 Jan;71:010902. doi: 10.1103/PhysRevE.71.010902. ISSN 1539–3755 (Print). [DOI] [PubMed] [Google Scholar]
- 36.Maree AFM, Jilkine A, Dawes A, Grieneisen VA, Edelstein-Keshet L. Bull Math Biol. 2006 Jul;68:1169. doi: 10.1007/s11538-006-9131-7. ISSN 0092–8240 (Print). [DOI] [PubMed] [Google Scholar]
- 37.Lacayo CI, Pincus Z, VanDuijn MM, Wilson CA, Fletcher DA, Gertler FB, Mogilner A, Theriot JA. PLoS Biol. 2007 Sep;5:e233. doi: 10.1371/journal.pbio.0050233. ISSN 1545–7885 (Electronic). [DOI] [PMC free article] [PubMed] [Google Scholar]
- 38.Carlsson AE. Biophys J. 2005;89:130. doi: 10.1529/biophysj.105.061598. ISSN 0006–3495 (Print). [DOI] [PMC free article] [PubMed] [Google Scholar]


