Abstract
Calpain activation is hypothesized to be an early occurrence in the sequence of events resulting in neurodegeneration, as well as in the signaling pathways linking extracellular accumulation of Aβ peptides and intracellular formation of neurofibrillary tangles. In an effort to identify small molecules that prevent neurodegeneration in Alzheimer’s disease by early intervention in the cell death cascade, a cell-based assay in differentiated Sh-SY5Y cells was developed utilizing calpain activity as a read-out for the early stages of death in cells exposed to extracellular Aβ. This assay was optimized for high-throughput screening, and a library of approximately 120,000 compounds tested. It was expected that the compounds identified as calpain inhibitors would include those that act directly on the enzyme and those that prevented calpain activation by blocking an upstream step in the pathway. In fact, of the compounds that inhibited calpain activation by Aβ with IC50 values < 10 μM and showed little or no toxicity at concentrations up to 30 μM, none inhibit the calpain enzyme directly. Studies to identify the targets of these compounds in the cell death pathway are ongoing.
Introduction
The pathology of Alzheimer’s disease (AD) is characterized by the appearance of extracellular β-amyloid (Aβ) plaques, intracellular neurofibrillary tangles of hyperphosphorylated τ protein, and corresponding neurodegeneration. Although the exact mechanism of cell death in the disease is as yet unknown, studies have shown that application of extracellular Aβ peptides to cells in culture results in cell death (Yankner et al., 1989). Additionally, exposure of cells to exogenous Aβ peptides activates signaling cascades that lead to increased phosphorylation of the microtubule-stabilizing protein τ (Pike et al., 1991; Yankner, 1996), suggesting that the two lesions do not occur independent of each other. Hyperphosphorylation of τ results in dissociation of the protein from microtubules leading to a loss of microtubule stability, and ultimately cell death (Feinstein and Wilson, 2005). Although several kinases have been implicated in τ phosphorylation, recent studies have implicated the cyclin-dependent kinase 5 (cdk5) in τ hyperphosphorylation in response to Aβ-treatment of cells (Alvarez et al., 1999; Li et al., 2003) and in human AD brain (Lee et al., 1999; Patrick et al., 1999). Cdk5 activity is modulated by its interaction with specific activator proteins, p39 and p35 (Tsai et al., 1994; Humbert et al., 2000). Cleavage of p35 to p25 by the calcium-dependent cysteine protease calpain leads to increased cdk5 activity and increased phosphorylation of τ (Kusakawa et al., 2000; Lee et al., 2000) Numerous studies have shown that Aβ-treatment of primary neuronal cells in culture produces an increase in intracellular calcium (Mattson et al., 1992; He et al., 2002), and postmortem analysis of human AD brain tissue also revealed increased calpain activity (Saito et al., 1993; Taniguchi et al., 2001). These observations indicate that calpain activation due to increased intracellular Ca2+ in response to Aβ exposure may be an important signaling pathway linking extracellular Aβ accumulation to intracellular formation of tangles of hyperphosphorylated τ and subsequent cell death in AD.
In addition to its role in activation of cdk5 and phosphorylation of τ, other potential roles for calpain in neurodegeneration have been identified. There is some evidence that calpain activation may be involved early in the pathogenesis of the disease by modulating the cleavage of amyloid precursor protein to produce Aβ peptides (Siman et al., 1990; Chen et al., 2000). Additionally, dynamin 1, a protein involved in synaptic vesicle recycling, has recently been identified as a substrate for calpain (Kelly et al., 2005). Increased proteolysis of dynamin 1 in AD could result in decreased neurotransmitter release and subsequent synaptic dysfunction. A more direct involvement of calpain in neuronal cell death is through cleavage of procaspase 12 to the active caspase 12, which results in initiation of the apopototic cascade in response to endoplasmic reticulum dysfunction (Nakagawa and Yuan, 2000). The potential involvement of calpain in several pathways related to Aβ-induced cell death makes it an attractive target for therapeutic intervention in AD. In fact, calpain inhibition has been shown to be neuroprotective against a variety of toxic insults (Schumacher et al., 2000; Crocker et al., 2003; Li et al., 2003; Knoblach et al., 2004).
The majority of efforts to identify calpain inhibitors have involved designing compounds based on chemical structures of naturally occurring calpain inhibitors, e.g., the peptidyl aldehyde derivatives such as MDL-28170 and Acetyl-Leu-Leu-Nle-H (ALLN)- potent, cell-permeable inhibitors that are not selective for calpain (Shaw, 1994). The design-based approach to identifying direct inhibitors of calpain has produced compounds with varying potencies and selectivity for calpain, yet none of these compounds has advanced to clinical trials. Therefore, our goal was to develop a cell-based assay that could be adapted for high-throughput screening in an effort to identify novel small molecule inhibitors of the calpain pathway as a means of preventing Aβ-induced neurotoxicity.
Materials and Methods
Cell Culture Conditions
SH-SY5Y cells obtained from American Type Culture Collection (Manassas, VA) were cultured at 37°C in the presence of 5% CO2 and maintained in Dulbecco’s Modified Eagle’s Medium (DMEM) (Gibco, Los Angeles, CA) with 10% fetal bovine serum and 100 μg/ml penicillin-streptomycin (Sigma, St. Louis, MO). In preparation for assays, cells were trypsinized using Trypsin-EDTA (Invitrogen), collected and harvested by centrifugation at 126 × g for 10 minutes. The pellet was resuspended in RPMI 1640 medium without phenol red (Invitrogen, Carlsbad, CA) and with 1% fetal bovine serum and 100 μg/ml penicillin-streptomycin, and the cell suspension plated in 384-well black tissue culture-treated plates with clear bottoms (Corning, Acton, MA) at a density of 10,000 cells in 20 μl media per well with a Multidrop 384 (Thermo Fisher Scientific., Waltham, MA). Cells were incubated for 24 h at 37°C in the presence of 5% CO2, then were treated with 10 μl 30μM all trans-retinoic acid (Sigma, St. Louis, MO) in serum-free RPMI 1640 to induce differentiation. The final concentration of retinoic acid was 10 μM in 30 μl media, and the final serum concentration for was 0.67%. The cells were kept at 37°C in the presence of 5% CO2 for 5 days after plating, when the assays were performed.
Cell-based Calpain Activity Assay Optimization
Calpain activity in the cells was measured using a variation of the protocol for the CalpainGLO assay kit from Promega (Madison, WI). The assay was originally designed for use with purified enzyme in an add-mix-measure format. Briefly, the substrate and detection reagent were combined and incubated with purified enzyme in the presence or absence of Ca2+. To adapt this assay for whole cell measurement of endogenous calpain activity, the substrate was added to the cells independently, followed by exposure to insults, and cellular calpain activity measured with the detection reagent after the cells were lysed. β-Amyloid25–35 (Anaspec, San José, CA) was reconstituted to 1.26 mM in ddiH2O, then diluted to 1 mM in 50 mM Tris pH 7.4 and incubated for 24 h at 37°C to preaggregate the peptide. For validation of the assay, the cells were incubated for 30 minutes with 5 μM BAPTA-AM (Sigma, St. Louis, MO), 50 μM MDL-28170, or 100 nM Epoxomicin (E M D Biosciences, La Jolla, CA), then with 20 μM Suc-LLVY-Aminoluciferin substrate, diluted in CalpainGLO assay buffer, for 30 minutes prior to exposure to 5 μM Ionomycin (Sigma, St. Louis, MO) or 25 μM Aβ25–35 for 4 or 8 hours, respectively. Each treatment was administered by addition of 5 μl working stock diluted in serum-free RPMI 1640 to cells in 30 μl medium. Black backing tape (Perkin Elmer Life Sciences) was applied to the bottom of each plate prior to luminescence detection. The cells were then lysed in 5 μl lysis buffer consisting of 9% Triton-X-100 with 1 mM of the known calpain inhibitor MDL-28170 (E M D Biosciences, La Jolla, CA) to prevent further cleavage of the substrate by calpain. Twelve μl of a 2X solution of the luciferase detection reagent was added to the cell lysates and luminescence measured after 15 minutes incubation at room temperature using an LJL Analyst plate reader (Molecular Devices).
High-throughput Screen for Calpain Inhibitors
SH-SY5Y cells were prepared as described above. The screening assay was performed 4 days following initial exposure to retinoic acid. A Beckman Biomek FX robotics system (Beckman Coulter, Fullerton, CA) with a 384-multichannel pipetting head was used to perform the screening experiments. The compound library consisted of over 120,000 small molecules, including compounds approved by the Food and Drug Administration (FDA), a purified natural products library, compounds purchased from Peakdale (High Peak, UK), Maybridge Plc. (Cornwall, UK), Cerep (Paris, France), Bionet Research Ltd. (Cornwall, UK), Prestwick (Ilkirch, France), Specs and Biospecs (CP Rijswijk, the Netherlands), ENAMINE (Kiev, Ukraine), I.F. Lab LTD (Burlington, Canada), and Chemical Diversity Labs (San Diego, CA), and small molecules from different academic institutions. Compound source plates for the assay were prepared by spotting 0.4 μl of 1.67 mM compound in DMSO in each well of a Greiner 384-well plate, with columns 23 and 24 spotted with neat DMSO for positive and negative controls. These plates were then sealed with aluminum plate seals and stored at −20°C. The day of the screen, the compounds source plates were thawed to room temperature, and the compounds were diluted in 70 μl serum-free RPMI 1640 for an intermediate stock of 9.54 μM compound and 0.57% DMSO. The positive control for inhibition consisted of 0.45 mM solution of the known calpain inhibitor MDL-28170 in serum-free RPMI 1640, which was added to column 24 of the compound source plate. The negative controls were prepared by diluting 0.4 μl DMSO in 70 μl serum-free RPMI 1640 as a vehicle control in column 23. Five μl of compound or control was transferred from the source plate to the cell plate resulting in a concentration of 1.36 μM compound, 0.08% DMSO, or 64.3 μM MDL-28170 in the assay system. The cells were exposed to the compounds/controls at room temperature for 30 minutes then 5 μl of 0.180 mM Suc-LLVY-aminolucinferin calpain substrate was added to all the wells and incubated with the cells at room temperature for 30 minutes. The cells, including the negative and positive controls, were then exposed to 5 μl of 0.225 mM pre-aggregated Aβ25–35 for 8 h at 37°C and 5% CO2. Following incubation with Aβ25–35, the cells were lysed in 5 μl calpain lysis buffer (0.9% Triton-X-100 with 0.1 mM MDL-28170) and incubated for 15 minutes with 12 μl of a 2X solution of the CalpainGLO luciferase detection reagent in a final assay volume of 62 μl. Luminescence was detected using an LJL Analyst plate reader (Molecular Devices). Approximately 10,000 compounds were tested each screening day using this protocol. Analysis of the data was performed by determining the % inhibition of calpain exhibited in each compound well, using the MDL-28170- treated cells as 100% inhibition (positive control), and those treated with Aβ25–35 alone as 0% inhibition (negative control), according to the following formula:
where the luminescencetest is the signal in the test compound well, the average luminescencepositive control is the average of the signals in the MDL-28170-treated wells, and the average luminescencenegative control is the average of the signals in the wells treated with Aβ alone. The Z′ factor, a statistical characteristic used for determining the quality of each plate, was calculated using Excel software based on the method developed by Zhang et al. Compounds exhibiting ≥ 60% inhibition in the primary screen were then selected for validation in a three-point dose-response experiment. Preparation of the compound source plate for the validation assay involved diluting 3.4μl of 10 mM stock to 5 μl in DMSO for a solution of 6.8 mM, then performing two serial dilutions in DMSO to prepare 1.36 mM and 0.136 mM solutions. This was done using a Beckman Biomek NX system (Beckman Coulter, Fullerton, CA) with span 8 pipetting head. 0.4 μl of these solutions was then further diluted in 70 μl serum-free RPMI 1640 for intermediate compound stocks of 38 μM, 7.8 μM, and 0.78 μM respectively, then quadmapped to a 384-well format by a Beckman Biomek FX system with 96 multichannel pipetting head. The assay was performed as described above, with final compound concentrations in the assay system of 5, 1, and 0.1 μM. In parallel with these validation studies, cytotoxicity of the selected compounds was determined.
Cytotoxicity Assay
Toxicity of compounds was determined using the CellTiterGLO Luminescent viability assay from Promega (Madison, WI), according to manufacturer’s instructions. Briefly, the CellTiterGLO substrate was reconstituted in the buffer supplied with the kit, and a volume of this reagent equal to the volume of cell culture medium was added to each well. Cell lysis was induced by the CellTiterGLO reagent, and the amount of ATP released detected by the substrate. The luminescent signal was allowed to equilibrate over 15 minutes at room temperature and the signal detected using an LJL Analyst plate reader (Molecular Devices).
Purified Calpain II Activity Assay
Purified calpain activity was determined using the CalpainGLO assay kit from Promega according to the protocol provided. Briefly, 50 nM m-Calpain isolated from porcine kidney (E M D Biosciences, La Jolla, CA) in calpain enzyme buffer (10 mM HEPES, pH 7.2, 1 mM EDTA, and 10 mM DTT) was incubated for 30 minutes with test compound or known inhibitor, then mixed with reagent mix from assay kit consisting of 80 μM Suc-LLVY-aminoluciferin substrate in 1X luciferase detection reagent, with or without 2.5 mM CaCl2 and luminescence measured after 15 minutes at room temperature using an LJL Analyst plate reader (Molecular Devices).
Results
Screening Strategy
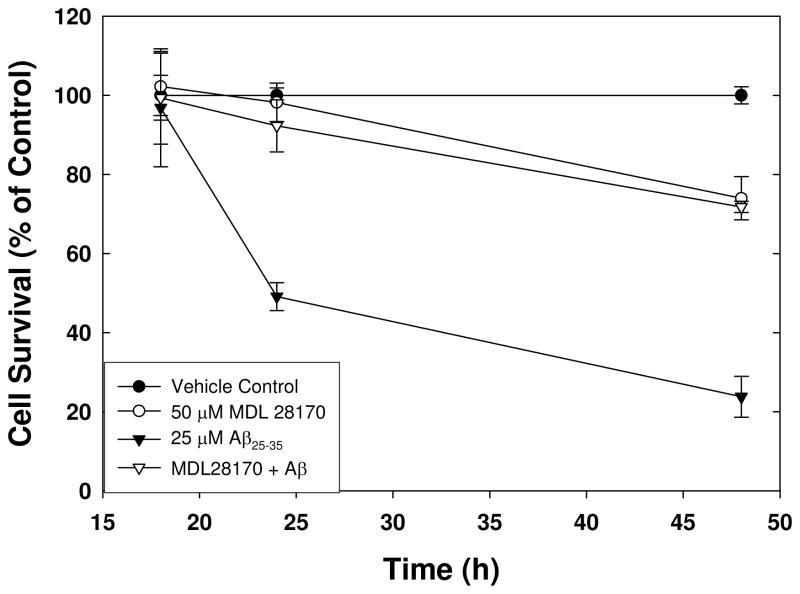
The goal of this screen was to identify compounds that inhibited β-amyloid-induced activation of calpain as a means of identifying potentially neuroprotective agents. This assay is modeled after other calpain activity assays performed in primary neurons in culture using an aminomethylcoumarin-conjugated substrate (Li et al., 2003). Initial experiments indicated that treatment of retinoic acid-differentiated SH-SY5Y cells with Aβ25–35 induced toxicity in a time-dependent manner (Figure 1). In the presence of the known calpain inhibitor MDL-28170 toxicity was prevented at 24 hours of exposure in a time-course experiment (Figure 1), suggesting that calpain inhibition protects against Aβ-induced cell death. Therefore, we developed a cell-based assay for measuring calpain activation after treatment with exogenous Aβ utilizing a cell-permeable aminoluciferin-conjugated calpain substrate, Suc-LLVY-aminoluciferin. This approach permits identification of compounds that inhibit calpain activity by either direct interaction with the enzyme or through an indirect mechanism. Retinoic acid treatment results in differentiation of SH-SY5Y cells resulting in neurite outgrowth and expression of neuronal markers such as neurofilament proteins and neuron-specific enolase (Encinas et al., 2000; Simpson et al., 2001). Undifferentiated SH-SY5Y cells did not have a response to Aβ treatment (data not shown).
Figure 1. Viability of SH-SY5Y cells treated with Aβ 25–35 in the presence or absence of known calpain inhibitor MDL-28170.
Cell survival as measured by the luminescent detection of ATP generation is shown as a percentage of DMSO vehicle control over the course of 48 h in cells exposed to 25 μM pre-aggregated Aβ25–35 alone or following a 30 minute pretreatment with 50 μM MDL-28170. Error bars represent the standard deviation of 8 replicate wells, and the results are representative of 3 separate experiments.
Assay Validation
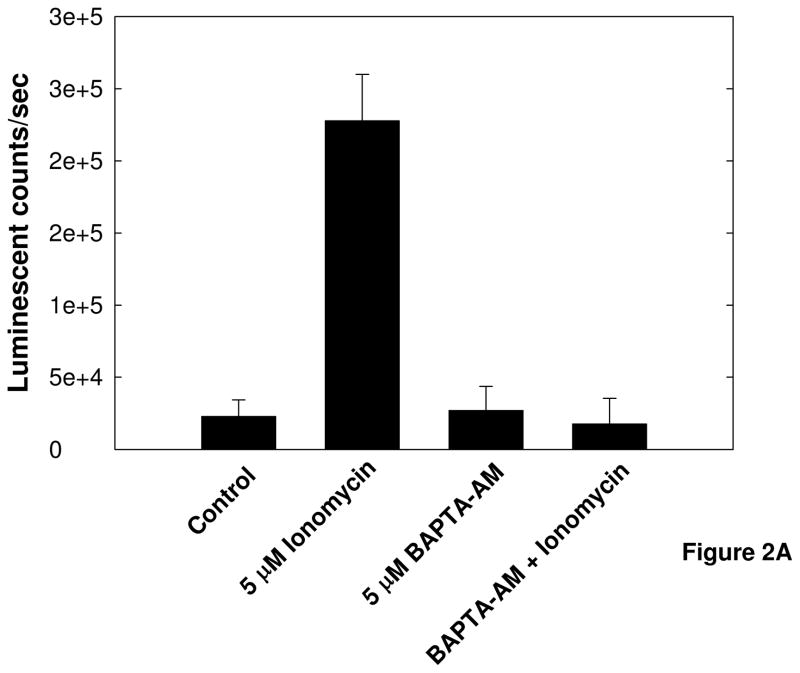
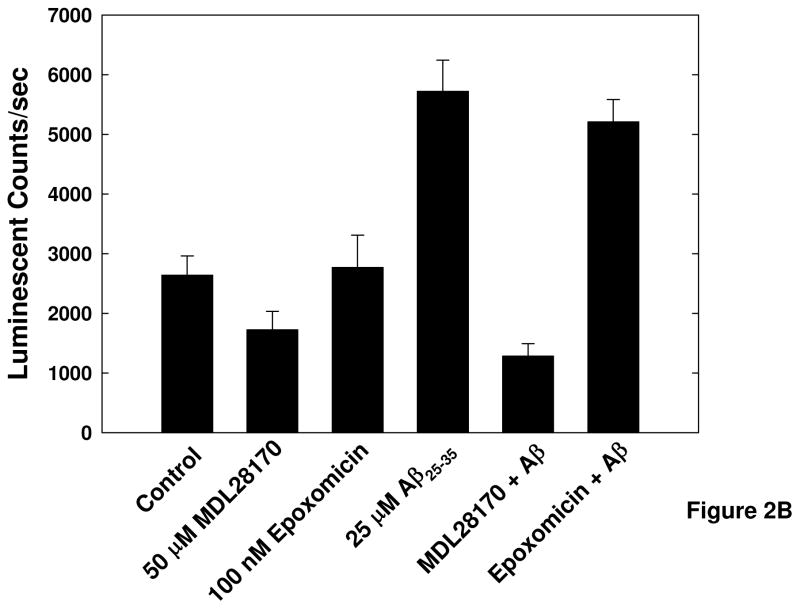
Prior to implementation in a high-throughput screening platform the validity of this method for detecting calpain activity had to be ascertained. The dependence of substrate cleavage on cytosolic Ca2+ levels, as well as the specificity of the substrate for cleavage by calpain in this cellular assay system had to be shown before the assay could be used in high-throughput screening. Initial assay validation experiments were conducted using the Ca2+ ionophore ionomycin to induce calpain activation, and the cell permeable Ca2+ chelator BAPTA-AM to prevent increased free cytosolic Ca2+ and subsequent activation of calpain (Figure 2A). Influx of intracellular Ca2+ induced by ionomycin resulted in increased cleavage of the calpain substrate, and chelation of intracellular Ca2+ by BAPTA-AM prevented cleavage of the substrate. These results show that cleavage of the substrate is dependent on changes in cytosolic Ca2+ concentration, as we expect for calpain activity. The substrate being used can also be subject to cleavage by the 20S proteasome; thus the specificity of the substrate for cleavage by calpain in this assay system was determined by exposing cells to inhibitors specific for calpain (MDL-28170) or the 20S proteasome (epoxomicin) for 30 minutes prior to the addition of Aβ25–35 (Figure 2B). Treatment with A β25–35 resulted in a 2-fold increase in luminescence over untreated control cells. Pretreatment of the cells with the calpain inhibitor MDL28170 reduced the luminescent signal to half of untreated control levels, suggesting inhibition of basal substrate cleavage in the cells as well as Aβ-induced cleavage of the substrate. Importantly, pretreatment of the cells with epoxomicin had no effect on the basal luminescent signal or on the increase in luminescence in Aβ-treated cells. This result shows that in this cellular assay system the substrate cleavage and resultant luminescent signal produced are a result of calpain activity and not the 20S proteasome.
Figure 2. Validation of cell-based luminescent calpain activity assay.
A) Activation of calpain after treatment with the Ca2+ ionophore ionomycin and inhibition of calpain activation by the cell permeable Ca2+ chelator BAPTA-AM. SH-SY5Y cells were exposed to 5 μM BAPTA-AM for 30 minutes, then treated with 5μM ionomycin for 4 hours in the presence of the calpain substrate Suc-LLVY-aminoluciferin. B) Specificity of the substrate for cleavage by calpain in this cellular system. SH-SY5Y cells were treated with 50 μM MDL-28170 or 100 nM Epoxomycin for 30 minutes prior to exposure to 25 μM Aβ25–35 in the presence of the luminescent calpain substrate. Error bars represent the standard deviation of 16 replicate wells, and data are representative of the results from 3 separate experiments.
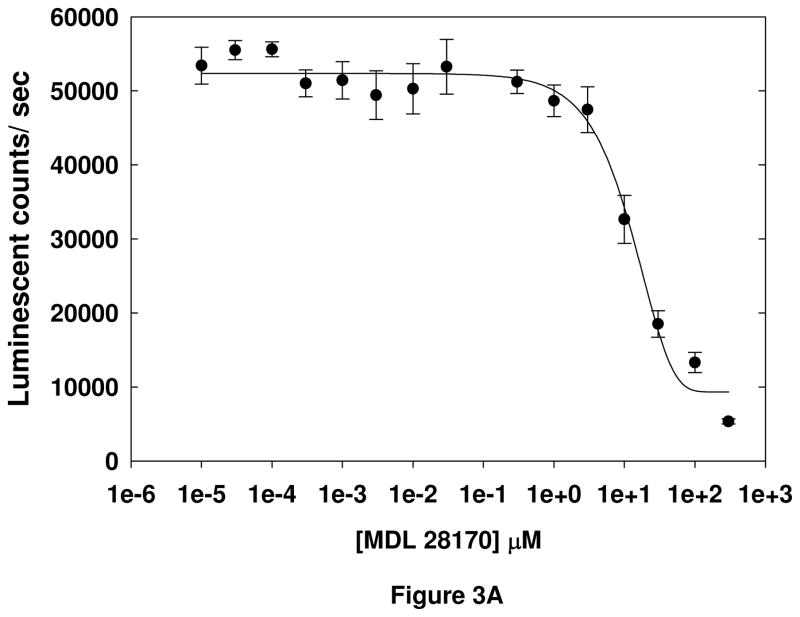
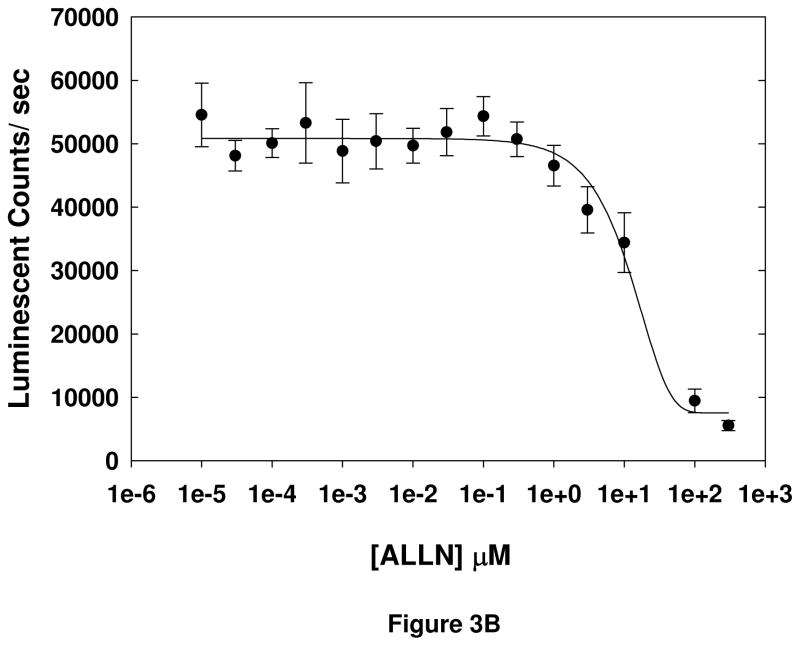
Finally, the dose-dependence of two known calpain inhibitors, MDL-28170 and ALLN, was tested in the cell-based assay (Figure 3). The EC50s of the inhibitors were found to be 14 ± 1.4 μM and 20 ± 4.2 μM (mean ± S.D.), respectively. These data, in conjunction with the results of the other validation experiments, indicate that the cell-based assay is detecting Aβ-induced calpain-dependent cleavage of an aminoluciferin-conjugated substrate, and that the assay can be used to identify inhibitors of Aβ-induced calpain activation.
Figure 3. Determination of EC50s of known calpain inhibitors.
EC50 values for MDL-28170 (A) and ALLN (B) were determined by treating SH-SY5Y cells with inhibitor for 30 minutes, followed by incubation with Suc-LLVY-aminoluciferin substrate for 30 minutes. SH-SY5Y cells were lysed in calpain lysis buffer and incubated with detection reagent for 15 minutes, and luminescence measured. Error bars represent the standard deviation among 8 replicate wells, and data are representative of the results of 2 separate experiments.
Optimization of the Assay for HTS
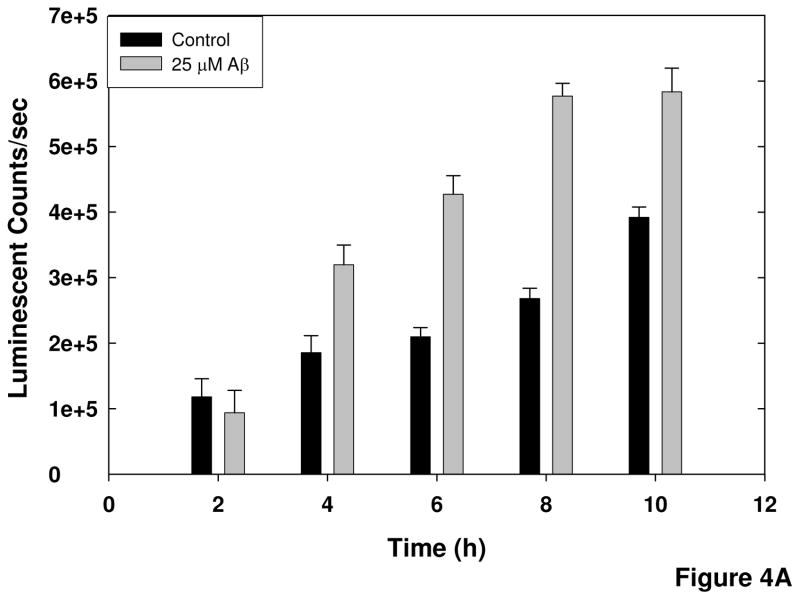
There were two major factors to be considered when optimizing this cell-based assay for high-throughput screening: time of exposure to the insult and cell density. The length of exposure of the cells to Aβ was critical, because an endpoint for the assay had to be selected when there was sufficient cleavage of the substrate to produce a consistently large change from control values but prior to the point when cell death occurs. The results in Figure 1 showed that there was little cell death by 18 hours of exposure to Aβ, but significant cell death (50%) by 24 hours. Therefore, time points between 0 and 12 hours of exposure to Aβ were tested (Figure 4A). There was some basal cleavage of the substrate occurring but, by 4 hours, there was 1.7-fold increase in calpain activity over control. At 8 hours a 3-fold increase in substrate cleavage was observed in Aβ-treated cells. This was the largest signal-to-background ratio during the time course and with a Z′ factor of 0.8, which is indicative of a good assay for screening, this time point was selected as the endpoint for the assay.
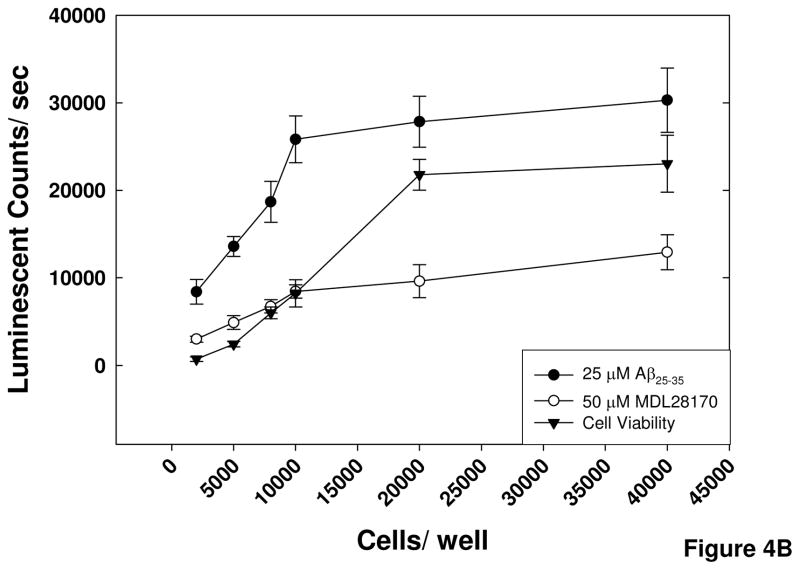
Figure 4. Optimization of assay parameters for screening.
A) Timecourse of Aβ-induced activation of calpain. SH-SY5Y cells were exposed to pre-aggregated Aβ25–35 for the indicated times following a 60 minute preincubation with MDL-28170 or DMSO vehicle and a 30 min preincubation with substrate. B) Determination of optimal cell density. Cells were plated at the indicated densities, and differentiated with retinoic acid. The calpain assay was performed as described in the Methods, with cell viability assayed in parallel. Error bars represent the standard deviation from 16 replicates, and data are representative of the results of 3 separate experiments.
The optimal cell density for the assay was selected by performing a cell titration experiment in which the Aβ-induced calpain activity in cells plated at densities ranging from 2500 to 40,000 cells per well in a 384-well plate was compared to calpain activity in cells exposed to MDL28170. Additionally, a cell viability assay was performed in parallel with the calpain assay to ascertain the viability of the SH-SY5Y cells at the different densities. The results of the cell viability assay show a linear increase in the number of cells in the range between 2500 and 20,000 cells per well. There was no difference in the signal produced in the wells with 20,000 and 40,000 cells, indicating that there may be reduced survival over the course of the experiment at densities greater than 20,000. The results of the calpain activity assay show the largest fold change (3-fold) between Aβ-treated cells and MDL28170-treated cells at a density of 10,000 cells per well; therefore this density was selected for the high-throughput assay (Figure 4B).
Based on the results of the optimization experiments, the optimal assay parameters are cells plated at 10,000 cell per well, incubated with 20 μM Suc-LLVY-aminoluciferin substrate, and exposed to Aβ25–35 for 8 hours in the presence or absence of test compound or known inhibitor. This protocol was implemented and a screen of approximately 120,000 compounds conducted to identify inhibitors of Aβ-induced calpain activity.
HTS for Inhibitors of β-amyloid-induced Calpain Activation
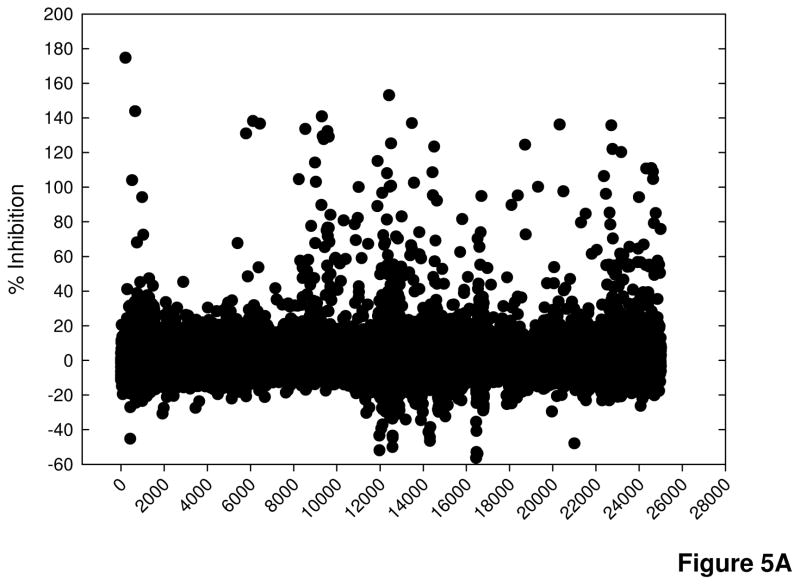
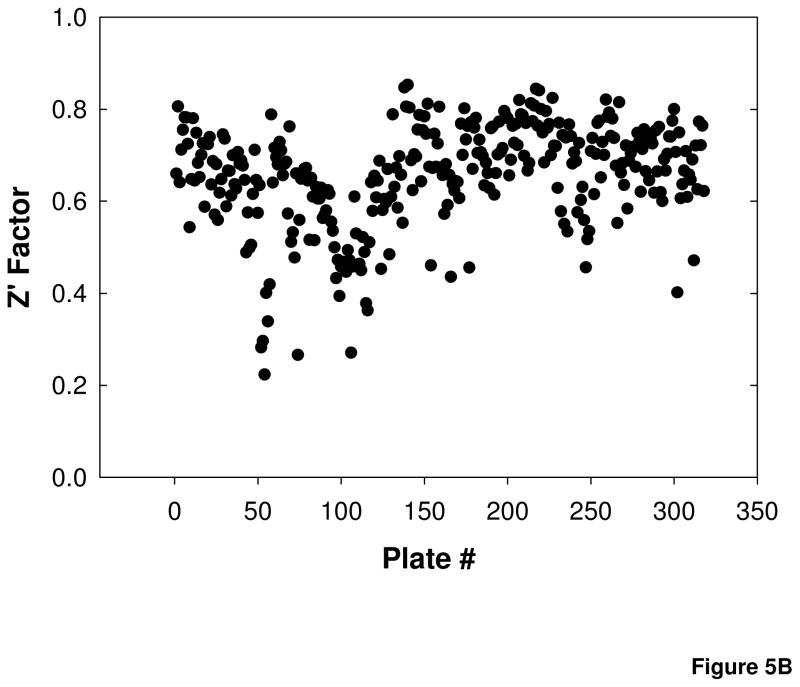
A compound library composed of approximately 120,000 compounds was screened in the cell-based calpain activity assay. The compounds were screened at an average final concentration of 1.4 μM (0.08% DMSO), with each plate containing 16 wells of the positive control for inhibition, 50 μM MDL28170, and 16 wells of 0.08% DMSO as a vehicle control. Pre-aggregated Aβ25–35 was added to all wells for a final concentration in the assay of 25 μM. The percent inhibition of luminescent signal in the test compound wells was determined relative to cells treated with 50 μM MDL28170 (100 % inhibition of calpain activity) and cells treated with Aβ25–35 alone (0 % inhibition as maximum calpain activation). Figure 5A shows the results from 25,000 compounds tested, which are representative of the entire screen. The Z′ factor, a statistical parameter for HTS assays that reflects the quality of the data for each assay plate based on the magnitude of the signal window between the positive and negative controls and the signal variability within the controls, was calculated (Zhang et al., 1999). In this assay, 90% of the plates had Z′ factors greater than 0.5 (Figure 5B). Those plates with Z′ factors less than 0.5 were repeated. Some variability during the screen may be due to the cell passage number, which may have contributed to variability in the cellular response to Aβ, or to decreased signal strength related to freezing and thawing the luciferase detection reagent between screening sets.
Figure 5. Screen results.
A) Percent inhibition of 25000 compounds screened at 1.4 μM concentration. Data are representative of ~ 120,000 compounds screened. B) Z′ factor values for 329 plates screened.
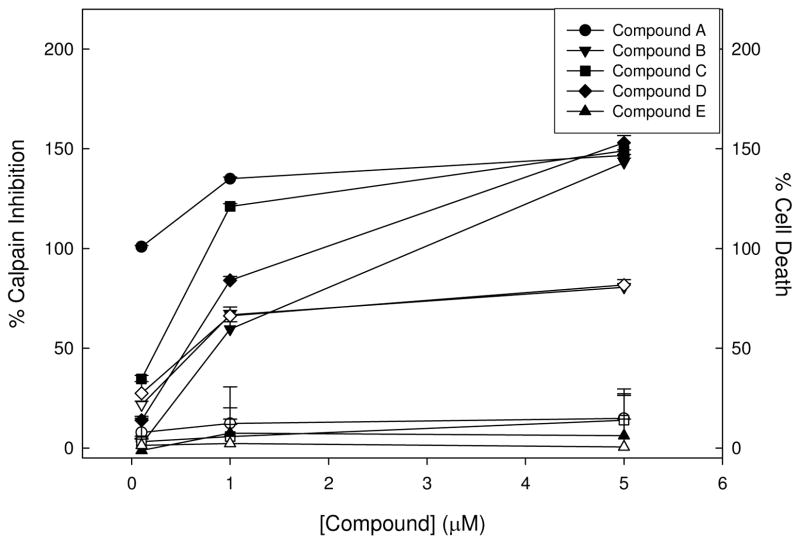
Of the 120,000 compounds screened, 353 compounds exhibiting ≥60 % inhibition, which is 3x the standard deviation from the mean of the DMSO vehicle controls, were considered hits, representing 0.29% of the library. These compounds were then re-tested for dose-dependence of response at final assay concentrations of 0.1, 1, and 5 μM in the same primary assay to prioritize compounds. Because the signal is dependent on the viability of the cells, i.e., cell death would reduce the luminescent signal in the assay, a cytotoxicity assay to determine cell viability following 8 h exposure to the compounds was performed in parallel to the dose-response experiments. The results shown in Figure 6 are from representative compounds obtained in the confirmation experiments. Figure 6 shows compounds that inhibited calpain in a dose-dependent manner and were not toxic (Compounds A & C) as well as compounds that inhibited the signal in the primary screening assay and were toxic (Compound B & D). Additionally, some compounds that inhibited in the primary screen assay did not confirm (Compound E). Of the 353 compounds selected for re-testing, 80% (284 compounds) confirmed activity and inhibited calpain activity in the cell-based assay, and 50% of these showed some toxicity (142). Following these experiments the compounds were re-evaluated for physical chemical properties (i.e. lacks reactive functional groups or other undesirable molecular motifs) and 24 compounds that exhibited potent inhibition of calpain and no toxicity were further investigated.
Figure 6. Confirmation of selected compounds exhibiting ≥ 60% inhibition in the primary screen.
Compounds were plated at 3 concentrations to confirm activity and determine dose-dependence of calpain inhibition (filled symbols) and the assay was performed as described for the screen. Cytotoxicity experiments were conducted in tandem (open symbols). Error bars represent the standard deviation in percent inhibition among 4 replicates for each concentration.
Hit Confirmation and Preliminary Mechanistic Studies
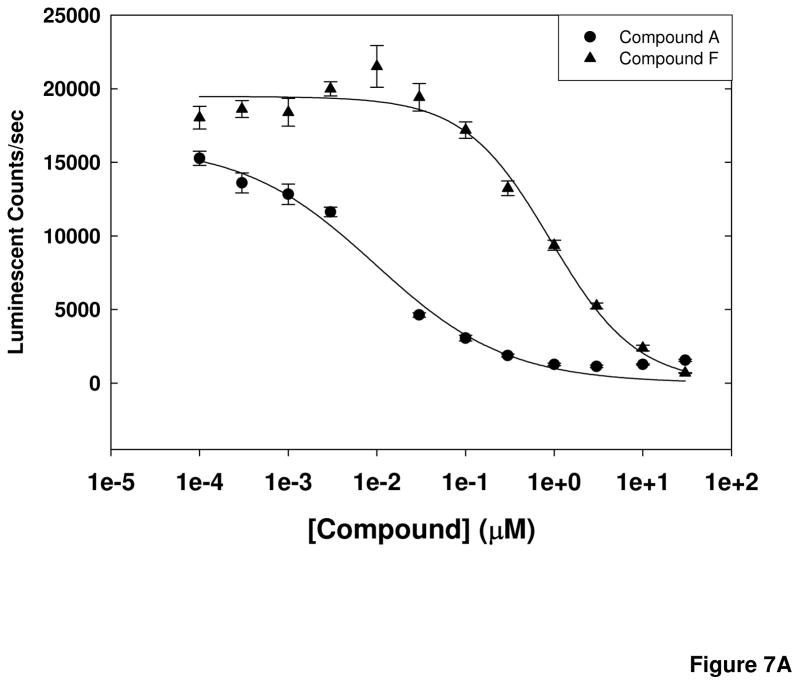
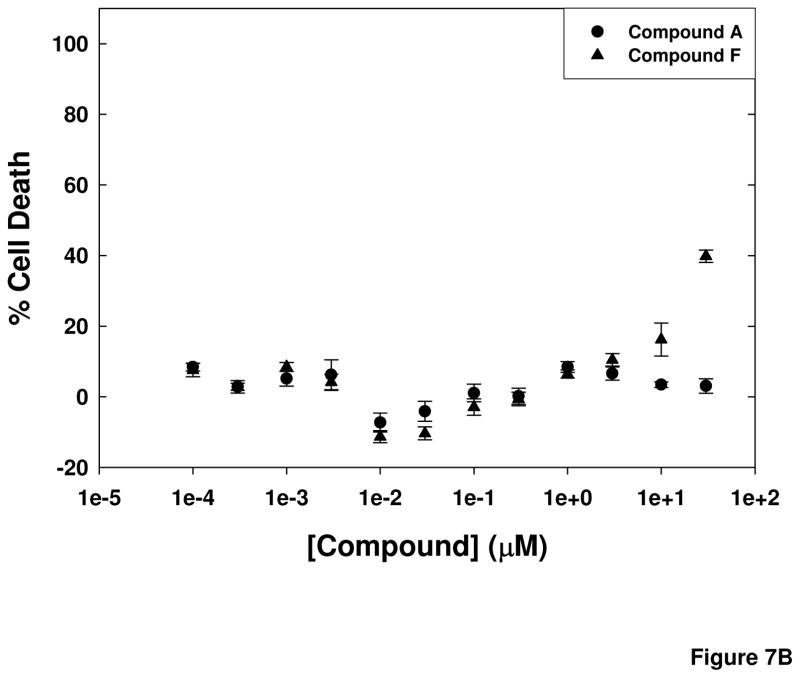
Compounds from the primary screen that had been selected for further investigation were evaluated for full concentration response ranging from 1 nM to 30 μM to obtain EC50 values in the cell-based assay. In parallel, cell viability experiments were performed following 24 h incubations of the cells with the compound to prioritize hits further. Representative results for 2 compounds, Compound A and Compound F, are shown in Figure 7. These compounds had Ec50 values for inhibition of cellular calpain of 9.4 ± 1.4 nM and 840 ± 162 nM, respectively. The EC50 values for calpain inhibition by the selected compounds ranged from 8 nM to 10 μM, with most compounds exhibiting no toxicity after a 24-h exposure at concentrations up to 30 μM.
Figure 7. Cell-based calpain assay EC50 values and cell toxicity of selected compounds.
(A) Compounds were assayed at concentrations ranging from 1 nM to 30 μM in the cell-based calpain activity assay. Representative results are shown for 2 compounds tested. (B) Cell toxicity of the compounds was determined at 24 h of exposure using an assay that measures generation of ATP by the cells. Representative results for the same 2 compounds as in (A) are shown as % cell death.
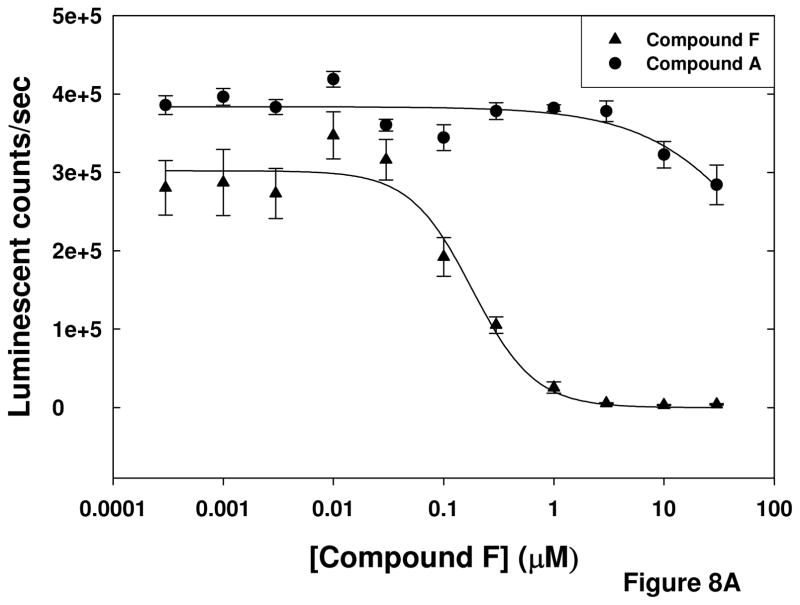
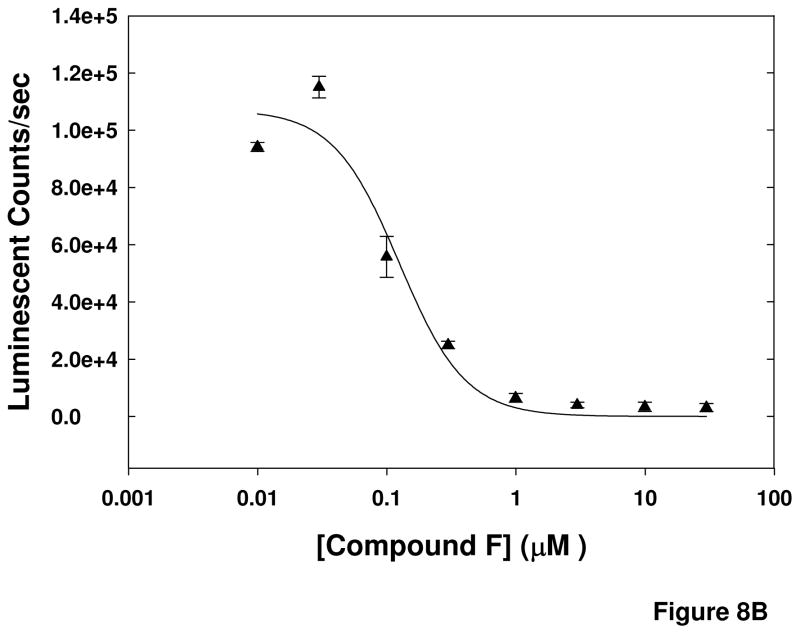
Additional experiments were performed to probe the mechanism-of-action of the compounds. The cell-based assay used for the primary screen was designed to identify compounds that inhibited calpain activity either by directly interacting with the enzyme or by indirectly modulating the activity, potentially by preventing the increase in intracellular Ca2+ by Aβ that leads to calpain activation. To determine if a specific compound was a direct inhibitor of calpain or had an alternate target in the pathway resulting in calpain activation, the compounds were tested in a purified calpain activity assay. The results in Figure 8A are representative of one compound (Compound F) that inhibited the luminescent signal generated in the purified enzyme assay, as well as one that did not (Compound A). Six compounds were found to reduce the signal generated in the purified calpain activity assay; however these compounds failed to inhibit in a similar assay utilizing an AMC-conjugated substrate (data not shown). This suggests that the inhibition by these compounds in the primary screen assay, as well as in the purified calpain II activity assay utilizing the aminoluciferin-conjugated substrate, could be due to inhibition of the luciferase detection of the luciferin rather than inhibition of the calpain activity that produces luciferin. This was confirmed by testing the compounds in an experiment in which the compounds were added to the reaction mixture after the completion of the calpain reaction that produces the luciferin product. In this experiment, the compounds reduced the luminescent signal even though the substrate had already been cleaved and the luciferin substrate produced. The results presented in Figure 8B are those of Compound F, which had an IC50 value of 115 ± 14.2 nM when added to the reaction mixture after completion of the reaction, compared to an IC50 of 130 ± 20.6 nM when incubated with the enzyme prior to addition of the substrate and Ca2+. The similarity in magnitude between the IC50 values for the assays suggests that the effect of the compound on the luminescent signal is entirely due to its effect on the detection system. Therefore, these six compounds were determined not to be direct calpain inhibitors after all. The remaining compounds were classified as indirect inhibitors of calpain.
Figure 8. Purified calpain II activity assay EC50 values of selected.
compounds. Two compounds were assayed at concentrations ranging from 1 nM to 30 μM against purified calpain II. Panel A shows results of compound incubation with enzyme for 30 minutes prior to addition of substrate and Ca2+. Compound F is representative of compounds that reduced the luciferase signal in the assay and Compound A is representative of compounds that did not affect the signal. Panel B shows results of compound addition following completion of the enzyme reaction, indicating that reduction of the luciferase signal by Compound F is a result of inhibition of the detection system, not the activity of the calpain enzyme.
Conclusions
We have adapted an assay initially designed for monitoring calpain enzyme activity to an assay that monitors calpain activity within the cell. The assay uses luciferase detection of the cleavage of an exogenous cell-permeable calpain substrate, Suc-LLVY-aminoluciferin, producing free aminoluciferin in the cell. This assay was used to detect calpain activation after cells are exposed to exogenous pre-aggregated Aβ25–35, and it was optimized for use in a high-throughput screening platform to identify inhibitors of calpain activity in a compound library of approximately 120,000 compounds. Screening a compound library with a cell-based assay is advantageous in that compounds that act upstream of the assay’s read-out (in this case calpain activity) can be identified in addition to compounds that directly interact with the target molecule to affect its activity. From the screening effort, 142 compounds were found that exhibited calpain inhibition activity in a dose-dependent manner with no toxicity in SH-SY5Y cells. This included a compound with a 9 nM EC50. Compounds with favorable chemical structure were selected based on potency in the calpain assay for further investigation. Selected compounds were tested in a purified calpain II activity assay utilizing luminescent detection of free aminoluciferin, the cleavage product of the calpain reaction. Only six of the 24 compounds were found to reduce the luminescent signal generated in this assay, and these were shown to directly inhibit the detection of aminoluciferin rather than its production. This suggests that these compounds were not affecting calpain activity. The remaining compounds are proposed to be acting upstream of calpain activation in the cell, perhaps by modulating the loss of Ca2+ homeostasis that occurs in cells exposed to Aβ. Studies to elucidate the structure activity relationship of the best series are in progress. The mechanism-of-action of the most potent of these compounds, including identification of the molecular targets by generating affinity reagents, are underway. The goal of these studies is to develop a novel therapeutic for Alzheimer’s disease.
References
- 1.Alvarez A, Toro R, Caceres A, Maccioni RB. Inhibition of tau phosphorylating protein kinase cdk5 prevents beta-amyloid-induced neuronal death. FEBS Lett. 1999;459:421–426. doi: 10.1016/s0014-5793(99)01279-x. [DOI] [PubMed] [Google Scholar]
- 2.Chen M, Durr J, Fernandez HL. Possible role of calpain in normal processing of beta-amyloid precursor protein in human platelets. Biochem Biophys Res Commun. 2000;273:170–175. doi: 10.1006/bbrc.2000.2919. [DOI] [PubMed] [Google Scholar]
- 3.Crocker SJ, Smith PD, Jackson-Lewis V, et al. Inhibition of calpains prevents neuronal and behavioral deficits in an MPTP mouse model of Parkinson’s disease. J Neurosci. 2003;23:4081–4091. doi: 10.1523/JNEUROSCI.23-10-04081.2003. [DOI] [PMC free article] [PubMed] [Google Scholar]
- 4.Donkor IO. A survey of calpain inhibitors. Curr Med Chem. 2000;7:1171–1188. doi: 10.2174/0929867003374129. [DOI] [PubMed] [Google Scholar]
- 5.Encinas M, Iglesias M, Liu Y, Wang H, Muhaisen A, Cena V, Gallego C, Comella JX. Sequential treatment of SH-SY5Y cells with retinoic acid and brain-derived neurotrophic factor gives rise to fully differentiated, neurotrophic factor-dependent, human neuron-like cells. J Neurochem. 2000;75:991–1003. doi: 10.1046/j.1471-4159.2000.0750991.x. [DOI] [PubMed] [Google Scholar]
- 6.Feinstein SC, Wilson L. Inability of tau to properly regulate neuronal microtubule dynamics: a loss-of-function mechanism by which tau might mediate neuronal cell death. Biochim Biophys Acta. 2005;1739:268–279. doi: 10.1016/j.bbadis.2004.07.002. [DOI] [PubMed] [Google Scholar]
- 7.He LM, Chen LY, Lou XL, Qu AL, Zhou Z, Xu T. Evaluation of beta-amyloid peptide 25–35 on calcium homeostasis in cultured rat dorsal root ganglion neurons. Brain Res. 2002;939:65–75. doi: 10.1016/s0006-8993(02)02549-0. [DOI] [PubMed] [Google Scholar]
- 8.Humbert S, Dhavan R, Tsai L. p39 activates cdk5 in neurons, and is associated with the actin cytoskeleton. J Cell Sci. 2000;113 (Pt 6):975–983. doi: 10.1242/jcs.113.6.975. [DOI] [PubMed] [Google Scholar]
- 9.Kelly BL, Vassar R, Ferreira A. Beta-amyloid-induced dynamin 1 depletion in hippocampal neurons. A potential mechanism for early cognitive decline in Alzheimer disease. J Biol Chem. 2005;280:31746–31753. doi: 10.1074/jbc.M503259200. [DOI] [PMC free article] [PubMed] [Google Scholar]
- 10.Knoblach SM, Alroy DA, Nikolaeva M, Cernak I, Stoica BA, Faden AI. Caspase inhibitor z-DEVD-fmk attenuates calpain and necrotic cell death in vitro and after traumatic brain injury. J Cereb Blood Flow Metab. 2004;24:1119–1132. doi: 10.1097/01.WCB.0000138664.17682.32. [DOI] [PubMed] [Google Scholar]
- 11.Kusakawa G, Saito T, Onuki R, Ishiguro K, Kishimoto T, Hisanaga S. Calpain-dependent proteolytic cleavage of the p35 cyclin-dependent kinase 5 activator to p25. J Biol Chem. 2000;275:17166–17172. doi: 10.1074/jbc.M907757199. [DOI] [PubMed] [Google Scholar]
- 12.Lee KY, Clark AW, Rosales JL, Chapman K, Fung T, Johnston RN. Elevated neuronal Cdc2-like kinase activity in the Alzheimer disease brain. Neurosci Res. 1999;34:21–29. doi: 10.1016/s0168-0102(99)00026-7. [DOI] [PubMed] [Google Scholar]
- 13.Lee MS, Kwon YT, Li M, Peng J, Friedlander RM, Tsai LH. Neurotoxicity induces cleavage of p35 to p25 by calpain. Nature. 2000;405:360–364. doi: 10.1038/35012636. [DOI] [PubMed] [Google Scholar]
- 14.Li G, Faibushevich A, Turunen BJ, Yoon SO, Georg G, Michaelis ML, Dobrowsky RT. Stabilization of the cyclin-dependent kinase 5 activator, p35, by paclitaxel decreases beta-amyloid toxicity in cortical neurons. J Neurochem. 2003;84:347–362. doi: 10.1046/j.1471-4159.2003.01526.x. [DOI] [PubMed] [Google Scholar]
- 15.Lin GD, Chattopadhyay D, Maki M, et al. Crystal structure of calcium bound domain VI of calpain at 1.9 A resolution and its role in enzyme assembly, regulation, and inhibitor binding. Nat Struct Biol. 1997;4:539–547. doi: 10.1038/nsb0797-539. [DOI] [PubMed] [Google Scholar]
- 16.Mattson MP, Cheng B, Davis D, Bryant K, Lieberburg I, Rydel RE. beta-Amyloid peptides destabilize calcium homeostasis and render human cortical neurons vulnerable to excitotoxicity. J Neurosci. 1992;12:376–389. doi: 10.1523/JNEUROSCI.12-02-00376.1992. [DOI] [PMC free article] [PubMed] [Google Scholar]
- 17.Nakagawa T, Yuan J. Cross-talk between two cysteine protease families. Activation of caspase-12 by calpain in apoptosis. J Cell Biol. 2000;150:887–894. doi: 10.1083/jcb.150.4.887. [DOI] [PMC free article] [PubMed] [Google Scholar]
- 18.Patrick GN, Zukerberg L, Nikolic M, de la Monte S, Dikkes P, Tsai LH. Conversion of p35 to p25 deregulates Cdk5 activity and promotes neurodegeneration. Nature. 1999;402:615–622. doi: 10.1038/45159. [DOI] [PubMed] [Google Scholar]
- 19.Pike CJ, Walencewicz AJ, Glabe CG, Cotman CW. In vitro aging of beta-amyloid protein causes peptide aggregation and neurotoxicity. Brain Res. 1991;563:311–314. doi: 10.1016/0006-8993(91)91553-d. [DOI] [PubMed] [Google Scholar]
- 20.Saito K, Elce JS, Hamos JE, Nixon RA. Widespread activation of calcium-activated neutral proteinase (calpain) in the brain in Alzheimer disease: a potential molecular basis for neuronal degeneration. Proc Natl Acad Sci U S A. 1993;90:2628–2632. doi: 10.1073/pnas.90.7.2628. [DOI] [PMC free article] [PubMed] [Google Scholar]
- 21.Schumacher PA, Siman RG, Fehlings MG. Pretreatment with calpain inhibitor CEP-4143 inhibits calpain I activation and cytoskeletal degradation, improves neurological function, and enhances axonal survival after traumatic spinal cord injury. J Neurochem. 2000;74:1646–1655. doi: 10.1046/j.1471-4159.2000.0741646.x. [DOI] [PubMed] [Google Scholar]
- 22.Shaw E. Peptidyl diazomethanes as inhibitors of cysteine and serine proteinases. Methods Enzymol. 1994;244:649–656. doi: 10.1016/0076-6879(94)44048-4. [DOI] [PubMed] [Google Scholar]
- 23.Siman R, Card JP, Davis LG. Proteolytic processing of beta-amyloid precursor by calpain I. J Neurosci. 1990;10:2400–2411. doi: 10.1523/JNEUROSCI.10-07-02400.1990. [DOI] [PMC free article] [PubMed] [Google Scholar]
- 24.Simpson PB, Bacha JI, Palfreyman EL, Woollacott AJ, McKernan RM, Kerby J. Retinoic acid evoked-differentiation of neuroblastoma cells predominates over growth factor stimulation: an automated image capture and quantitation approach to neuritogenesis. Anal Biochem. 2001;298:163–169. doi: 10.1006/abio.2001.5346. [DOI] [PubMed] [Google Scholar]
- 25.Taniguchi S, Fujita Y, Hayashi S, et al. Calpain-mediated degradation of p35 to p25 in postmortem human and rat brains. FEBS Lett. 2001;489:46–50. doi: 10.1016/s0014-5793(00)02431-5. [DOI] [PubMed] [Google Scholar]
- 26.Tsai LH, Delalle I, Caviness VS, Jr, Chae T, Harlow E. p35 is a neural-specific regulatory subunit of cyclin-dependent kinase 5. Nature. 1994;371:419–423. doi: 10.1038/371419a0. [DOI] [PubMed] [Google Scholar]
- 27.Wang KK, Posner A, Raser KJ, et al. Alpha-mercaptoacrylic acid derivatives as novel selective calpain inhibitors. Adv Exp Med Biol. 1996;389:95–101. doi: 10.1007/978-1-4613-0335-0_11. [DOI] [PubMed] [Google Scholar]
- 28.Yankner BA. Mechanisms of neuronal degeneration in Alzheimer’s disease. Neuron. 1996;16:921–932. doi: 10.1016/s0896-6273(00)80115-4. [DOI] [PubMed] [Google Scholar]
- 29.Yankner BA, Dawes LR, Fisher S, Villa-Komaroff L, Oster-Granite ML, Neve RL. Neurotoxicity of a fragment of the amyloid precursor associated with Alzheimer’s disease. Science. 1989;245:417–420. doi: 10.1126/science.2474201. [DOI] [PubMed] [Google Scholar]
- 30.Zhang JH, Chung TD, Oldenburg KR. A Simple Statistical Parameter for Use in Evaluation and Validation of High Throughput Screening Assays. J Biomol Screen. 1999;4:67–73. doi: 10.1177/108705719900400206. [DOI] [PubMed] [Google Scholar]


