

Abstract
Nonribosomal peptides (NRPs) are of great pharmacological importance, but there is currently no technology for high-throughput NRP dereplication and sequencing. We employ multi-stage mass spectrometry followed by spectral alignment algorithms for sequencing of cyclic NRPs. We also present an algorithm for comparative NRP dereplication that establishes similarities between newly isolated and previously identified similar but non-identical NRPs, substantially reducing dereplication efforts..
The classical protein synthesis pathway (translation of template mRNA) is not the only mechanism for cells to assemble amino acids into proteins/peptides. Nonribosomal peptide synthesis is performed by Nonribosomal Peptide Synthetases (NRPS) that represent both the mRNA-free template and building machinery for the peptide biosynthesis1. NRPS produce nonribosomal peptides (NRP) that are not directly inscribed in genomes and thus cannot be inferred with traditional DNA sequencing. NRPs are of great pharmacological importance since they were optimized by evolution for chemical defense and communication. Starting from penicillin, NRPs and other natural products have an unparalleled track record in pharmacology: most anti-cancer and anti-microbial agents are natural products or their derivatives2. NRPs include antibiotics, antiviral and antitumor agents, immunosuppressors, and toxins.
Most NRPs contain non-standard amino acids, increasing the number of possible building blocks from 20 (in standard ribosomal peptides) to several hundred. Previous methods for NRP characterization are based on Nuclear Magnetic Resonance (NMR) and are time consuming and error prone3,4,5. Therefore, there is a need for the efficient structure elucidation of NRPs. Furthermore, significant efforts in activity screening can be saved if newly isolated compounds can be rapidly associated to a known compound by ‘dereplication’6.
In a pioneering study7, a cyclic algal peptide was linearized and manually sequenced using tandem mass spectrometry (MS2). This approach, while successful, did not result in a robust NRP sequencing technique since most NRPs evade linearization attempts. Hormothamnin A represents another example of MS-based NRP sequencing8. Barber et al.,9 analyzed spectra of an antimicrobial agent tyrothricin, a mixture of different NRPs, and used previously identified components of tyrothricin to manually derive other variants. Hitzeroth et al., 200510 resequenced new variations of streptocidins using a similar strategy but commented that it is limited to peptides with standard amino acids.
We show how to compare spectra of similar but non-identical NRPs, enabling ‘comparative dereplication’ that establishes the similarity between a newly isolated and a previously identified similar (rather than identical) compound. Since many NRPs are produced as related analogs (e.g., 61 out of 90 cyanopeptides recently identified in drinking water represented variants of known peptides11), comparative dereplication can reduce NRP characterization efforts from weeks to minutes. For example, cyanopeptide X represented an unknown bioactive compound (currently known as desmethoxymajusculamide C) when this project started in 2007 but was sequenced using NMR in 2008. The effort invested in analyzing this NRP in 2007 would have been saved if our algorithm NRP-Dereplication were available. Indeed, NRP-Dereplication revealed that it is related to majusculamide C. Another example is compound 879 that was assumed to be novel but was found to be known during the patent application. NRP-Dereplication revealed that it is neoviridogrisen. NRP-Dereplication derives a sequence of an unknown compound given a database of known cyclic peptides (provided a related peptide is known). In the cases when no related NRPs are known, we performed de novo sequencing with NRP-Sequencing algorithms (a self-alignment based algorithm) and NRP-Tagging (an approach that uses frequently occurring amino acid tags for peptide reconstruction). We further illustrate reconstruction of cyanopeptide X, the first report of automated de novo reconstruction of a cyclic peptide by mass spectrometry.
When analyzing a cyclic peptide using mass spectrometry, the MS2 stage amounts to breaking (linearizing) the cyclic peptide into linear peptides with the same parent mass (Figure 1a–e). The mixture of these peptides is further subjected to the next stage of mass spectrometry (MS3) resulting in the difficult problem of interpreting a MS3 spectrum of different (but related) peptides. The theoretical MS3 spectrum Spectrum(P) of the cyclic peptide P = p1…pn is thus the superposition of the theoretical spectra Spectrum(Pi) of n linear peptides Pi = pi…pnp1…pi−1 (Figure 1a–e and Supplementary Figure 1).
Figure 1.
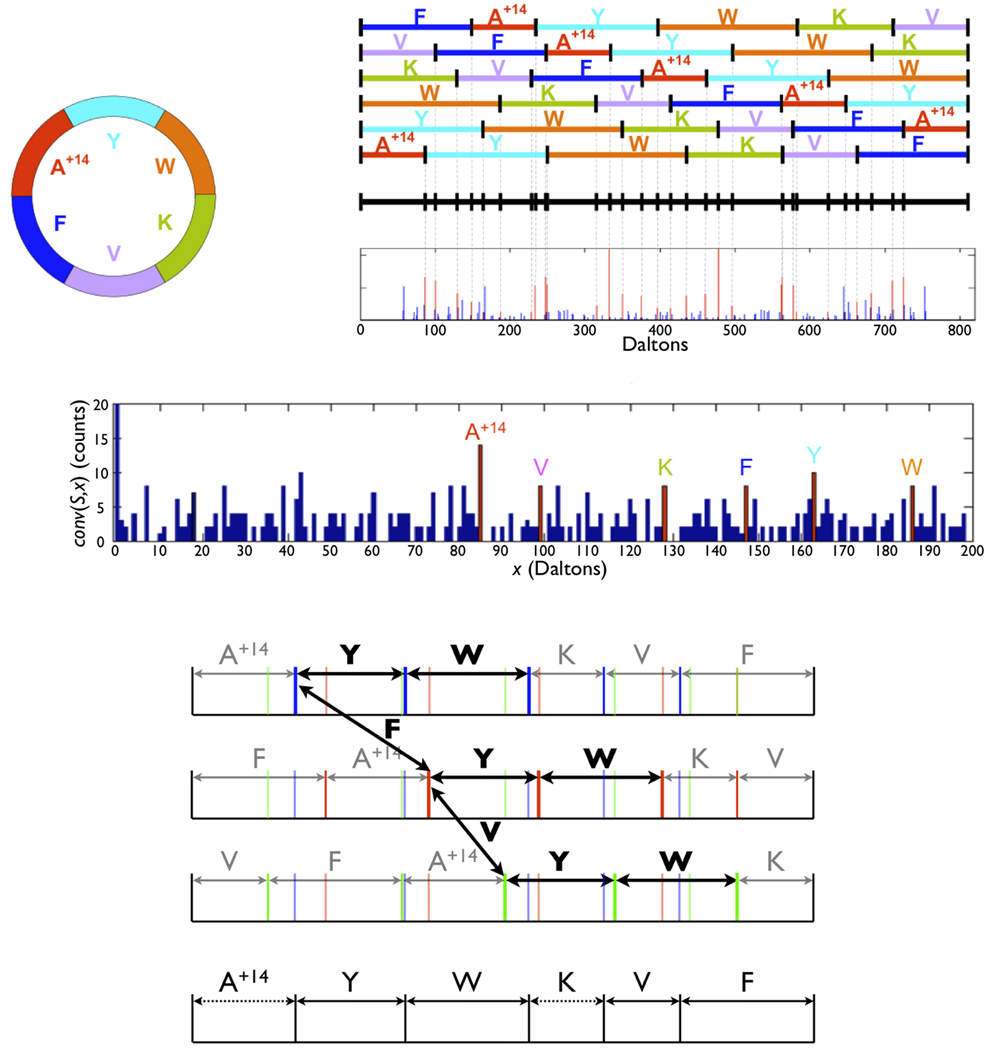
Experimental and theoretical spectra of seglitide Cyclic(N-methyl-Ala, Tyr, D-Trp, Lys, Val, Phe (a) Cyclic diagram of seglitide. A+14 denotes a methylated alanine; the integer residue masses are 85, 163, 186, 128, 99 and 147. (b) MS2 fragmentation of seglitide generates up to 6 linear peptides representing different linearized variants of the same cyclic peptide. (c) The theoretical spectrum for seglitide is a superposition of the fragment masses from the linearized peptide. (d) Experimental spectrum of seglitide (the peaks corresponding to prefix masses are shown in red). (e) The auto-convolution of the spectrum in insert d has prominent peaks for offsets corresponding to masses of amino acids (shown in red). The peak at 0 is truncated. (f) Generation of a gapped peptide from a theoretical spectrum of seglitide. The theoretical spectrum is colored to highlight various linear peptides. For illustration purposes only 3 linearized (A+14YWKV (blue), FA+14YWKV (red) and VFA+14YWK (green)) versions of the cyclic peptide are shown. The frequent 2-amino-acid tag YW is observed in 3 different locations in the spectrum. Additionally, the offsets between 3 consecutive locations of tag YW reveal the masses of amino acids F and V. (g) The gapped peptide constructed from f combines YW (derived from a frequent tag) with VF (derived from the inter distances between tag locations). A+14 and K are inferred from the flanking masses of YW and VF. The complete sequence A+14YWKVF is recovered, but gaps may be generated.
Comparative dereplication can be formulated as the Cyclic Peptide Dereplication Problem (CPDP): Given an experimental spectrum S, a cyclic peptide P, and a parameter k (maximum number of mutations/modifications), find a cyclic peptide P' with at most k mutations/modifications from P that maximizes the number of shared masses between S and the theoretical spectrum of P'.
We address the CPDP for the most relevant case k ≤ 1. Given the MS3 spectrum of an unknown peptide P', and the sequence of a known peptide P that differs from P' by a single mutation at an unknown position x, NRP-Dereplication derives P'. NRP-Dereplication is based on the observation that most peaks shared between the experimental spectrum of P' and theoretical spectrum P correspond to subpeptides that do not contain position x (δ-correlated subpeptides). Conversely, most peaks in the experimental spectrum P' that differ from the peaks in the theoretical spectrum of P by δ= Mass(P') − Mass(P) correspond to subpeptides that contain position x (δ-correlated subpeptides). The coverage of a position x is defined as the number of 0-correlated subpeptides containing that position, plus the number of δ-correlated subpeptides not containing that position. Thus, correlated subpeptides (both 0-correlated and δ-correlated) have a potential to reveal the differing amino acid as the amino acid with the minimum coverage. For example, the drop in coverage at ornithine (Supplementary Figure 2) allows one to dereplicate the experimental spectrum of tyrocidine C1 using sequence of tyrocidine C (data acquisition methods are detailed in the Online Methods).
Since the peptide P to be used for dereplication is not known in advance, every NRP spectrum needs to be compared against a database of known cyclic peptides such as NORINE12. NRP-Dereplication is able to localize the single mutation using the top scoring peptide in NORINE (Supplementary Table 1).
The tyrocidine family presents an ideal test for NRP-Dereplication since tyrocidine A, B and C are in NORINE, while tyrocidines A1, B1 and C1 are not. NRP-Dereplication shows that spectra from tyrocidine A, B and C have top hits corresponding to NORINE peptides, while their A1, B1 and C1 counterparts are mapped to high-scoring matches with one mutation (Supplementary Table 1). NRP-Dereplication also localizes the position with minimum coverage as the mutated position (which was correctly identified for all compounds we analyzed). NRP-Dereplication generated only two high-scoring false hits representing very short peptides (H8495 and BQ123), but closer examination reveals that the matches are correlated to the query peptides.
In the case when no related peptide is known (and thus NRP-Dereplication is not applicable), we address the following Cyclic Peptide Sequencing Problem (CPSP): Given an experimental spectrum S, find a cyclic peptide P maximizing the number of shared masses between S and the theoretical spectrum of P.
Reconstructing the cyclic peptide P from its theoretical spectrum Spectrum(P) amounts to the cyclic version of the Partial Digest Problem (PDP)13. However, it is not clear how to extend the algorithms for the PDP13,14 to a cyclic setup. Furthermore, reconstructing P from its experimental MS3 spectrum S is a difficult problem since the contributions of different linear versions of P to the experimental spectrum are non-uniform.
Pevzner et al., 200015 introduced spectral convolution and spectral alignment for revealing similarities between related but different spectra. Since an MS3 spectrum of a cyclic peptide is a superposition of spectra of related linearized peptides, spectral auto-convolution and auto-alignment reveal key features of the cyclic peptide.
The auto-convolution of a spectrum S with offset x is defined as the number of masses s in S such that s − x is also a mass in S; the cyclic auto-convolution Conv(S,x) is defined as the number of masses s in S such that either (s − x) or (s − x) + PrecursorMass(S) is also a mass in S. For example, high scoring positions of the auto-convolution of seglitide reveal masses of amino acids of the NRP (Figure 1e). Furthermore, the largest peak Conv(S,85) = 14 corresponds to the mass of the methylated alanine (A+14). The other five amino acids in seglitide also correspond to prominent peaks at positions 99, 128, 147, 163, and 186 with Conv(S,x) ≥ 8. Spectral auto-convolution (Figure 1e) represents a computational approach to deriving residue masses of cyclic peptides.
The auto-alignment of a spectrum S with offset x is defined as the set of peaks Sx = {s : s ∈ S and (s − x) ∈ S}. We view auto-alignment as a virtual spectrum with parent mass PrecursorMass(S) − x (Supplementary Figure 5). For Seglitide, S85 (x=85 maximizes Conv(S,x) for seglitide) corresponds to the alignment between A+14YWKVF and YWKVFA+14.
Using the concepts of auto-convolution and auto-alignment, we present NRP-Sequencing, an algorithm to solve the CPSP that does not require prior knowledge of the amino acid masses in the compound. NRP-Sequencing first uses the MS3 auto-convolution to derive the set of possible amino acid masses and then uses the MS3 auto-alignment using the top k possible offset masses, x, to construct a consensus spectrum Sx for each x. NRP-Sequencing further generates all possible reconstructions for each Sx and reranks all generated cyclic peptides according to their matches to the MSn spectra (for n = 3, 4, 5). More details on NRP-Sequencing are given in the online methods, Supplementary figures 3–5, Supplementary Note, [Correct? or please cite appropriate figures]. In default mode, NRP-Sequencing selects the masses of the top 20 auto-convolution masses in the interval [57, 200] Da and combines them with the masses of standard amino acids. It turns out that NRP-sequencing is able to generate the correct sequence (among the set of generated reconstructions) in all cases when the resulting set of masses contains all amino acid masses in the NRP (11 out of 18 compounds). Moreover, in almost all cases the correct sequences were ranked as the top-scoring reconstruction (Supplementary Table 2). However, the success of NRP-Sequencing is constrained by the ability to determine all amino acid masses by auto-convolution. Below we describe NRP-Tagging that addresses this limitation.
Because some positions are less prone to breakage than others, reconstruction of all amino acids masses in NRP using auto-convolution may be an unattainable goal. NRP-Tagging attempts to reconstruct gapped peptides from MS3 spectra of cyclic peptides (Figure 1g).
Spectra of cyclic peptides are superpositions of related (cyclically shifted) linear peptides that tend to have the same tags repeated in the spectrum. Given an MS3 spectrum, we find all 2-amino-acid tags XY (defined by triplets of peaks s, s+X, s+X+Y in the spectrum) and select all frequent tags (e.g., tags repeated 3 or more times). For example, if a tag XY starts at positions s, s+A and s+A+B, then masses A and B may represent two other (adjacent) amino acids in the cyclic peptide (Figure 1g). NRP-Tagging first constructs a gapped peptide (e.g., [85,163,186,128,246] for Seglitide) and further attempts to extend it into full-length de novo reconstructions (e.g., [85,163,186,128,99,147]). Since gapped peptides often contain masses representing combined masses of adjacent amino acids (e.g., 246 = 99 + 147), NRP-Tagging attempts to partition each mass in the gapped peptide into smaller masses (the algorithm is detailed in the online methods). Similar to algorithms for sequencing linear peptides, NRP-Tagging typically brings the correct peptide close to the top of the list of the high-scoring peptides (Table 1). This feature facilitates further analysis of NRPs, e.g., it allows one to correlate high-scoring reconstructions with NMR data. Moreover, the top-scoring peptide returned by NRP-Tagging typically have minor differences as compared to the correct peptide, e.g., combining masses of adjacent amino acids or choosing a mass of isotopic amino acid.
Table 1.
NRP-Tagging results. The reconstructed NRPs are represented as sequences of masses. For the sake of brevity, masses are rounded to integers. Actual sequenced masses are float point numbers. Composite masses (2 or more amino acids) are enclosed in square brackets. For example, [114+57] in cyanopeptide × means that NRP-Tagging returned 171 as the mass of an amino acid instead of the correct masses 114 and 57 (Hmp and Gly). Incorrect masses are enclosed in curly brackets and expressed in terms of their offsets from correct masses. For example,{97+1} in H3526 means that NRP-Tagging returned 98 while the correct mass is 97 (Pro). In this case the isotopic peak (rather than a b-ion) was chosen as the best spectral interpretation. Lastly, cases in which the algorithm splits a mass are enclosed in angle brackets with the correct mass followed by the masses returned by the algorithm. A single mass 286 in cyclomarin A is split as 129, 157. A single mass 222-18 (water loss) in compound 879 is split into 100 and 104. The reconstructions given in the table represent a complete reconstruction of the compound, or a reconstruction with composite masses and/or masses with a known offset. The “Best reconstruction" column presents the high-scoring peptide with a specified rank (“Rank column") that is selected from the list of all top-scoring peptides as the most similar to the correct peptide.
| Compound | Best reconstruction | Rank |
|---|---|---|
| Tyrocidine A | 99, 114, 113, 147, 97, 147, 147, 114, 128, 163 | 3 |
| Tyrocidine A1 | 99, 128, 113, 147, 97, 147, 147, 114, 128, 163 | 16 |
| Tyrocidine B | 99, 114, 113, 147, 97, 186, 147, 114, 128, 163 | 4 |
| Tyrocidine B1 | 99, 128, 113, 147, 97, 186, 147, 114, 128, 163 | 1 |
| Tyrocidine C | 99, 114, 113, 147, 97, 186, 186,114, 128, 163 | 4 |
| Tyrocidine C1 | 99, 128, 113, 147, 97, 186, 186, 114, 128, 163 | 1 |
| Seglitide | 85, 163, 186, 128, 99, 147 | 1 |
| Cyanopeptide X | 57, 113, 161, 141, 71, 113, [114+57], 127 | 1 |
| BQ123 | 113, 186, 115, 97, 99 | 2 |
| Destruxin A | 113, 113, 85, 71, [98+97] | 2 |
| H3526 | 97, 97, 163, 99, {97+1}, 113, {113−1}, 113 | 10 |
| H8405 | 129, 71, 113, 113, 186 | 2 |
| Microcystin LR | {[83+71]+1}, {113−1}, {129−1}, {156+1}, 313, 129 | 27 |
| Compound 879 | 113, 113, <222−18 : 100,104>, {147+18}, 71, 141, 71 | 7 |
| Cyclomarin A | 127, 139, <286 : 129,157 >, 143, 71, [177+99] | 10 |
| Dehydrocyclomarin A | 127, 139, 268, 143, 71, 177, 99 | 27 |
| Cyclomarin C | 127, 139, 270, {143+32}, {[71+177] −32}, 99 | >40 |
| Dehydrocyclomarin C | Not generated | - |
A ‘catch-22’ situation is encountered in the use of mass spectrometry for NRP interpretation. On the one hand, there are no algorithms for interpretation of NRP spectra, thus providing little incentive for generating NRP spectra. On the other hand, shortage of NRP spectra slows down development of algorithms for NRP interpretation because spectral datasets are needed to develop such algorithms. This paper presents an attempt to break this unfortunate cycle that will hopefully motivate the natural product researchers to begin generating NRP spectra.
Supplementary Material
Acknowledgments
We are indebted to Gregory Kucherov for many helpful discussions and the NORINE team for helping with the NORINE database (spectra generated in this study are linked to the Norine database of non-ribosomal peptides12 hosted at http://bioinfo.lifl.fr/norine). We would also like to thank Dario Meluzzi for the help in the data collection process; Bradley Moore (Skaggs School of Pharmacy and Pharmaceutical Sciences, University of California San Diego) Andrew Schultz (Scripps Institution of Oceanography, University of California, San Diego), William Fenical (Scripps Institution of Oceanography, University of California, San Diego), and Katherine Maloney (Scripps Institution of Oceanography, University of California, San Diego) for proving various compounds. This project was supported by NIH grants 1-P41-RR024851-01, GM086283 and CA052955, and the PhRMA foundation.
References
- 1.Sieber SA, Marahiel MA. Molecular Mechanisms Underlying Nonribosomal Peptide Synthesis: Approaches to New Antibiotics. Chem. Rev. 2005;105:715–738. doi: 10.1021/cr0301191. [DOI] [PubMed] [Google Scholar]
- 2.Newman DJ, Cragg GM. Natural products as sources of new drugs over the last 25 years. Journal of Natural Products. 2007;70:461–477. doi: 10.1021/np068054v. [DOI] [PubMed] [Google Scholar]
- 3.Hamada T, Matsunaga S, Yano G, Fusetani N. Polytheonamides A and B, Highly Cytotoxic, Linear Polypeptides with Unprecedented Structural Features, from the Marine Sponge, Theonella swinhoei. J. Am. Chem. Soc. 2005;127:110–118. doi: 10.1021/ja045749e. [DOI] [PubMed] [Google Scholar]
- 4.Ireland CM, Durso AR, Newman RA, Hacker MP. Antineoplastic Cyclic Peptides from the Marine Tunicate Lissoclinum patella. J. Org. Chem. 1982;47:360–361. [Google Scholar]
- 5.Li J, Burgett A, Esser L, Amezcua C, Harran P. Total synthesis of nominal diazonamides: Part 2. on the true structure and origin of natural isolates. Angew. Chem Intl. Ed. Engl. 2001;40:4770–4773. doi: 10.1002/1521-3773(20011217)40:24<4770::aid-anie4770>3.0.co;2-t. [DOI] [PubMed] [Google Scholar]
- 6.Lang G, Mayhudin NA, Mitova MI, Sun L, van der Sar S, Blunt JW, Cole ALJ, Ellis G, Laatsch H, Munro MHG. Evolving trends in the dereplication of natural product extracts: New methodology for rapid, small-scale investigation of natural product extracts. Journal of Natural Products. 2008;71:1595–1599. doi: 10.1021/np8002222. [DOI] [PubMed] [Google Scholar]
- 7.Krishnamurthy T, Szafraniec L, Hunt DF, Shabanowitz J, Yates JR, Hauer CR, Carmichael WW, Skulberg O, Codd GA, Missler S. Structural characterization of toxic cyclic peptides from blue-green algae by tandem mass spectrometry. Proceedings of the National Academy of Sciences of the United States of America. 1989;86:770–774. doi: 10.1073/pnas.86.3.770. [DOI] [PMC free article] [PubMed] [Google Scholar]
- 8.Gerwick WH, Jiang ZD, Agarwal SK, Farmer BT. Total structure of hormothamnin a, a toxic cyclic undecapeptide from the tropical marine cyanobacterium hormothamnion enteromorphoides. Tetrahedron. 1992;48:2313–2324. [Google Scholar]
- 9.Barber M, Bell DJ, Morris MR, Tetler LW, Monaghan JJ, Morden WE, Bycroft BW, Green BN. An Investigation of the Tyrothricin Complex by Tandem Mass Spectrometry. International Journal of Mass Spectrometry and Ion Processes. 1992;122:143–151. [Google Scholar]
- 10.Hitzeroth G, Vater J, Franke P, Gebhardt K, Fiedler HP. Whole Cell Matrix-Assisted Laser Desorption/Ionization Time-of-Flight Mass Spectrometry and in situ Structure Analysis of Streptocidins, a Family of Tyrocidine-like Cyclic Peptides. Rapid Communications in Mass Spectrometry. 2005;19:2935–2942. doi: 10.1002/rcm.2155. [DOI] [PubMed] [Google Scholar]
- 11.Welker M, Marsálek B, Sejnohová L, von Döhren H. Detection and identification of oligopeptides in microcystis (cyanobacteria) colonies: Toward an understanding of metabolic diversity. Peptides. 2006;27:2090–2103. doi: 10.1016/j.peptides.2006.03.014. [DOI] [PubMed] [Google Scholar]
- 12.Caboche S, Pupin M, Leclere V, Fontaine A, Jacques P, Kucherov G. NORINE: a database of nonribosomal peptides. Nucl. Acids Res. 2008;36:D326–D331. doi: 10.1093/nar/gkm792. [DOI] [PMC free article] [PubMed] [Google Scholar]
- 13.Skiena SS, Sundaram G. A Partial Digest Approach to Restriction Site Mapping. Bulletin of Mathematical Biology. 1994;56:275–294. doi: 10.1007/BF02460643. [DOI] [PubMed] [Google Scholar]
- 14.Rosenblatt J, Seymour PD. The Structure of Homometric Sets. SIAM Journal on Algebraic and Discrete Methods. 1982;3:343–350. [Google Scholar]
- 15.Pevzner PA, Dancik V, Tang C. Mutation-Tolerant Protein Identification by Mass Spectrometry. J. Comput. Biol. 2000;7:777–787. doi: 10.1089/10665270050514927. [DOI] [PubMed] [Google Scholar]
Associated Data
This section collects any data citations, data availability statements, or supplementary materials included in this article.