

Abstract
Previously, we identified progressive alterations in spontaneous EPSCs and IPSCs in the striatum of the R6/2 mouse model of Huntington's disease (HD). Medium-sized spiny neurons from these mice displayed a lower frequency of EPSCs, and a population of cells exhibited an increased frequency of IPSCs beginning at ∼40 d, a time point when the overt behavioral phenotype begins. The cortex provides the major excitatory drive to the striatum and is affected during disease progression. We examined spontaneous EPSCs and IPSCs of somatosensory cortical pyramidal neurons in layers II/III in slices from three different mouse models of HD: the R6/2, the YAC128, and the CAG140 knock-in. Results revealed that spontaneous EPSCs occurred at a higher frequency, and evoked EPSCs were larger in behaviorally phenotypic mice whereas spontaneous IPSCs were initially increased in frequency in all models and subsequently decreased in R6/2 mice after they displayed the typical R6/2 overt behavioral phenotype. Changes in miniature IPSCs and evoked IPSC paired-pulse ratios suggested altered probability of GABA release. Also, in R6/2 mice, blockade of GABAA receptors induced complex discharges in slices and seizures in vivo at all ages. In conclusion, altered excitatory and inhibitory inputs to pyramidal neurons in the cortex in HD appear to be a prevailing deficit throughout the development of the disease. Furthermore, the differences between synaptic phenotypes in cortex and striatum are important for the development of future therapeutic approaches, which may need to be targeted early in the development of the phenotype.
Introduction
Huntington's disease (HD) is associated with atrophy of the striatum and cerebral cortex, which leads to a loss of motor control and declines in cognitive function (Bates et al., 2002). The disease usually manifests in midlife and is attributable to an expansion in the CAG trinucleotide repeat within the gene encoding the protein huntingtin (Huntington's Disease Collaborative Research Group, 1993). Within the striatum, medium-sized spiny neurons (MSNs) are most susceptible to dysfunction and degeneration. In the cortex, pyramidal neurons of layers II, III, and V degenerate. Whereas neuronal death may underlie many symptoms in late-stage HD (Vonsattel et al., 1985), early deficits, which are apparent years before cell death or neurological symptoms, are more likely associated with cellular and synaptic dysfunction in the cortex (Bäckman and Farde, 2001; Berrios et al., 2002; Rosas et al., 2005, 2008; Paulsen et al., 2008).
Genetic mouse models of HD have been successful in replicating aspects of the human disorder (Bates and Murphy, 2002; Levine et al., 2004). One extensively studied model is the R6/2, which is transgenic for exon 1 of the human huntingtin gene and originally carried ∼150 CAG repeats (Mangiarini et al., 1996). R6/2 mice display motor and cognitive deficits, late-onset cortical cellular degeneration and striatal cellular morphological changes, as well as alterations in striatal, hippocampal, and cortical synaptic transmission (for review, see Cepeda et al., 2007). R6/2 mice also are considered a model of the juvenile HD because of the rapid phenotypic progression, the prominence of intranuclear inclusions throughout the brain, and their increased propensity to seize. Other HD mouse models, such as the YAC128 mouse (expressing full-length mutant huntingtin) (Slow et al., 2003) and the CAG140 knock-in (KI) mouse (expressing chimeric mouse/human huntingtin in the normal context of the mouse genome) (Menalled et al., 2003), have less aggressive and more protracted phenotypes, making them useful models of adult-onset HD. Interestingly, older KI mice (∼2 years) share most of the molecular phenotypes of 12 week R6/2 mice, including widespread aggregate pathology that supports the continued use of fragment models to identify mechanisms of pathogenesis and preclinical screening (Woodman et al., 2007).
We demonstrated a progressive reduction in the frequency of spontaneous EPSCs (Cepeda et al., 2003) and increased frequencies of IPSCs (Cepeda et al., 2004) in striatal MSNs from behaviorally phenotypic R6/2 mice. The main focus of the present experiments was to examine spontaneous and evoked synaptic currents in cortical pyramidal neurons to better understand how these neurons are altered in the R6/2 mouse model of HD. We compared the results with two other models of HD, the YAC128 and CAG140 KI mice. Previously, we showed that glutamate receptor function in striatal and cortical neurons is altered in an opposite manner in the R6/2 mouse model (Cepeda et al., 2001; Starling et al., 2005; André et al., 2006). Here we show that synaptic excitatory and inhibitory inputs onto cortical pyramidal neurons are differentially and opposite to those of striatal MSNs.
Materials and Methods
Animals.
R6/2 mice and their wild-type (WT) littermate controls were obtained from our colony at the University of California at Los Angeles (UCLA). These mice are maintained by crossing WT male C57BL/6×CBA mice with WT females that have transplanted R6/2 ovaries (both male and females purchased from The Jackson Laboratory). All procedures were performed in accordance with the National Institutes of Health Guide for Care and Use of Laboratory Animals and were approved by the Institutional Animal Care and Use Committee at UCLA. Animals were used at three ages: 21–25 d (before an overt behavioral phenotype; 21 d group), 35–45 d (when the overt behavioral phenotype begins; 40 d group), and 78–90 d (fully behaviorally phenotypic; 80 d group). Mice were genotyped twice, once at weaning and again after experimentation, to verify genotype. Although the original R6/2 mice had ∼150 CAG repeats (Mangiarini et al., 1996), because of the method of breeding at The Jackson Laboratory using normal females with transplanted ovaries from R6/2 females, most colonies of R6/2 mice that use The Jackson Laboratory to resupply breeders now have between 110 and 120 CAG repeats. Mean CAG repeat lengths for R6/2 mice (111.8 ± 0.8 CAG repeats; n = 38 animals) were not significantly different among age groups. We have shown that the reduction from ∼150 to ∼110 CAG repeats does not markedly change the corticostriatal electrophysiological or behavioral effects of the HD mutation (Cummings et al., 2008).
Because obtaining suitable patch-clamp recordings gets significantly more difficult in animals over 1 month of age, the rapid progression of the HD-like phenotype of the R6/2 mouse was used to perform most experiments. However, to confirm that results were not idiosyncratic to the R6/2, findings were compared with two other mouse models of HD. The first model carried full-length mutant human huntingtin, including 128 CAG repeats, on a yeast-artificial chromosome (YAC128, line 53, FVB/N background) (Slow et al., 2003). YAC128 and age-matched WT counterparts were obtained from our colonies at UCLA at 6 and 12 months of age. The second model used the KI approach to insert a chimeric mouse/human exon 1, originally with 140 CAG repeats, into the murine huntingtin homolog Hdh gene and thereby expresses huntingtin in the normal murine context (Menalled et al., 2003; Hickey et al., 2008). These mice are on a C57BL/6J × 129/SV background, and heterozygotic KI mice were bred to generate homozygotic KIs and littermate WTs. KI and age-matched WT mice were obtained from our colony at UCLA at an age of 12 months. These mice had ∼120 CAG repeats. A recent analysis indicated that the reduction in repeat length from 140 to 120 CAG repeats had little effect on phenotypic progression (Hickey et al., 2008).
Slice preparation.
Mice were anesthetized with halothane and then decapitated, and the brain rapidly removed to ice-cold dissection artificial CSF (ACSF) containing the following (in mm): 130 NaCl, 3 KCl, 26 NaHCO3, 1.25 NaHPO4, 10 glucose, 5 MgCl2, 1 CaCl2, pH 7.2 (aerated with 95% O2/5% CO2, 290–300 mOsm/L). The brain was trimmed using a razor blade, glued to the stage of a vibrating microtome (model VT1000S; Leica), and 350 μm coronal slices including cortex and striatum were cut. Slices then were stored and allowed to recover at room temperature in a submerged chamber in oxygenated standard ACSF (same composition as dissection ACSF except MgCl2 and CaCl2 were 2 mm) for at least 1 h before experimentation.
Whole-cell recordings in slices.
Whole-cell patch-clamp recordings were obtained from layer II/III pyramidal cells visualized in coronal slices with the aid of infrared-differential interference contrast microscopy and identified by somatic size, basic membrane properties, and post hoc examination of recorded neurons filled with biocytin. The patch pipette (4–6 MΩ) was filled with cesium methanesulfonate (CsMeth) solution containing the following (in mm): 125 CsMeth, 4 NaCl, 3 KCl, 1 MgCl2, 9 EGTA, 8 HEPES, 5 MgATP, 1 TrisGTP, 10 disodium phosphocreatine, and 0.1 leupeptin, pH 7.2 (270–280 mOsm/L) for recording in voltage-clamp mode. Biocytin (0.2%) was also included in the electrode for some experiments to enable visualization of recorded neurons. Slices were processed for biocytin by standard techniques (Horikawa and Armstrong, 1988).
Both voltage- and current-clamp recordings were performed using an Axopatch 200A patch-clamp amplifier. Basic membrane properties were ascertained from cells perfused in standard ACSF at room temperature using the membrane properties function within Clampex 8.2. Briefly, a depolarizing square pulse of 10 mV was injected into the cell at a frequency of 0.7 Hz. The current decay values after the onset of the pulse and the steady-state values at the end of the pulse were used to calculate membrane capacitance, membrane resistance, access resistance, time constant, and holding current. The means of 50 pulses were averaged per sample, and at least 20 samples were collected per cell, allowing the calculation of an average value per cell. Series resistance was subsequently compensated (70–80%). Spontaneous postsynaptic currents were then recorded. The membrane current was filtered at 1 kHz and digitized at 100–200 μs using Clampex 8.2 (gap-free mode). Cells were voltage clamped at −70 mV to assess basic membrane properties and to examine glutamate receptor-mediated EPSCs. Bicuculline methiodide (BIC) was applied to block GABAA receptor-mediated currents. To assess GABAA receptor-mediated IPSCs, membranes were stepped to a holding potential of +10 mV and ionotropic glutamate receptor-mediated currents blocked with 10 μm 6-cyano-7-nitroquinoxaline-2,3-dione (CNQX) and 50 μm dl-2-amino-5-phosphonovaleric acid (AP-5).
To record miniature currents, 1 μm tetrodotoxin (TTX) was bath applied to slices. As TTX reduced the mean amplitude of events, for this set of experiments, a smaller bin size was used. To maximize data obtained from individual cells, the ionotropic glutamate and GABAA receptor antagonists CNQX, AP-5, and BIC were not used in this analysis. All drugs were obtained from Sigma-Aldrich. Stock solutions were prepared in distilled water and dissolved in standard ACSF to required concentrations.
When recordings were made in current-clamp mode, a K-gluconate solution was used, containing the following (in mm): 112.5 K-gluconate, 4 NaCl, 17.5 KCl, 0.5 CaCl2, 1 MgCl2, 5 ATP (potassium salt), 1 NaGTP, 5 EGTA, 10 HEPES, pH 7.2 (270–280 mOsm/L). Action potential threshold was determined by applying a ramped depolarizing current until an action potential was evoked.
Spontaneous synaptic currents.
Spontaneous synaptic currents were analyzed offline using the automatic detection protocol within the Mini Analysis Program (Justin Lee, Synaptosoft, 1999) and subsequently checked manually for accuracy. Event counts were done blind to genotype. The threshold amplitude for the detection of an event (5 pA for glutamatergic currents and 10 pA for GABAergic currents) was set above the root mean square background noise level (1–2 pA at Vhold = −70 mV and 2–3 pA at Vhold = +10 mV). For both glutamatergic and GABAergic events, criteria required a peak to occur within 8 ms from the start of the rise time. Amplitude–frequency histograms were subsequently constructed.
Event kinetic analysis was performed for EPSCs with peak amplitudes between 7 and 50 pA and IPSCs with peak amplitudes between 10 and 70 pA, using the Mini Analysis Program. For these analyses, events were aligned by half-rise time and normalized by peak amplitude. Events displaying complex peaks were excluded from analysis. The decays of both EPSC and IPSC average traces could be fit with either first- or second-order exponential curves, and these were used to determine rise time, decay time, and half-amplitude durations.
Synaptic stimulation.
To evoke synaptic currents in layer II/III pyramidal cells, a monopolar glass stimulating electrode (patch-pipette filled with ACSF, impedance ∼1 MΩ) was placed 200–300 μm from the recorded cell. To evoke EPSCs, stimulation electrodes were placed in layer I, which will activate thalamocortical and corticocortical glutamatergic afferents. To isolate EPSCs, membranes were voltage clamped at −70 mV and GABAA receptors were blocked using picrotoxin (10 μm). Alternatively, to evoke IPSCs, stimulating electrodes were positioned within layer II/III to recruit afferents of local GABAergic interneurons. Cell membranes were voltage clamped at −70 mV and, before stimulation, ramped to a holding potential of +10 mV for 5 s. Ionotropic glutamate receptors were blocked using CNQX and AP-5. Test stimuli (500 μs duration) were applied every 20 s and averaged over three consecutive trials at increasing stimulus intensities (0.01–0.14 mA) to assess input–output functions. Subsequently, stimulation intensities were set to evoke responses at 50% maximal amplitude. Paired-pulse stimuli were used to assess probability of release and were applied at intervals between 25 and 400 ms. Paired-pulse facilitation (PPF) was defined as ratios of 1.1 or greater, and paired-pulse depression (PPD) was defined as ratios of 0.9 or less. Coefficients of variation (CVs) were calculated from 20 to 40 evoked (0.067 Hz) IPSCs and defined as σ/μ, where σ is the SD, and μ is the mean IPSC amplitude.
Preparation of dissociated neurons.
Mice were anesthetized and brain slices obtained as described above. Coronal (bregma 1.5–0.4 mm) slices (350 μm) were incubated in NaHCO3-buffered Earl's balanced salt solution (EBSS) (Sigma), pH 7.4, 300–310 mOsm, bubbled with 95% O2–5% CO2 and supplemented with the following (in mm): 1 pyruvic acid, 0.005 glutathione, 0.1 NG-nitro-l-arginine, and 1 kynurenic acid until dissociation. After 1 h incubation, layers I–IV of the somatosensory and motor areas of the cortex were dissected, placed in an oxygenated cell-stir chamber (Wheaton), and enzymatically treated for 25–30 min with papain (0.625 mg/ml; Calbiochem) at 35°C in a HEPES HBSS (Sigma), pH 7.4, 300–310 mOsm. After enzymatic digestion, the tissue was rinsed with a low Ca2+ HEPES-buffered Na-isethionate solution [in mm: 140 Na+ isethionate, 2 KCl, 2 MgCl2, 0.1 CaCl2, 23 glucose, and 15 HEPES, pH 7.4 (300–310 mOsm)] and mechanically dissociated with a graded series of fire-polished Pasteur pipettes. The cell suspension was plated into a Petri dish containing a HEPES-buffered salt solution (in mm): 140 NaCl, 23 glucose, 15 HEPES, 2 KCl, 2 MgCl2, and 1 CaCl2, pH 7.4 (300–310 mOsm).
Whole-cell voltage-clamp recordings of dissociated neurons.
The internal pipette solution contained the following (in mm): 175 N-methyl-d-glucamine, 40 HEPES, 2 MgCl2, 10 EGTA, 12 phosphocreatine, 2 Na2ATP, 0.2 Na2GTP, and 0.1 leupeptin, pH 7.2–7.3 (265–270 mOsm). The Mg2+free external solution consisted of the following (in mm): 135 NaCl, 20 CsCl, 3 CaCl2 2 BaCl2, 10 glucose, 10 HEPES, and 0.0003 TTX, pH 7.4 (300–310 mOsm). The presence of Cs+ and TTX in the external solution blocked some voltage-gated K+ and all Na+ channels, respectively. Electrode resistance was typically 4–5 MΩ in the bath. After seal rupture, series resistance was compensated (70–90%) and periodically monitored. Signals were detected with an Axopatch 200A amplifier (Molecular Devices).
Only data from pyramidal-shaped cells with clear apical and basilar dendrites were included in the present study. To measure the desensitization time constants, GABA current decay rates were fit using a single exponential. Drugs were applied through an array of application capillaries positioned 500–600 μm from the cell using a pressure-driven fast perfusion system. Solution changes were performed by changing the position of the array with a direct current drive system controlled by an SF-77B perfusion system (Warner Instruments) synchronized by pClamp. Solution changes were complete within <100 ms. GABA was applied for 3 s every 60 s to avoid rundown. Responsiveness of cells to a series of GABA applications (1–1000 μm) was examined at a holding potential of −40 mV. The type I benzodiazepine zolpidem was bath applied at 0.1 μm and tested on currents induced by 10 μm GABA.
Seizure induction.
To assess the susceptibility of R6/2 mice to seizures, the GABAA receptor antagonist picrotoxin (PTX) was injected intraperitoneally, and latency to seize was recorded. Preliminary experiments indicated that the youngest group of mice was more sensitive to PTX than older mice. Therefore, for the 40 and 80 d groups, 4 mg/kg PTX was used, whereas a dose of 2 mg/kg was used in the 21 d group. Preliminary experiments also produced inconsistent data when female mice were tested, and subsequently only males were evaluated. For each experiment, a pair of mice (a mutant and its appropriate WT littermate) was placed into a transparent vinyl cage (15 × 8 × 7 inches, separated into two equal compartments) and allowed to habituate for >10 min. PTX (prepared fresh daily in physiological saline) was injected by an experimenter blind to genotype. Experiments were videotaped for rescoring of the latency to key stages of seizures according to the Racine scale (Racine, 1972). During onset of a tonic–clonic seizure, mice were killed with halothane, followed by decapitation. If a tonic–clonic seizure was not displayed by 45 min, the experiment was terminated and the mouse was killed.
Statistical analyses.
Values in figures and text are presented as means ± SEM. Differences between group means were assessed with appropriate t tests (paired or unpaired with or without Welch's correction for unequal variance) or appropriately designed analyses of variance, followed by Bonferroni's post hoc tests. Differences in proportions and distributions were assessed using either z-tests or Fisher's exact tests as appropriate. Differences were considered significant if p < 0.05. Microsoft Excel and SigmaStat 2.03 (SPSS) were used to perform all statistical analyses.
Results
Basic membrane properties
Basic membrane properties (Table 1) of pyramidal neurons were examined at each age using CsMeth as electrolyte. Although there was an age-dependent increase in membrane resistance and decreases in membrane time constant and cell capacitance, no significant differences were observed between the genotypes at any age. When K-gluconate was used as the internal electrolyte to record in current-clamp mode, significant differences were observed in basic membrane properties in neurons from the 80 d group (Table 1), including an increase in membrane input resistance (p = 0.0038) and a decrease in membrane capacitance (p = 0.0024) in R6/2 pyramidal neurons. The difference between membrane time constants failed to reach significance (p = 0.15). At this age, the resting membrane potential (RMP) was significantly depolarized in cells from R6/2 mice compared with cells from WT mice (p = 0.025) (Table 1). Action potential firing threshold was unaltered. The differences between values obtained using CsMeth and K-gluconate were probably attributable to the Cs+ block of voltage-dependent inwardly-rectifying K+ currents (Uchimura et al., 1989; Nisenbaum and Wilson, 1995; Reyes et al., 1998).
Table 1.
Basic membrane properties pyramidal neurons in slices from R6/2 mice
| 21 d (CsMeth) |
40 d (CsMeth) |
80 d (CsMeth) |
80 d (KGluc) |
|||||
|---|---|---|---|---|---|---|---|---|
| WT (n = 35) | R6/2 (n = 44) | WT (n = 19) | R6/2 (n = 21) | WT (n = 28) | R6/2 (n = 35) | WT (n = 11) | R6/2 (n = 12) | |
| Rm (MΩ) | 110 ± 5 | 104 ± 6 | 131 ± 13 | 133 ± 12 | 173 ± 10 | 178 ± 10 | 135 ± 23 | 221 ± 16** |
| τ (ms) | 2.7 ± 0.1 | 2.9 ± 0.1 | 2.6 ± 0.2 | 2.5 ± 0.2 | 2.1 ± 0.2 | 2.0 ± 0.1 | 2.2 ± 0.2 | 1.8 ± 0.2 |
| Cm (pF) | 150 ± 7 | 146 ± 5 | 122 ± 7 | 129 ± 6 | 107 ± 6 | 101 ± 4 | 145 ± 13 | 99 ± 6** |
| RMP (mV) | −73.1 ± 1.6 | −65.3 ± 2.9* | ||||||
| APthreshold (mV) | −44.1 ± 1.7 | −45.5 ± 3.8 | ||||||
In each column, data for WT and R6/2 are presented at the ages indicated. Internal solution and n values are indicated in parentheses. Significance is indicated by *p < 0.05; **p < 0.01. APthreshold, Action potential threshold.
Excitatory synaptic transmission
Spontaneous EPSCs were recorded in voltage-clamp mode at −70 mV. The majority of currents were <30 pA amplitude (Fig. 1A,D) and were almost entirely blocked by coapplication of the ionotropic glutamate receptor antagonists CNQX (10 μm) and AP-5 (50 μm) (Fig. 1B), indicating that the majority of these currents were attributable to activation of ionotropic glutamate receptors (n = 5). The few remaining events were likely to be GABAergic in origin because application of BIC reduced the frequency of spontaneous currents by ∼5% in slices from animals aged 40 and 80 d (see below, Effects of BIC, and Fig. 3C). In cells from WTs, there was a significant age-dependent decrease in mean frequency of spontaneous EPSCs from 21 to 40 d (p = 0.039), which remained decreased at 80 d (p < 0.001 compared with 21 d; p > 0.5 compared with 40 d) (Fig. 1A,C–E). In contrast, R6/2 cells showed approximately the same mean frequency across all ages. At 21 d, R6/2 neurons appeared to have a lower mean frequency of EPSCs than WTs, but this difference failed to reach statistical significance (p = 0.11). At 40 d, there was no difference between WTs and R6/2 s (p > 0.4). At 80 d, the difference between these means was statistically significant, reflecting a greater frequency of spontaneous EPSCs in cells from R6/2 mice (p = 0.031). Amplitude– frequency histograms (Fig. 1D) revealed that, at 21 d in cells from R6/2 mice, mid-amplitude events showed a significant reduction (p < 0.05) in frequency compared with WTs, but this only reached significance for events between 10 and 15 pA. No significant differences were obtained at 40 d. At 80 d, a significant increase in the frequency of small-amplitude (<10 pA) events occurred (p < 0.05), and this was reflected as an increase in the cumulative probability plot for interevent intervals in R6/2s (Fig. 1E).
Figure 1.

A, Typical voltage-clamp traces are shown for both WT and R6/2 cells from mice in each age group. B, CNQX/AP-5 application completely blocked all synaptic currents at a membrane holding potential of −70 mV. Insets show traces on a magnified timescale to more clearly show the effect of blocking ionotropic glutamate receptors. C, Mean ± SEM frequencies of EPSCs recorded in ACSF for each age group. Note the significant decrease in frequency with age in cells from WTs that does not occur in cells from R6/2 mice. D, Amplitude–frequency histograms for EPSCs recorded in ACSF for each age group. E, Cumulative probability curves for interevent interval showing a significant increase in release probability at 80 d. In this and subsequent figures, sample sizes are in parentheses, and significant differences are denoted by *p < 0.05, **p < 0.01, ***p < 0.001, and †p < 0.05 to p < 0.001.
Figure 3.

A, Example traces showing EPSCs recorded in the presence of BIC (20 μm) for each age group. B, Mean ± SEM frequency of EPSCs for each group. C, Mean percentage change in frequency from ACSF to BIC for each group. D, Amplitude–frequency histograms revealed a greater frequency of small-amplitude (5–10 pA) currents at 80 d. E, Cumulative interevent interval plots for each group, showing an increased probability of release in cells from R6/2 mice at 80 d.
EPSC kinetics
The kinetics of EPSCs were analyzed by averaging events between 7 and 50 pA for each cell (Fig. 2A,B). No differences in mean rise times, decay times, or half-amplitude durations were observed at 21 d. At 40 d, the reductions in the decay time (p = 0.085) and half-amplitude duration (p = 0.097) in cells from R6/2 mice did not reach significance. By 80 d, both decay time (p = 0.037) and half-amplitude duration (p = 0.02) were significantly reduced, and this was accompanied by a reduction in area (p = 0.045) (WT, 200.4 ± 25.9 pA × ms, n = 12; R6/2, 153.2 ± 8.5 pA × ms, n = 18; p = 0.045). There were no consistent differences between mean EPSC amplitudes at any age. Although there were more excitatory events in cells from 80 d R6/2 mice, they were of shorter duration and smaller overall area.
Figure 2.

A, Traces show examples of average EPSCs with an exponential fit for WT (black) and R6/2 (gray) cells at each age (n > 100 per trace). B, Bar graphs show rise times, decay times, and half-amplitude durations of spontaneous EPSCs at each age. Note the progressive decrease in decay times and half-amplitude durations of spontaneous EPSCs of R6/2 groups at 40 and 80 d.
Effects of BIC
At a holding potential of −70 mV and in the absence of GABA receptor blockers, a proportion of currents could be mediated by GABAA receptors. Also, inhibition by interneurons within the cortex could be suppressing excitatory synaptic activity. We therefore applied the GABAA receptor antagonist BIC (20 μm) to eliminate GABAA receptor-mediated transmission and subsequently recorded in gap-free mode at −70 mV to determine the frequency of pure EPSCs (Fig. 3). At 21 d, BIC increased EPSC frequency in 90% of cells from both genotypes. However, there was a significantly larger increase in frequency from cells of R6/2 than those of WT mice (p = 0.035) (Fig. 3C). At both 40 and 80 d, most cells (75%) responded with a small decrease in EPSC frequency in response to BIC. At these ages, there was no differential effect of BIC. Importantly, in the presence of BIC, the higher frequency of EPSCs in R6/2 cells from 80 d animals remained and was more evident in the small-amplitude (<10 pA) events (Fig. 3D). Again, this was reflected as an increase in the cumulative frequency plots (Fig. 3E).
Effect of TTX on EPSCs
To determine whether the higher frequency of EPSCs in cells from R6/2 mice at 80 d is dependent on presynaptic action potentials, TTX (1 μm) was applied to a subset of slices (Fig. 4). To maximize the data obtained from these slices and permit recordings at a holding potential of +10 mV (see below), BIC was not applied. Although BIC was not used for this subset of slices, the application of BIC in the absence of TTX suggested that the majority of events (>80%) at this holding potential are EPSCs. TTX reduced the frequency of EPSCs in all cells from both WT and R6/2 mice (Fig. 4A). Moreover, the higher frequency of EPSCs was maintained in cells from R6/2 s (3.4 ± 1.0 Hz, n = 6) compared with WTs (0.9 ± 0.3 Hz; n = 6; p = 0.025) (Fig. 4B). This was particularly evident for the smallest-amplitude events (<11 pA), as shown in the amplitude–frequency histograms (Fig. 4B). Cumulative amplitude plots showed no difference between the genotypes, whereas cumulative frequency plots were altered in R6/2s (Fig. 4C).
Figure 4.

Miniature EPSCs in slices from 80 d mice were isolated with TTX. A, Typical traces from cells from WT and R6/2 mice, before and after the application of TTX. B, Amplitude–frequency histograms revealed that the increases in spontaneous EPSC frequency were maintained in TTX and were therefore independent of action potentials. C, No change in cumulative amplitude plots but a greater probability of release was apparent in cumulative frequency probability plots in the presence of TTX.
Evoked EPSCs
The altered frequencies of spontaneous and miniature EPSCs suggest presynaptic modification. Two presynaptic alterations could be a reduction in the number of release sites (n) or the probability of release (Pr). A classical method to assess changes in Pr is to examine paired-pulse ratios, which are independent of n (Zucker, 1989; Choi and Lovinger, 1997). Increases in paired-pulse ratio are associated with a reduced Pr or vice versa.
EPSCs were isolated by voltage clamping membranes at −70 mV and blocking GABAA receptors using 10 μm PTX (see below, Evoked IPSCs, and Fig. 10B, which demonstrates complete IPSC blockade by this concentration of PTX). Initially the input–output function was assessed using stimulation intensities between 0.01 and 0.14 mA. At 21 d, no significant differences were identified in amplitude at any intensity, although larger EPSC amplitudes occurred in R6/2 neurons (p = 0.086 at 0.14 mA stimulation intensity) (Fig. 5A). By 80 d, there was an age-dependent reduction in the amplitude of evoked EPSCs in both genotypes. Moreover, EPSC amplitudes were significantly larger in neurons from R6/2 mice than in age-matched WTs, and this reached significance at stimulation intensities between 0.04 and 0.14 mA (p < 0.05 to p < 0.003) (Fig. 5C).
Figure 10.

Evoked IPSCs were isolated by voltage clamp at +10 mV and application of the ionotropic glutamate receptor antagonists CNQX and AP-5. Ai, Altering (Δ) Pr affected paired-pulse ratio. Decreasing extracellular calcium ion concentration from 2 to 1 mm increased PPF. Increasing extracellular calcium ion concentration from 2 to 4 mm decreased PPF. Aii, Increasing the number of release sites (n) by increasing stimulation intensity had no effect on paired-pulse ratio. Aiii, Manipulating postsynaptic electrochemical driving force by altering membrane holding potential from +10 to −70 mV had no effect on paired-pulse ratio. Inset shows the same traces on a magnified amplitude scale. Aiv, Altering postsynaptic responsiveness by partially blocking GABAA receptors had no effect on paired-pulse ratio. B, Left, The relationship between stimulus intensity and IPSC amplitude was identical in WT and R6/2 mice at 21 d. Right, Typical traces from WT and R6/2 neurons at 21 d evoked at 0.04 and 0.08 mA stimulus intensities. The addition of 10 μm PTX completely abolished the evoked current. Stimulus artifacts have been attenuated for clarity. C, Left, Paired-pulse ratios for intervals between 25 and 400 ms were unaltered at 21 d. Right, Typical paired-pulse responses at 25, 50, and 100 ms intervals in neurons from mice aged 21 d. D, Left, Relationship between stimulus intensity and evoked IPSC amplitude at 80 d. Right, Typical IPSCs in WT and R6/2 neurons. E, Left, Paired-pulse profiles from WT and R6/2 neurons at 80 d. Right, Typical paired-pulse responses at 25, 50, and 100 ms intervals from both WT and R6/2 pyramidal neurons. All x-axes for stimulus intensity plotted on a log-scale. Dashed lines indicate levels for PPF (ratio >1.1) and PPD (ratio <0.9).
Figure 5.

Evoked EPSCs were isolated by voltage clamp at −70 mV and application of PTX (10 μm) A, Left, The relationship between stimulus intensity and EPSC amplitude was identical in WT and R6/2 mice at 21 d. Right, Typical traces from WT and R6/2 neurons at 21 d. Stimulus artifacts have been attenuated for clarity. B, Left, Paired-pulse ratios for intervals between 25 and 400 ms were unaltered at 21 d. Right, Typical paired-pulse responses at 25, 50, and 100 ms intervals in neurons from mice at 21 d. C, Left, Relationship between stimulus intensity and evoked EPSC amplitude at 80 d. Right, Typical EPSCs evoked at 0.04 and 0.08 mA stimulus intensities in WT and R6/2 neurons. D, Left, Paired-pulse profiles from WT and R6/2 neurons. Right, Typical paired-pulse responses at 25, 50, and 100 ms intervals from both WT and R6/2 pyramidal neurons. Note: All x-axes for stimulus intensity plotted on a log-scale. Dashed lines indicate levels for PPF (ratio >1.1) and PPD (ratio <0.9).
Paired-pulse stimuli were then applied at intervals between 25 and 400 ms to assess probability of release. At 21 d, the paired-pulse profiles were identical between the genotypes and were characterized by paired-pulse facilitation at intervals of 25, 50, and 100 ms, no difference at 200 ms, and paired-pulse depression at 400 ms (Fig. 5B). At 80 d, a similar profile was identified in WTs, whereas ratios were reduced in neurons from R6/2s (Fig. 5D). At 25 and 100 ms, there was no difference between the second and first response in R6/2 cells. At 200 and 400 ms, paired-pulse depression occurred. At the 50 ms interval, the ratio remained the same as WTs. The differences between the genotypes were statistically significant (25 ms, p = 0.0011; 100 ms, p = 0.043; 200 ms, p = 0.00059; 400 ms, p = 0.0016), indicating an increase in probability of glutamate release in R6/2 cells.
Large-amplitude discharges
Bath application of 20 μm BIC induced large-amplitude discharges in cells from both genotypes and at all ages (Fig. 6). These discharges consisted of a large-amplitude (>1 nA) fast inward current that included a prolonged decay (Fig. 6A). No difference was observed between the two genotypes in the proportion of cells displaying these discharges at any age (21 d: WT, 76% and R6/2, 85%; 40 d: WT, 78% and R6/2, 91%; 80 d: WT, 69% and R6/2, 67%; p > 0.7 at all ages, z-test). There was a decrease in the frequency of these discharges with age in both genotypes, but no differences were observed between cells from WT and R6/2 mice at each age (Fig. 6B). There was, however, a progressive change in the complexity of discharges in cells from R6/2 mice (Fig. 6B). In cells from WTs, discharges were restricted to large inward currents occurring as singlets or doublets (Fig. 6A, left column), whereas in R6/2 cells, more complex discharges were apparent, with between two and six discharges occurring in a train or cells showing high-frequency activity after the initial inward deflections (Fig. 6A, right column). In WT slices, the percentage of cells displaying complex discharges decreased with age, and complex discharges were never seen in the 80 d group. In contrast, the percentage of R6/2 cells showing complex discharges increased with age. The increase in complex discharges in cells from R6/2 mice and the decrease in cells from WTs is reflected in the histograms showing duration of events (Fig. 6C). Although durations of events tended to be longer in cells from R6/2 mice than in those from WT mice at all ages, this difference only reached significance at 80 d (p < 0.001, Fisher's exact test).
Figure 6.
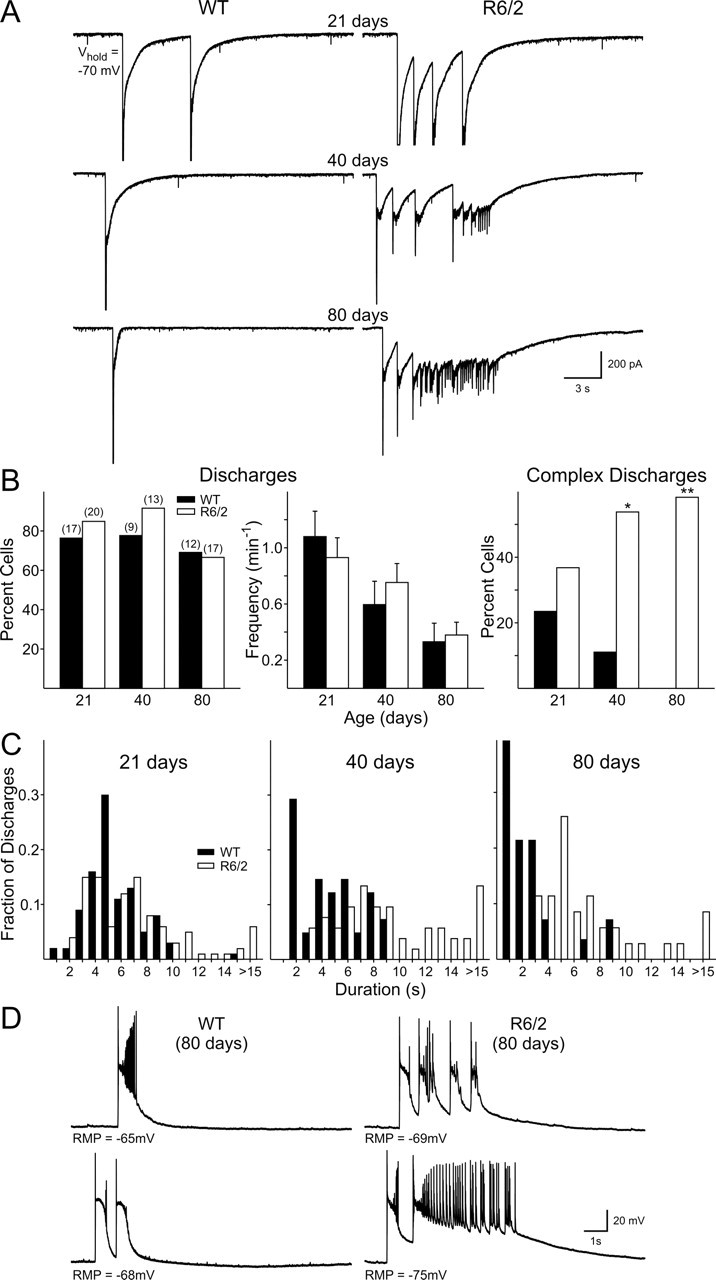
A, Voltage-clamp recordings show that application of BIC induced large-amplitude discharges in both genotypes. R6/2 cells showed more complex wave forms than cells from WT mice at each age. B, Proportion of cells displaying large-amplitude discharges (left). Mean frequencies of large-amplitude discharges for both genotypes at the three ages (middle). The percentage of cells showing complex discharges was greater in R6/2 mice and became more frequent with age (right). C, Distribution histograms for the duration of complex discharges. D, Current-clamp recordings of cells from 80 d mice also showed more complex discharges in cells from R6/2 mice compared with those from WTs.
Because differences were observed in EPSC frequency only at 80 d of age, current-clamp recordings were obtained from another population of pyramidal cells at this age using K-gluconate as the electrolyte. Initially, we recorded in gap-free mode under voltage clamp (−70 mV) and found a similar higher frequency of EPSCs in R6/2 s (10.2 ± 2.2 Hz; n = 7) compared with WTs (5.8 ± 0.8 Hz; n = 9; p < 0.05) as observed in voltage clamp using CsMeth as the internal solution. When cells were recorded in current-clamp mode, discharges were again observed after the application of BIC for extended periods of time (5–20 min) (Fig. 6D). Again, the voltage deflections recorded in cells from R6/2 mice were more complex than those in WTs. WTs showed repetitive membrane depolarizations, whereas cells from R6/2 mice also showed high-frequency discharges. Complex discharges occurred in 67% of R6/2 cells (n = 12) and in 10% of WT cells (n = 10; p = 0.02, z-test).
Progressive changes in inhibitory cortical neurotransmission
The differential increase in EPSC frequency after BIC application to slices from 21 d mice suggests that an alteration in inhibitory inputs to the pyramidal cells may have occurred. Therefore, in a separate population of cells, voltage-clamp recordings were made at a holding potential of +10 mV and in the presence of CNQX and AP-5 to isolate GABAA receptor-mediated spontaneous IPSCs. Differences were observed from the earliest age recorded, and a progressive, biphasic electrophysiological phenotype emerged in R6/2 cells (Fig. 7). At 21 d, two populations of cells were identified in WTs. One displayed IPSCs of low frequency (LF) (range, 4.5–8.9 Hz), whereas the other displayed IPSCs of high frequency (HF) (range, 14.1–19.9 Hz) (Fig. 7B). No differences were found in the basic membrane properties between these two groups of cells for either genotype, and therefore all cells were pooled in the 21 d group for Table 1. Pyramidal neurons from R6/2 mice could also be divided into LF (range, 4.9–11.8 Hz) and HF (range, 15.0–27.6 Hz) groups, but these groups were markedly different from the corresponding WT groups. Both populations of cells showed significantly greater IPSC frequencies (LF, p = 0.038; HF, p = 0.0012) (Fig. 7B, insets). The increased frequency in both groups of cells from R6/2 mice is also shown by an increase in cumulative frequency plots (Fig. 7B), whereas no differences were observed in cumulative amplitude plots (Fig. 7C). In the R6/2 HF group, events no longer occurred randomly but showed a bursting pattern consisting of large-amplitude (>50 pA) currents (Fig. 7A). The increase in frequency was not attributable to an increased glutamatergic drive onto interneurons, because ionotropic glutamate receptors were blocked using CNQX and AP-5.
Figure 7.

A, Typical recordings of spontaneous (s) and miniature (m) IPSCs in cells voltage clamped at +10 mV. CNQX and AP-5 were present throughout the recordings, except at 80 d in the presence of TTX. At 21 d, two populations of cells were evident: an LF group and an HF group. Note the bursting pattern of activity in the HF group of cells from R6/2 mice. At 40 and 80 d, only one population could be identified. B, Cumulative frequency probability plots of spontaneous IPSCs. Insets, Mean ± SEM frequency of IPSCs for each age group. C, Cumulative amplitude probability plots. Note: Abscissa in B is plotted on different timescales to better illustrate the differences between genotypes.
At 40 d, only one population of cells was present in both genotypes. The increase in frequency was maintained (p = 0.032) (Fig. 7B, inset). Cumulative frequency plots were significantly different (Fig. 7B), whereas no differences were obtained when cumulative amplitudes were assessed (Fig. 7C).
At 80 d, the effect was reversed, and R6/2 cells showed a statistically significant reduction in frequency of IPSCs (p = 0.00078). Significant differences were obtained when both cumulative frequency (Fig. 7B) and cumulative amplitude (Fig. 7C) were assessed.
IPSC kinetics
The kinetics of individual GABAA receptor-mediated currents were altered distinctly in cells from R6/2 mice (Fig. 8). Most notable was a distinct change in the form of the currents in the 21 d HF cells. Events from all other groups showed typical fast rise times, followed by an exponential decay, whereas currents of the R6/2 HF group displayed a fast rise time, followed by an initial decay, a plateau phase, and then a rapid decay (Fig. 8A, inset). Because this group of cells had such markedly different kinetics, exponential fits to the decay time were not performed, and no difference was found in mean rise times between cells from WT and R6/2 mice. At 21 d, the LF group of cells from R6/2 mice showed the typical exponential decay but displayed a slower decay time (p = 0.027) and a longer half-amplitude duration (p = 0.059). No differences were observed in the kinetics at 40 d. At 80 d, the decay of R6/2 IPSCs was significantly slower (p = 0.029), whereas the longer half-amplitude duration did not reach significance (p = 0.072). This was accompanied by a significant reduction in area under the curve of the IPSC from 925 ± 71 pA × ms in cells from WTs to 682 ± 64 pA × ms in those from R6/2 s (p = 0.016). There was no difference in mean amplitude at each age.
Figure 8.

A, Traces show examples of average IPSCs with an exponential fit for WT and R6/2 cells at each age (n > 100 per trace). Inset shows the different kinetics of IPSCs recorded in the HF group of R6/2 cells at 21 d. Because the decay kinetics do not fit an exponential function, analyses for this group were not performed. B, Bar graphs show rise times, decay times, and half-amplitude durations of spontaneous EPSCs at each age. Note the increase in decay times and half-amplitude durations of spontaneous IPSCs of R6/2 groups at 80 d.
Effects of TTX on IPSCs
Miniature IPSCs were examined in an additional population of cells by applying TTX in the presence of CNQX and AP-5 to slices from 21 d R6/2 mice. In this population of cells, TTX reduced the frequency of IPSCs in all groups (Figs. 7A, 9A, insets). Moreover, the differences between WT and R6/2 were eliminated in the presence of TTX in both the low- and high-frequency populations of cells (compare Figs. 7, 9).
Figure 9.

A, Cumulative frequency probability plots showing that TTX abolishes differences in frequency at 21 d but not 80 d. B, No differences were identified in cumulative amplitude probability plots at 21 d, but differences were maintained at 80 d. Traces in the presence of TTX are shown in Figure 6.
After the recording at −70 mV in the presence of TTX to determine the action potential dependency of EPSCs in slices from mice at 80 d, the holding potential was stepped up to +10 mV to isolate miniature IPSCs. CNQX and AP-5 were not present at 80 d in experiments assessing the effect of TTX (Figs. 7A, 9A,B). TTX reduced the frequency of IPSCs in both genotypes, but the difference in frequency was maintained (p = 0.010) (Fig. 9A). Cumulative probability plots revealed significant differences for both amplitudes and interevent intervals (Fig. 9A,B), suggesting contributions of both presynaptic and postsynaptic components.
Sensitivity of spontaneous IPSCs to GABAA receptor blockade
The prolonged kinetics of spontaneous IPSCs, the alterations in amplitudes of both spontaneous and miniature IPSCs, and the prolonged kinetics of GABA-evoked currents and differential sensitivity to zolpidem in dissociated neurons (see below) suggest that postsynaptic alterations of GABAA receptors may have occurred. Because no change in the total expression levels of GABA receptors has been identified in HD cortex (Yohrling and Cha, 2002), an alternative possibility is that the subunit composition of GABAA receptors is altered. GABAA receptor subunits are known to have varying sensitivities to GABAA receptor antagonists, including BIC (Zhang et al., 1995; Hansen et al., 1999). The sensitivity of spontaneous IPSCs to a low concentration (1 and 2 μm) of BIC was therefore examined in slices. At 21 (both LF and HF groups of cells) and 40 d, there was no significant difference between genotypes in the percentage block observed between cells from WT and R6/2 mice (data not shown). At 80 d, however, the sensitivity of IPSCs to blockade by BIC was reduced in cells from WT mice compared with earlier ages, whereas R6/2 mice showed a response similar to that at 21 and 40 d. When 1 μm BIC was applied, cells from R6/2 mice showed a greater reduction in IPSC frequency (−77.2 ± 10.0%; n = 11) than cells from WTs (−34.4 ± 14.2%; n = 9; p = 0.015). Subsequent application of 2 μm BIC further reduced IPSC frequencies, and the difference in percentage change between the genotypes was still evident (WT, −66.6 ± 10.1%; R6/2, −97.3 ± 1.3%; p = 0.0023). Application of 5 μm BIC completely blocked all IPSCs in both genotypes and at each age.
Evoked IPSCs
The differences in the frequencies of spontaneous and miniature IPSCs suggest altered presynaptic function. At 21 d, the increased frequency of IPSCs was dependent on action potentials, whereas at 80 d, the reduction in IPSC frequency was insensitive to TTX, suggesting independence of action potentials. Two other presynaptic alterations could be a reduction in n or Pr. Similar to glutamatergic synapses, Pr can be calculated at GABAergic synapses by examining paired-pulse ratios. A second predictor of presynaptic function is the CV, which is dependent on both n and Pr (Bekkers and Stevens, 1990; Malinow and Tsien, 1990; Choi and Lovinger 1997). Increases in CV are associated with a decrease in either n or Pr.
Evoked IPSCs were isolated by voltage clamping membranes at +10 mV and by blocking ionotropic glutamatergic currents with CNQX and AP-5. Evoked IPSCs were completely blocked by the application of either 5 μm BIC or 10 μm PTX (n = 4) (Fig. 10B). Initially, we studied the relationship between stimulation intensity and amplitude of evoked IPSCs in WT and R6/2 pyramidal neurons. A typical sigmoidal relationship was obtained from all cells studied. At 21 d, no difference was observed in the relationships between stimulation intensity and evoked IPSC amplitude between WT and R6/2 neurons (Fig. 10B). Separating cells into those that displayed low- and high-frequency spontaneous IPSCs had no effect on experimental outcome, and therefore data were pooled. At 80 d (Fig. 10D), however, WTs showed an increase in evoked IPSC amplitude, whereas R6/2s showed a decrease compared with amplitudes obtained from their respective genotypes at 21 d. Thus, evoked IPSCs in R6/2 neurons were smaller than in WTs at 80 d, and this reached significance at intensities >0.04 mA (p < 0.01 to p < 0.001).
Paired-pulse ratio
Stimulation intensities were subsequently set to evoke responses ∼50% of the maximal amplitude, and paired stimuli were applied at intervals between 25 and 400 ms. To demonstrate the specificity of this approach in determining presynaptic function, we initially made a number of manipulations known to alter synaptic transmission. We showed that, when Pr was reduced by halving extracellular calcium concentration from 2 to 1 mm, PPF at 25 ms was increased (a single example is shown in Fig. 10A, which was repeated in two other cells) (data not shown). Conversely, increasing Pr by doubling the extracellular calcium concentration to 4 mm reduced PPF. In contrast, reducing n by recruiting fewer afferent fibers at a lower stimulation intensity had no effect on PPF ratio. Postsynaptic manipulations also had no effect on experimental outcome. Altering postsynaptic electrochemical drive by changing the membrane holding potential from +10 to −70 mV (in the presence of CNQX and AP-5) or partially blocking GABAA receptors with 2 μm BIC had no effect on paired-pulse ratios. Thus, these data demonstrate that only alterations in Pr are expected to alter paired-pulse ratio (but see Clark et al., 1994).
At 21 d, a biphasic function was observed between interpulse interval and paired-pulse ratio (Fig. 10C). At an interval of 25 ms, PPF was consistently seen at WT synapses; no change was seen at an interval of 50 ms, whereas at 100–400 ms, PPD was observed. No difference in paired-pulse ratio was identified for R6/2 synapses at 21 d compared with WTs. Separating neurons into those displaying low- and high-frequency spontaneous IPSCs did not alter the outcome of this experiment, and data have been pooled. At 80 d, the biphasic function was maintained at cortical synapses in WTs. PPF at the 25 ms interval was enhanced over that seen at 21 d, and PPF was now observed at 50 ms intervals, indicating a lower probability of release in WTs at older ages. PPD was maintained at intervals of 100–400 ms (Fig. 10E). In contrast, 80 d R6/2 pyramidal cells did not display PPF but rather no difference and PPD at intervals of 25 and 50 ms, respectively (p < 0.001 and p = 0.007 with respect to WT). No significant differences were observed in the degree of PPD in WT and R6/2 neurons at intervals of 100–400 ms (p > 0.2) at 80 d.
Coefficient of variance
A second measure of presynaptic function, CV, was also calculated from successively evoked IPSCs. CV is dependent on both Pr and n. To demonstrate the ability to identify changes in presynaptic function at GABAergic synapses using this technique, manipulations of presynaptic and postsynaptic function were again used in three cells. Reducing Pr by reducing extracellular calcium increased the CV value (123 ± 18%), whereas increasing Pr with a high extracellular calcium reduced the CV (−50 ± 2%). Also, reducing n using a lower stimulation intensity increased CV (406 ± 118%), whereas increasing n using a higher stimulation intensity reduced CV (−28 ± 2%). In contrast, postsynaptic manipulations had little effect on CV. Voltage clamping cells at −70 mV (7 ± 1%) or reducing postsynaptic receptor number by partially blocking GABAA receptors with 2 μm BIC (7 ± 8%) had no effect on CV. Thus, changes in both Pr and n would be expected to alter CV values in R6/2 neurons. Furthermore, a change in CV while paired-pulse ratio remained constant would indicate a change in n in the absence of a change in Pr.
At 21 d, CV was statistically (p > 0.6) identical in WT (0.19 ± 0.02; n = 13) and R6/2 (0.20 ± 0.03; n = 13) cells. Separating cells into those that displayed low- and high-frequency spontaneous IPSCs had no effect on the experimental outcome, and data were pooled. CV was similar in WTs at 21 and 80 d (0.22 ± 0.03; n = 7; p > 0.3). In contrast, CV was reduced at 80 d in R6/2 (0.15 ± 0.05, n = 7) compared with WT neurons (p = 0.047).
GABA-evoked currents in dissociated pyramidal neurons
To assess purely postsynaptic function, we studied currents evoked by the application of GABA to dissociated cortical pyramidal neurons. GABA currents were evoked by application of GABA at increasing concentrations between 1 and 1000 μm (Fig. 11). At 21 and 40 d, no difference was observed in the amplitudes or current densities of evoked currents (Fig. 11A,B). At 80 d, mean amplitude of evoked currents were significantly smaller in R6/2 neurons at GABA concentrations of 10 μm and higher. However, when current densities were calculated, these differences were normalized (Fig. 11A,B).
Figure 11.

A, Typical GABA-evoked responses in dissociated pyramidal neurons from WT (black) and R6/2 (gray) mice at each age and at 10 and 1000 μm GABA. Note that, at 80 d, amplitudes are reduced in neurons from R6/2 s. B, Peak current densities at each age. Note that normalizing cells to capacitance eliminates the difference in current amplitude. C, GABA desensitization times in neurons from 40 d animals. D, Zolpidem modulation at 40 d. Typical traces from WT and R6/2 cells before and after zolpidem application.
Desensitization of GABA currents was also assessed at GABA concentrations between 10 and 1000 μm. Similar results were obtained at each of these concentrations and are presented at 1000 μm GABA in Figure 11C. At 21 d, desensitization times were statistically identical in WT and R6/2 neurons. At 40 d, two populations of cells were detected in R6/2s: one had “fast” desensitization times and were similar to WTs (p > 0.2; n = 8), whereas a second group had significantly slower desensitization times (p = 0.045 vs WT and p = 0.0016 vs R6/2 cells with “fast” desensitization times; n = 6). At 80 d, only one population of cells was identified, and mean desensitization times were significantly slower than WT (p = 0.044). Finally, as the presence or absence of certain GABAA receptor subunits influences GABA current kinetics, we tested zolpidem, a type I benzodiazepine that binds more specifically to GABAA receptors containing α1 subunits (Martínez-Torres et al., 2000; Sanna et al., 2002) in neurons from 40-d-old mice. Potentiation of GABA (10 μm) peak by zolpidem (0.1 μm) was significantly larger (p = 0.018) in WT (28.2 ± 3.4%; n = 9) pyramidal neurons compared with R6/2 (18.1 ± 2.1%; n = 11) (Fig. 11D).
Increased susceptibility to seizures
The presence in R6/2 pyramidal neurons of complex discharges after the application of BIC and the relative changes in EPSC and IPSC frequencies suggest that these mice may be more susceptible to seizures. Indeed, seizures have been reported in R6/2 mice during handling and may have been the cause of death in some mice (Mangiarini et al., 1996). Furthermore, seizures are a prominent symptom of juvenile HD, which is caused by CAG repeat lengths greater than ∼80 (Gambardella et al., 2001; Seneca et al., 2004). To investigate the susceptibility to seizures in these mice, systemic administration of the GABAA receptor antagonist PTX was used. PTX was administered, and latencies to seizure were recorded in R6/2 mice and their age-matched WT littermates. At all three ages, R6/2 mice showed significantly shorter latencies to onset of all stages of seizure activity compared with their WT counterparts (Fig. 12).
Figure 12.

R6/2 mice were more susceptible to seizures induced by systemic administration of the GABAA receptor antagonist picrotoxin. Significant deceases in latencies occurred at all ages for both clonic and tonic–clonic seizures.
Spontaneous postsynaptic currents in YAC128 and CAG 140 mice
We performed electrophysiological recordings from layer II/III pyramidal cells in slices from YAC128 and CAG140 KI mice (Fig. 13). The slow progression of the HD phenotype in these models requires recording from older animals, and we therefore opted not to perform an extensive longitudinal study similar to the one in the R6/2 but rather to restrict our analysis to 6 and 12 months in the YAC128 mice and to 12 months in CAG140 KI mice. At 6 months of age, YAC128 mice begin to show deficits on rotarod performance and become hypoactive. Reductions in brain weight or volume are not detected until 9 or 12 months (Slow et al., 2003). At 12 months, CAG140 KI mice display extensive motor and nonmotor deficits, a reduction in brain weight, and a reduction in DARPP-32-positive neurons (Menalled et al., 2003; Hickey et al., 2008).
Figure 13.

Cortical spontaneous synaptic currents in 6 (left) and 12 (middle) month YAC128 (white bars) and 12 month CAG140 KI mice (right; gray bars) and their respective WTs littermates (black bars in all graphs). A, Spontaneous EPSCs were recorded at a membrane potential of −70 mV. Distributions show amplitude–frequency histograms for EPSCs recorded in ACSF for each group. Insets show average frequencies. B, Cell membranes were voltage clamped at +10 mV and spontaneous IPSCs isolated using CNQX and AP-5. Distributions show amplitude–frequency histograms for IPSCs for each group. Insets show average frequencies.
Initially, cells were voltage clamped at −70 mV and basic membrane properties were recorded (Table 2). In pyramidal cells from both YAC128 (6 and 12 months) and CAG140 KI (12 months) mice, input resistance was significantly greater in mutants than in their respective WT controls. No significant differences were observed in membrane time constant or membrane capacitance. At a holding potential of −70 mV, spontaneous EPSC frequency was similar to WTs in pyramidal neurons from the 6-month-old YAC128 mice (p > 0.4) (Fig. 13A, left). In WTs, there was a reduction in frequency with age such that, by 12 months, a significantly higher frequency of spontaneous EPSCs in YAC128 compared with WTs was evident (p = 0.0097) (Fig. 13A, middle). Similarly, pyramidal neurons of 12 month CAG140 KI mice displayed a significantly greater frequency of EPSCs than their respective WTs (p = 0.037) (Fig. 13A, right).
Table 2.
Basic membrane properties of pyramidal neurons in YAC128 and CAG140 KI mice
| 6 month YAC128 (CsMeth) |
12 month YAC128 (CsMeth) |
12 month CAG140 KI (CsMeth) |
||||
|---|---|---|---|---|---|---|
| WT (n = 15) | YAC128 (n = 26) | WT (n = 8) | YAC128 (n = 8) | WT (n = 8) | KI (n = 7) | |
| Rm (MΩ) | 105 ± 11 | 173 ± 22* | 127 ± 16 | 206 ± 12*** | 104 ± 16 | 171 ± 31* |
| τ (ms) | 2.0 ± 0.2 | 2.2 ± 0.1 | 2.6 ± 0.2 | 2.3 ± 0.2 | 2.1 ± 0.02 | 2.9 ± 0.3 |
| Cm (pF) | 100 ± 10 | 93 ± 5 | 106 ± 11 | 95 ± 5 | 96 ± 11 | 102 ± 6 |
In each column, data for WT and mutant mice are presented. n values are indicated in parentheses. Significance is indicated by *p < 0.05; ***p < 0.001.
Subsequently, the membrane potential was stepped to +10 mV, and the ionotropic glutamate receptor antagonists CNQX and AP-5 were applied to isolate spontaneous IPSCs (Fig. 13B). At both ages studied, neurons from YAC128 mice displayed IPSCs of higher frequencies than their respective WTs (6 months, p = 0.024; 12 months, p = 0.00029). Pyramidal neurons of the 12 month CAG140 KIs also had a significantly greater frequency of IPSCs (p = 0.0049).
Discussion
The findings demonstrate alterations in excitatory and inhibitory inputs to cortical pyramidal neurons in three mouse models of HD. These changes produce a hyperexcitable cortex and a greater susceptibility to seizures. Differences in the R6/2 mouse were detected as early as 3 weeks, ∼2 weeks before the onset of the overt behavioral phenotype in the R6/2 and months before the detection of neuronal cell loss but at the same age range as the onset of cognitive deficits (Carter et al., 1999; Lione et al., 1999; Turmaine et al., 2000; Stack et al., 2005). Similar changes were reflected in the YAC128 and CAG140 models, demonstrating that these modifications are not particular to the R6/2 and are likely to translate to the human condition.
Basic membrane properties
Differences in basic membrane properties of pyramidal neurons are similar to results from R6/1 cortex (Cummings et al., 2006). We previously reported depolarized RMPs in striatal MSNs and reductions in inward and outward rectifying K+ currents (Levine et al., 1999; Klapstein et al., 2001; Ariano et al., 2005). Similar changes in K+ channel conductance may occur in HD cortical pyramidal neurons. Alternatively, the increased input resistance could be attributable to dendritic thinning and loss of spines, which was reported previously using the Golgi technique and appear to be characteristic of R6/2 cortical neurons (Klapstein et al., 2001).
Cortical excitation
An increased excitatory drive was observed in all three models. The greater frequency of EPSCs was maintained in TTX, pointing to a presynaptic influence and indicating independence from action potential-evoked release. A number of presynaptic proteins that regulate neurotransmitter release are known to be altered in models of HD (Metzler et al., 2001; Morton et al., 2001; Liévens et al., 2002; Li et al., 2003; Huang et al., 2004), and these could effect a change in EPSC frequency. The increase in EPSC frequency does not appear to be a result of the reduced IPSC frequency in the R6/2 mouse because the increase in EPSCs was also evident in YAC128 and CAG140 KI mice, which maintained an increase in IPSCs at each age examined. The increase in spontaneous EPSC frequency was paralleled by an increase in evoked EPSC amplitude and a decrease in paired-pulse ratio, indicating an increase in probability of release (Zucker, 1989). At 80 d, VGLUT1 expression was increased, providing morphological evidence for increased excitatory neurotransmission in R6/2 mice (see supplemental material, available at www.jneurosci.org). Previously, we showed that AMPA receptor-mediated currents are smaller and possess faster decay kinetics in dissociated R6/2 pyramidal neurons (André et al., 2006). In those experiments, AMPA responses desensitized faster, suggesting that R6/2 cortical pyramidal neurons express more flop subunits. This difference in receptor subtype may also underlie the faster decay kinetics observed in the slice.
Cortical inhibition
The fact that blockade of GABAA receptors led to a greater increase in frequency of EPSCs in R6/2 cells than in WT cells supports the idea that cortical pyramidal neurons are inhibited to a greater degree in 21 d R6/2 mice compared with WTs. Inhibitory currents were also altered early in the progression of the phenotype. When action potential-driven GABA release was eliminated using TTX, the differences in IPSC pattern and frequency were removed. Two alternative presynaptic alterations that could result in an increased frequency of spontaneous IPSCs are an increased probability of neurotransmitter release or number of release sites. However, at 21 d, no differences were identified in paired-pulse ratios or CV. Thus, it would appear that the intrinsic firing properties of GABAergic interneurons are altered in mouse models of HD, resulting in an increased inhibitory drive onto pyramidal neurons. Although an alteration in postsynaptic receptor numbers could also affect frequency, this is unlikely because cumulative amplitude plots for miniature IPSCs, and amplitude and current densities of GABA-evoked currents in dissociated neurons, were unaltered. Conversely, kinetics of spontaneous IPSCs and evoked GABA currents in dissociated neurons were prolonged. Alterations in subunit composition are known to affect kinetics (Okada et al., 2000; Vicini et al., 2001), and decreases in mRNA for the GABAA subunits α5 and γ2 have been demonstrated in the motor cortex of HD patients (Hodges et al., 2006). Furthermore, at 40 d of age, a subpopulation of neurons also showed delayed GABA current desensitization times and differed in their modulation by zolpidem, a benzodiazepine that prefers α1-subunit-containing GABAA receptors. At 80 d, GAT1 expression was reduced, suggesting that clearance from the synaptic cleft could also be altered, albeit at a later stage in the phenotype (see supplemental material, available at www.jneurosci.org).
The reduced IPSC frequency at 80 d was insensitive to TTX and thus independent of action potentials. Paired-pulse facilitation of IPSCs was no longer expressed, indicating an increased probability of release. However, paired-pulse depression at short intervals (as we show at 50 ms) indicates depletion of neurotransmitter from the presynaptic terminal (Zucker, 1989). Thus, although there is an increased probability of release, this is confounded by a reduction in primed, readily releasable GABA vesicles within interneuronal synaptic terminals, and this may underlie the reduced frequency of spontaneous IPSCs. The current data do not rule out the possibility that a reduction in the number of release sites also could occur. The most parsimonious interpretation of the reduction of GAT1 at this age is a correspondence with a reduction in synapse number. However, because the paired-pulse ratio is independent of number of release sites, the changes we observed are likely attributable to altered probability of release. Postsynaptic alterations could also interact to change synaptic function at cortical synapses at 80 d, as demonstrated by changes in amplitudes of miniature IPSCs, amplitudes of GABA-evoked currents in dissociated cells, and a differential sensitivity of spontaneous IPSCs to blockade by BIC.
GABAergic interneurons provide the inhibitory drive onto cortical pyramidal neurons (Markram et al., 2004). Interneurons are believed to be relatively spared from neurodegenerative changes in HD (Ferrante et al., 1985; Vonsattel et al., 1985) and have not received extensive investigation. Recent studies, however, have begun to provide evidence that cortical interneurons play an important role in the development of the HD phenotype (Gu et al., 2005; Spampanato et al., 2008).
Hyperexcitability in the R6/2
Evidence for hyperexcitability within R6/2 cortical pyramidal cells occurred at all ages. Cortical hyperexcitability may explain the large-amplitude events within the striatum (Cepeda et al., 2003) and may lead to excitotoxicity in both regions. Large influxes of calcium mediated by abnormal depolarizations can activate cell-death cascades (Garthwaite, 1994). Depolarized RMP in cortical pyramidal neurons (current data; Cummings et al., 2006) and MSNs (Levine et al., 1999; Klapstein et al., 2001) could increase calcium entry, because the Mg2+ block of NMDA receptors will be partially alleviated and may be exacerbated further by the enhanced NMDA receptor function present in a population of MSNs (Levine et al., 1999; Cepeda et al., 2001; Zeron et al., 2002, 2004; Starling et al., 2005). Hyperexcitability of the cortex may also explain why R6/2 mice and individuals with juvenile HD display seizures. Interestingly, a short-acting anesthetic with antiepileptic properties as well as being a GABA uptake inhibitor ameliorates the R6/2 phenotype (Pallier et al., 2007; Masuda et al., 2008).
Cortex and striatum
The observation that, in cells from 80 d R6/2 mice, excitatory input to pyramidal neurons is enhanced whereas inhibitory inputs are reduced is in the opposite direction to alterations observed in the striatum. MSNs display reductions in excitatory inputs (Cepeda et al., 2003; Rossi et al., 2006) and increases in inhibitory inputs (Cepeda et al., 2004). Because mutant huntingtin is expressed ubiquitously throughout the body, one may predict that all regions of the brain would show similar electrophysiological dysfunctions. However, previous studies also have highlighted opposite changes in different brain regions. In striatum, NMDA currents were larger in a population of MSNs and less sensitive to Mg2+ blockade (Cepeda et al., 2001; Starling et al., 2005), whereas in cortex the opposite occurred (André et al., 2006). R6/2 (Murphy et al., 2000) and R6/1 (Milnerwood et al., 2006) mice express aberrant long-term depression (LTD) in CA1 of the hippocampus, a region in which LTD is normally downregulated in the adult mouse (Milner et al., 2004). In contrast, the perirhinal cortex, which normally expresses LTD, fails to express LTD in R6/1 mice (Cummings et al., 2006, 2007). It therefore appears that neuronal dysfunction occurs not only in a cell-autonomous nature but that the cellular environment may determine the type of dysfunction. The striatum is more affected in HD not because MSNs are more inherently susceptible than cortical neurons per se but rather because the highly integrative nature of the striatum places it in the unique position of receiving a wide range of aberrant inputs from cortex and other regions.
In summary, the present findings demonstrate alterations in the physiology of cortical pyramidal neurons across several mouse models of HD. Some of the changes precede the onset of an overt behavioral phenotype. These changes differ from striatal alterations, suggesting that therapies may need to be regionally oriented as well as delivered early in the time course of disease progression.
Footnotes
This work was supported by National Institutes of Health Grant NS41574 and a contract from CHDI. We thank Donna Crandall for assistance with figure preparation, Bianca Marcolino and Michael Yim for help with event counts, and Irene Yamazaki and My Huynh for histological processing.
References
- André VM, Cepeda C, Venegas A, Gomez Y, Levine MS. Altered cortical glutamate receptor function in the R6/2 model of Huntington's disease. J Neurophysiol. 2006;95:2108–2119. doi: 10.1152/jn.01118.2005. [DOI] [PubMed] [Google Scholar]
- Ariano MA, Cepeda C, Calvert CR, Flores-Hernández J, Hernández-Echeagaray E, Klapstein GJ, Chandler SH, Aronin N, DiFiglia M, Levine MS. Striatal potassium channel dysfunction in Huntington's disease transgenic mice. J Neurophysiol. 2005;93:2565–2574. doi: 10.1152/jn.00791.2004. [DOI] [PubMed] [Google Scholar]
- Bäckman L, Farde L. Dopamine and cognitive functioning: Brain imaging findings in Huntington's disease and normal aging. Scand J Psychol. 2001;42:287–296. doi: 10.1111/1467-9450.00238. [DOI] [PubMed] [Google Scholar]
- Bates G, Harper PS, Jones L. Ed 3. Oxford: Oxford UP; 2002. Huntington's disease. [Google Scholar]
- Bates GP, Murphy KPSJ. Mouse models of Huntington's disease. In: Bates GP, Harper PS, Jones L, editors. Huntington's disease. Ed 3. Oxford: Oxford UP; 2002. pp. 387–426. [Google Scholar]
- Bekkers JM, Stevens CF. Presynaptic mechanism for long-term potentiation in the hippocampus. Nature. 1990;346:724–729. doi: 10.1038/346724a0. [DOI] [PubMed] [Google Scholar]
- Berrios GE, Wagle AC, Marková IS, Wagle SA, Rosser A, Hodges JR. Psychiatric symptoms in neurologically asymptomatic Huntington's disease gene carriers: a comparison with gene negative at risk subjects. Acta Psychiatr Scand. 2002;105:224–230. doi: 10.1034/j.1600-0447.2002.0o456.x. [DOI] [PubMed] [Google Scholar]
- Carter RJ, Lione LA, Humby T, Mangiarini L, Mahal A, Bates GP, Dunnett SB, Morton AJ. Characterization of progressive motor deficits in mice transgenic for the human Huntington's disease mutation. J Neurosci. 1999;19:3248–3257. doi: 10.1523/JNEUROSCI.19-08-03248.1999. [DOI] [PMC free article] [PubMed] [Google Scholar]
- Cepeda C, Ariano MA, Calvert CR, Flores-Hernández J, Chandler SH, Leavitt BR, Hayden MR, Levine MS. NMDA receptor function in mouse models of Huntington disease. J Neurosci Res. 2001;66:525–539. doi: 10.1002/jnr.1244. [DOI] [PubMed] [Google Scholar]
- Cepeda C, Hurst RS, Calvert CR, Hernández-Echeagaray E, Nguyen OK, Jocoy E, Christian LJ, Ariano MA, Levine MS. Transient and progressive electrophysiological alterations in the corticostriatal pathway in a mouse model of Huntington's disease. J Neurosci. 2003;23:961–969. doi: 10.1523/JNEUROSCI.23-03-00961.2003. [DOI] [PMC free article] [PubMed] [Google Scholar]
- Cepeda C, Starling AJ, Wu N, Nguyen OK, Uzgil B, Soda T, André VM, Ariano MA, Levine MS. Increased GABAergic function in mouse models of Huntington's disease: reversal by BDNF. J Neurosci Res. 2004;78:855–867. doi: 10.1002/jnr.20344. [DOI] [PubMed] [Google Scholar]
- Cepeda C, Wu N, André VM, Cummings DM, Levine MS. The corticostriatal pathway in Huntington's disease. Prog Neurobiol. 2007;81:253–271. doi: 10.1016/j.pneurobio.2006.11.001. [DOI] [PMC free article] [PubMed] [Google Scholar]
- Choi S, Lovinger DM. Decreased probability of neurotransmitter release underlies striatal long-term depression and postnatal development of corticostriatal synapses. Proc Natl Acad Sci U S A. 1997;94:2665–2670. doi: 10.1073/pnas.94.6.2665. [DOI] [PMC free article] [PubMed] [Google Scholar]
- Clark KA, Randall AD, Collingridge GL. A comparison of paired-pulsed facilitation of AMPA and NMDA receptor-mediated excitatory postsynaptic currents in the hippocampus. Exp Brain Res. 1994;101:272–278. doi: 10.1007/BF00228747. [DOI] [PubMed] [Google Scholar]
- Cummings DM, Milnerwood AJ, Dallérac GM, Waights V, Brown JY, Vatsavayai SC, Hirst MC, Murphy KPSJ. Aberrant cortical synaptic plasticity and dopaminergic dysfunction in a mouse model of Huntington's disease. Hum Mol Genet. 2006;15:2856–2868. doi: 10.1093/hmg/ddl224. [DOI] [PubMed] [Google Scholar]
- Cummings DM, Milnerwood AJ, Dallérac GM, Vatsavayai SC, Hirst MC, Murphy KPSJ. Abnormal cortical synaptic plasticity in mice transgenic for exon 1 of the human Huntington's disease mutation. Brain Res Bull. 2007;72:103–107. doi: 10.1016/j.brainresbull.2006.10.016. [DOI] [PubMed] [Google Scholar]
- Cummings DM, Yim MM, Alaghband Y, Malvar JS, Tsuruyama K, Joshi PR, Cepeda C, Levine MS. The R6/2 phenotype is CAG repeat length-dependent. Soc Neurosci Abstr. 2008;34:443–011. [Google Scholar]
- Ferrante RJ, Kowall NW, Beal MF, Richardson EP, Jr, Bird ED, Martin JB. Selective sparing of a class of striatal neurons in Huntington's disease. Science. 1985;230:561–563. doi: 10.1126/science.2931802. [DOI] [PubMed] [Google Scholar]
- Gambardella A, Muglia M, Labate A, Magariello A, Gabriele AL, Mazzei R, Pirritano D, Conforti FL, Patitucci A, Valentino P, Zappia M, Quattrone A. Juvenile Huntington's disease presenting as progressive myoclonic epilepsy. Neurology. 2001;57:708–711. doi: 10.1212/wnl.57.4.708. [DOI] [PubMed] [Google Scholar]
- Garthwaite J. NMDA receptors, neuronal development, and neurodegeneration. In: Collingridge GL, Watkins JC, editors. The NMDA receptor. Oxford: Oxford UP; 1994. pp. 428–456. [Google Scholar]
- Gu X, Li C, Wei W, Lo V, Gong S, Li SH, Iwasato T, Itohara S, Li XJ, Mody I, Heintz N, Yang XW. Pathological cell-cell interactions elicited by a neuropathogenic form of mutant Huntingtin contribute to cortical pathogenesis in HD mice. Neuron. 2005;46:433–444. doi: 10.1016/j.neuron.2005.03.025. [DOI] [PubMed] [Google Scholar]
- Hansen SL, Fjalland B, Jackson MB. Differential blockade of gamma-aminobutyric acid type A receptors by the neuroactive steroid dehydroepiandrosterone sulfate in posterior and intermediate pituitary. Mol Pharmacol. 1999;55:489–496. [PubMed] [Google Scholar]
- Hickey MA, Kosmalska A, Enayati J, Cohen R, Zeitlin S, Levine MS, Chesselet MF. Extensive early motor and non-motor behavioral deficits are followed by striatal loss in knock-in Huntington's disease mice. Neuroscience. 2008;157:280–295. doi: 10.1016/j.neuroscience.2008.08.041. [DOI] [PMC free article] [PubMed] [Google Scholar]
- Hodges A, Strand AD, Aragaki AK, Kuhn A, Sengstag T, Hughes G, Elliston LA, Hartog C, Goldstein DR, Thu D, Hollingsworth ZR, Collin F, Synek B, Holmans PA, Young AB, Wexler NS, Delorenzi M, Kooperberg C, Augood SJ, Faull RL, Olson JM, Jones L, Luthi-Carter R. Regional and cellular gene expression changes in human Huntington's disease brain. Hum Mol Genet. 2006;15:965–977. doi: 10.1093/hmg/ddl013. [DOI] [PubMed] [Google Scholar]
- Horikawa K, Armstrong WE. A versatile means of intracellular labeling: injection of biocytin and its detection with avidin conjugates. J Neurosci Methods. 1988;25:1–11. doi: 10.1016/0165-0270(88)90114-8. [DOI] [PubMed] [Google Scholar]
- Huang K, Yanai A, Kang R, Arstikaitis P, Singaraja RR, Metzler M, Mullard A, Haigh B, Gauthier-Campbell C, Gutekunst CA, Hayden MR, El-Husseini A. Huntingtin-interacting protein HIP14 is a palmitoyl transferase involved in palmitoylation and trafficking of multiple neuronal proteins. Neuron. 2004;44:977–986. doi: 10.1016/j.neuron.2004.11.027. [DOI] [PubMed] [Google Scholar]
- Huntington's Disease Collaborative Research Group. A novel gene containing a trinucleotide repeat that is expanded and unstable on Huntington's disease chromosomes. Cell. 1993;72:971–983. doi: 10.1016/0092-8674(93)90585-e. [DOI] [PubMed] [Google Scholar]
- Klapstein GJ, Fisher RS, Zanjani H, Cepeda C, Jokel ES, Chesselet MF, Levine MS. Electrophysiological and morphological changes in striatal spiny neurons in R6/2 Huntington's disease transgenic mice. J Neurophysiol. 2001;86:2667–2677. doi: 10.1152/jn.2001.86.6.2667. [DOI] [PubMed] [Google Scholar]
- Levine MS, Klapstein GJ, Koppel A, Gruen E, Cepeda C, Vargas ME, Jokel ES, Carpenter EM, Zanjani H, Hurst RS, Efstratiadis A, Zeitlin S, Chesselet MF. Enhanced sensitivity to N-methyl-d-aspartate receptor activation in transgenic and knockin mouse models of Huntington's disease. J Neurosci Res. 1999;58:515–532. [PubMed] [Google Scholar]
- Levine MS, Cepeda C, Hickey MA, Fleming SM, Chesselet MF. Genetic mouse models of Huntington's and Parkinson's diseases: illuminating but imperfect. Trends Neurosci. 2004;27:691–697. doi: 10.1016/j.tins.2004.08.008. [DOI] [PubMed] [Google Scholar]
- Li H, Wyman T, Yu ZX, Li SH, Li XJ. Abnormal association of mutant huntingtin with synaptic vesicles inhibits glutamate release. Hum Mol Genet. 2003;12:2021–2030. doi: 10.1093/hmg/ddg218. [DOI] [PubMed] [Google Scholar]
- Liévens JC, Woodman B, Mahal A, Bates GP. Abnormal phosphorylation of synapsin I predicts a neuronal transmission impairment in the R6/2 Huntington's disease transgenic mice. Mol Cell Neurosci. 2002;20:638–648. doi: 10.1006/mcne.2002.1152. [DOI] [PubMed] [Google Scholar]
- Lione LA, Carter RJ, Hunt MJ, Bates GP, Morton AJ, Dunnett SB. Selective discrimination learning impairments in mice expressing the human Huntington's disease mutation. J Neurosci. 1999;19:10428–10437. doi: 10.1523/JNEUROSCI.19-23-10428.1999. [DOI] [PMC free article] [PubMed] [Google Scholar]
- Malinow R, Tsien RW. Presynaptic enhancement shown by whole-cell recordings of long-term potentiation in hippocampal slices. Nature. 1990;346:177–180. doi: 10.1038/346177a0. [DOI] [PubMed] [Google Scholar]
- Mangiarini L, Sathasivam K, Seller M, Cozens B, Harper A, Hetherington C, Lawton M, Trottier Y, Lehrach H, Davies SW, Bates GP. Exon 1 of the HD gene with an expanded CAG repeat is sufficient to cause a progressive neurological phenotype in transgenic mice. Cell. 1996;87:493–506. doi: 10.1016/s0092-8674(00)81369-0. [DOI] [PubMed] [Google Scholar]
- Markram H, Toledo-Rodriguez M, Wang Y, Gupta A, Silberberg G, Wu C. Interneurons of the neocortical inhibitory system. Nat Rev Neurosci. 2004;5:793–807. doi: 10.1038/nrn1519. [DOI] [PubMed] [Google Scholar]
- Martínez-Torres A, Demuro A, Miledi R. GABArho 1/GABAAalpha 1 receptor chimeras to study receptor desensitization. Proc Natl Acad Sci U S A. 2000;97:3562–3566. doi: 10.1073/pnas.050582397. [DOI] [PMC free article] [PubMed] [Google Scholar]
- Masuda N, Peng Q, Li Q, Jiang M, Liang Y, Wang X, Zhao M, Wang W, Ross CA, Duan W. Tiagabine is neuroprotective in the N171–82Q and R6/2 mouse models of Huntington's disease. Neurobiol Dis. 2008;30:293–302. doi: 10.1016/j.nbd.2008.01.014. [DOI] [PMC free article] [PubMed] [Google Scholar]
- Menalled LB, Sison JD, Dragatsis I, Zeitlin S, Chesselet MF. Time course of early motor and neuropathological anomalies in a knock-in mouse model of Huntington's disease with 140 CAG repeats. J Comp Neurol. 2003;465:11–26. doi: 10.1002/cne.10776. [DOI] [PubMed] [Google Scholar]
- Metzler M, Legendre-Guillemin V, Gan L, Chopra V, Kwok A, McPherson PS, Hayden MR. HIP1 functions in clathrin-mediated endocytosis through binding to clathrin and adaptor protein 2. J Biol Chem. 2001;276:39271–39276. doi: 10.1074/jbc.C100401200. [DOI] [PubMed] [Google Scholar]
- Milner AJ, Cummings DM, Spencer JP, Murphy KPSJ. Bi-directional plasticity and age-dependent long-term depression at mouse CA3-CA1 hippocampal synapses. Neurosci Lett. 2004;367:1–5. doi: 10.1016/j.neulet.2004.04.056. [DOI] [PubMed] [Google Scholar]
- Milnerwood AJ, Cummings DM, Dallérac GM, Brown JY, Vatsavayai SC, Hirst MC, Rezaie P, Murphy KP. Early development of aberrant synaptic plasticity in a mouse model of Huntington's disease. Hum Mol Genet. 2006;15:1690–1703. doi: 10.1093/hmg/ddl092. [DOI] [PubMed] [Google Scholar]
- Morton AJ, Faull RL, Edwardson JM. Abnormalities in the synaptic vesicle fusion machinery in Huntington's disease. Brain Res Bull. 2001;56:111–117. doi: 10.1016/s0361-9230(01)00611-6. [DOI] [PubMed] [Google Scholar]
- Murphy KP, Carter RJ, Lione LA, Mangiarini L, Mahal A, Bates GP, Dunnett SB, Morton AJ. Abnormal synaptic plasticity and impaired spatial cognition in mice transgenic for exon 1 of the human Huntington's disease mutation. J Neurosci. 2000;20:5115–5123. doi: 10.1523/JNEUROSCI.20-13-05115.2000. [DOI] [PMC free article] [PubMed] [Google Scholar]
- Nisenbaum ES, Wilson CJ. Potassium currents responsible for inward and outward rectification in rat neostriatal spiny projection neurons. J Neurosci. 1995;15:4449–4463. doi: 10.1523/JNEUROSCI.15-06-04449.1995. [DOI] [PMC free article] [PubMed] [Google Scholar]
- Okada M, Onodera K, Van Renterghem C, Sieghart W, Takahashi T. Functional correlation of GABAA receptor alpha subunits expression with the properties of IPSCs in the developing thalamus. J Neurosci. 2000;20:2202–2208. doi: 10.1523/JNEUROSCI.20-06-02202.2000. [DOI] [PMC free article] [PubMed] [Google Scholar]
- Pallier PN, Maywood ES, Zheng Z, Chesham JE, Inyushkin AN, Dyball R, Hastings MH, Morton AJ. Pharmacological imposition of sleep slows cognitive decline and reverses dysregulation of circadian gene expression in a transgenic mouse model of Huntington's disease. J Neurosci. 2007;27:7869–7878. doi: 10.1523/JNEUROSCI.0649-07.2007. [DOI] [PMC free article] [PubMed] [Google Scholar]
- Paulsen JS, Langbehn DR, Stout JC, Aylward E, Ross CA, Nance M, Guttman M, Johnson S, MacDonald M, Beglinger LJ, Duff K, Kayson E, Biglan K, Shoulson I, Oakes D, Hayden M. Detection of Huntington's disease decades before diagnosis: the predict HD study. J Neurol Neurosurg Psychiatry. 2008;79:874–880. doi: 10.1136/jnnp.2007.128728. [DOI] [PMC free article] [PubMed] [Google Scholar]
- Racine RJ. Modification of seizure activity by electrical stimulation. II. Motor seizure. Electroencephalogr Clin Neurophysiol. 1972;32:281–294. doi: 10.1016/0013-4694(72)90177-0. [DOI] [PubMed] [Google Scholar]
- Reyes A, Galarraga E, Flores-Hernández J, Tapia D, Bargas J. Passive properties of neostriatal neurons during potassium conductance blockade. Exp Brain Res. 1998;120:70–84. doi: 10.1007/s002210050379. [DOI] [PubMed] [Google Scholar]
- Rosas HD, Hevelone ND, Zaleta AK, Greve DN, Salat DH, Fischl B. Regional cortical thinning in preclinical Huntington disease and its relationship to cognition. Neurology. 2005;65:745–747. doi: 10.1212/01.wnl.0000174432.87383.87. [DOI] [PubMed] [Google Scholar]
- Rosas HD, Salat DH, Lee SY, Zaleta AK, Pappu V, Fischl B, Greve D, Hevelone N, Hersch SM. Cerebral cortex and the clinical expression of Huntington's disease: complexity and heterogeneity. Brain. 2008;131:1057–1068. doi: 10.1093/brain/awn025. [DOI] [PMC free article] [PubMed] [Google Scholar]
- Rossi S, Prosperetti C, Picconi B, De Chiara V, Mataluni G, Bernardi G, Calabresi P, Centonze D. Deficits of glutamate transmission in the striatum of toxic and genetic models of Huntington's disease. Neurosci Lett. 2006;410:6–10. doi: 10.1016/j.neulet.2006.09.056. [DOI] [PubMed] [Google Scholar]
- Sanna E, Busonero F, Talani G, Carta M, Massa F, Peis M, Maciocco E, Biggio G. Comparison of the effects of zaleplon, zolpidem, and triazolam at various GABA(A) receptor subtypes. Eur J Pharmacol. 2002;451:103–110. doi: 10.1016/s0014-2999(02)02191-x. [DOI] [PubMed] [Google Scholar]
- Seneca S, Fagnart D, Keymolen K, Lissens W, Hasaerts D, Debulpaep S, Desprechins B, Liebaers I, De Meirleir L. Early onset Huntington disease: a neuronal degeneration syndrome. Eur J Pediatr. 2004;163:717–721. doi: 10.1007/s00431-004-1537-3. [DOI] [PubMed] [Google Scholar]
- Slow EJ, van Raamsdonk J, Rogers D, Coleman SH, Graham RK, Deng Y, Oh R, Bissada N, Hossain SM, Yang YZ, Li XJ, Simpson EM, Gutekunst CA, Leavitt BR, Hayden MR. Selective striatal neuronal loss in a YAC128 mouse model of Huntington disease. Hum Mol Genet. 2003;12:1555–1567. doi: 10.1093/hmg/ddg169. [DOI] [PubMed] [Google Scholar]
- Spampanato J, Gu X, Yang XW, Mody I. Progressive synaptic pathology of motor cortical neurons in a BAC transgenic mouse model of Huntington's disease. Neuroscience. 2008;157:606–620. doi: 10.1016/j.neuroscience.2008.09.020. [DOI] [PMC free article] [PubMed] [Google Scholar]
- Stack EC, Kubilus JK, Smith K, Cormier K, Del Signore SJ, Guelin E, Ryu H, Hersch SM, Ferrante RJ. Chronology of behavioral symptoms and neuropathological sequela in R6/2 Huntington's disease transgenic mice. J Comp Neurol. 2005;490:354–370. doi: 10.1002/cne.20680. [DOI] [PubMed] [Google Scholar]
- Starling AJ, André VM, Cepeda C, de Lima M, Chandler SH, Levine MS. Alterations in N-methyl-d-aspartate receptor sensitivity and magnesium blockade occur early in development in the R6/2 mouse model of Huntington's disease. J Neurosci Res. 2005;82:377–386. doi: 10.1002/jnr.20651. [DOI] [PubMed] [Google Scholar]
- Turmaine M, Raza A, Mahal A, Mangiarini L, Bates GP, Davies SW. Nonapoptotic neurodegeneration in a transgenic mouse model of Huntington's disease. Proc Natl Acad Sci U S A. 2000;97:8093–8097. doi: 10.1073/pnas.110078997. [DOI] [PMC free article] [PubMed] [Google Scholar]
- Uchimura N, Cherubini E, North RA. Inward rectification in rat nucleus accumbens neurons. J Neurophysiol. 1989;62:1280–1286. doi: 10.1152/jn.1989.62.6.1280. [DOI] [PubMed] [Google Scholar]
- Vicini S, Ferguson C, Prybylowski K, Kralic J, Morrow AL, Homanics GE. GABAA receptor α1 subunit deletion prevents developmental changes of inhibitory synaptic currents in cerebellar neurons. J Neurosci. 2001;21:3009–3016. doi: 10.1523/JNEUROSCI.21-09-03009.2001. [DOI] [PMC free article] [PubMed] [Google Scholar]
- Vonsattel JP, Myers RH, Stevens TJ, Ferrante RJ, Bird ED, Richardson EP., Jr Neuropathological classification of Huntington's disease. J Neuropathol Exp Neurol. 1985;44:559–577. doi: 10.1097/00005072-198511000-00003. [DOI] [PubMed] [Google Scholar]
- Woodman B, Butler R, Landles C, Lupton MK, Tse J, Hockly E, Moffitt H, Sathasivam K, Bates GP. The Hdh(Q150/Q150) knock-in mouse model of HD and the R6/2 exon 1 model develop comparable and widespread molecular phenotypes. Brain Res Bull. 2007;72:83–97. doi: 10.1016/j.brainresbull.2006.11.004. [DOI] [PubMed] [Google Scholar]
- Yohrling GJ, IV, Cha JH. Neurochemistry of Huntington's disease. In: Bates GP, Harper PS, Jones L, editors. Huntington's disease. Ed 3. Oxford: Oxford UP; 2002. pp. 276–308. [Google Scholar]
- Zeron MM, Hansson O, Chen N, Wellington CL, Leavitt BR, Brundin P, Hayden MR, Raymond LA. Increased sensitivity to N-methyl-d-aspartate receptor-mediated excitotoxicity in a mouse model of Huntington's disease. Neuron. 2002;33:849–860. doi: 10.1016/s0896-6273(02)00615-3. [DOI] [PubMed] [Google Scholar]
- Zeron MM, Fernandes HB, Krebs C, Shehadeh J, Wellington CL, Leavitt BR, Baimbridge KG, Hayden MR, Raymond LA. Potentiation of NMDA receptor-mediated excitotoxicity linked with intrinsic apoptotic pathway in YAC transgenic mouse model of Huntington's disease. Mol Cell Neurosci. 2004;25:469–479. doi: 10.1016/j.mcn.2003.11.014. [DOI] [PubMed] [Google Scholar]
- Zhang HG, Lee HJ, Rocheleau T, ffrench-Constant RH, Jackson MB. Subunit composition determines picrotoxin and bicuculline sensitivity of Drosophila gamma-aminobutyric acid receptors. Mol Pharmacol. 1995;48:835–840. [PubMed] [Google Scholar]
- Zucker RS. Short-term synaptic plasticity. Annu Rev Neurosci. 1989;12:13–31. doi: 10.1146/annurev.ne.12.030189.000305. [DOI] [PubMed] [Google Scholar]