

Abstract
When some genes are silenced, their positions within the nucleus can change dramatically [1,2]. It is unclear, however, whether genes move to new positions when they are activated [3]. The chromosomes within the polarized nuclei of the fruit fly Drosophila have a well-characterized apical–basal orientation (the Rabl configuration [4]). Using a high-resolution in situ hybridization method [5], we found that each of 15 transcribed genes was localized as predicted by their chromosomal position and by the known polarized organization of the chromosomes. We also found that, within their specific apical–basal plane, most nascent transcript foci could occupy any radial position. There was no correlation between the apical–basal position of the transcribed locus and the final cytoplasmic site of localization of the RNA along the apical–basal axis of the cell. There was also no relationship between the distance of loci from the nuclear periphery and the amount of nascent mRNA decorating the gene. Our results are consistent with the view that effective transcription can occur without major re-localization of the genes themselves.
Results and discussion
Nascent transcript foci are consistently positioned in the apical–basal nuclear axis
It is unclear to what extent the intranuclear position of genes changes according to their differing transcriptional states in various parts of the Drosophila embryo. Such potential variation in nuclear localization would not necessarily be apparent in studies describing the average intranuclear position of genes throughout the entire embryo [6]. We used a recently developed high-resolution RNA in situ hybridization method [5] to examine the localization of 15 different transcribed genes. In addition to cytoplasmic mRNA, nascent transcripts are visible as one to four small fluorescent foci within each nucleus that expresses a gene, depending on the state of pairing and DNA replication. The positions of 19–52 individual nascent transcript foci from each gene were mapped in nuclei from optical sections through the middle of two to three embryos of similar age (Figure 1b). The apical–basal distribution of the nascent transcript foci on the X chromosome and chromosome arms 2R and 3R were determined by plotting all the data onto the outline of a single representative nucleus (Figure 1c and see Supplementary material).
Figure 1.
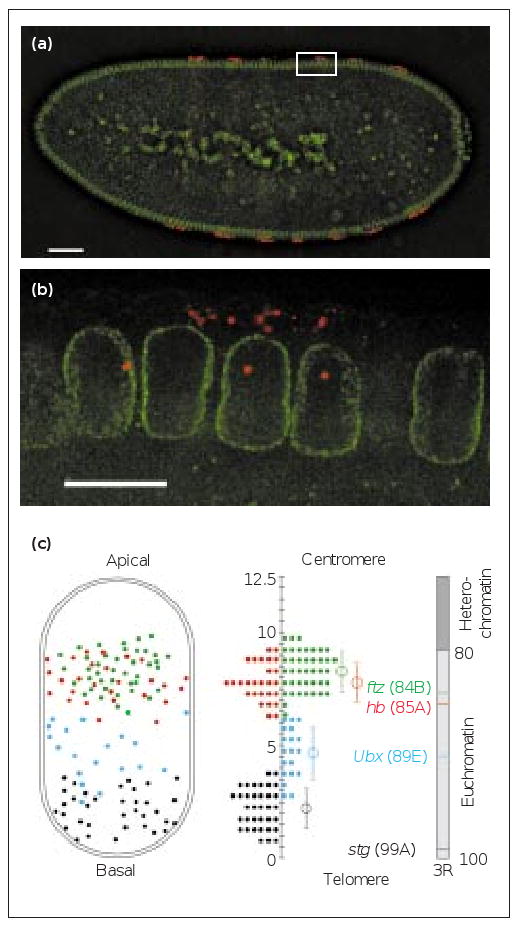
The position of nascent transcript foci along the apical–basal axis of embryonic nuclei. (a,b) Optical sections through the middle of a mid-interphase 14, blastoderm embryo expressing ftz mRNA (red) in seven stripes. AlexaFluor488-conjugated wheat germ agglutinin (AlexaWGA) marks the nuclear envelope (green). (a) A low-magnification view of the embryo. (b) A high-magnification view of the boxed area in (a). Note that ftz mRNA is exclusively localised in the apical cytoplasm above the nuclei and as nascent transcript foci within expressing nuclei [14]. The scale bar represents 50 μm in (a) and 10 μm in (b). (c) A map of the intranuclear positions of four transcribed genes fushi tarazu (ftz, green), hunchback (hb, red), Ultrabithorax (Ubx, blue) and string (stg, black) from the right arm of chromosome 3 (3R). Left, the observed nuclear positions plotted onto an average nucleus, 12.5 μm in length. Right, the cytological positions of the genes on a metaphase chromosome arm drawn to scale (based on [15]). Middle, a histogram drawn from the distribution of the nascent transcript foci that lie within 0.5 μm intervals. The average position is indicated by an open circle and the error bar represents the standard deviation.
We found that the position of each transcribed gene was restricted to a particular plane along the apical–basal nuclear axis as predicted by the cytological position of the gene and the apical–basal, Rabl conformation of chromosomes. Genes near the centromeres were located in the apical hemisphere and those near the telomeres localized towards the basal pole of the nucleus. Genes in other parts of the chromosomes lay in intermediate positions in the apical–basal axis (Figure 1c and Supplementary material). All of the genes we studied occupied distinct locations, including fushi tarazu (ftz) and hunchback (hb), which are separated by only 10 centimorgans (one-tenth of a chromosome arm) and have overlapping but distinguishable nuclear distributions (Figure 1c). Our results also show conclusively that the intranuclear position of transcribed genes is not related to the cytoplasmic distribution of the mRNA. These results complement and extend previous findings [7].
Within their constrained apical–basal position, transcribed genes do not adopt a consistent radial position
We also investigated whether nascent transcript foci are consistently positioned with respect to nuclear axes perpendicular to the apical–basal axis. Nascent transcript foci from 11 endogenous genes were examined within a cross section through many nuclei (Figure 2b–m). For each of these genes, we imaged 23–103 nascent transcript foci distributed among two to three embryos of similar age and plotted their positions onto a profile of a typical nucleus. In all but one case, we detected no restriction of the foci to particular radial positions nor any consistent preference or exclusion from the nuclear envelope (Figure 2b–m). The genes studied included ftz (Figure 2f), of which the intranuclear position is in agreement with previous studies of a large genomic region containing ftz [6]. In contrast, paired (prd) nascent transcript foci were found to localize mostly nearer the periphery (Figure 2e), in agreement with studies of a genomic region containing the prd gene, which is located near nuclear envelope attachment sites [6]. In conclusion, the intranuclear distribution of genes, within sub-regions of the embryo where they are expressed, simply follows the expected average position of their chromosomal sites over the entire embryo.
Figure 2.
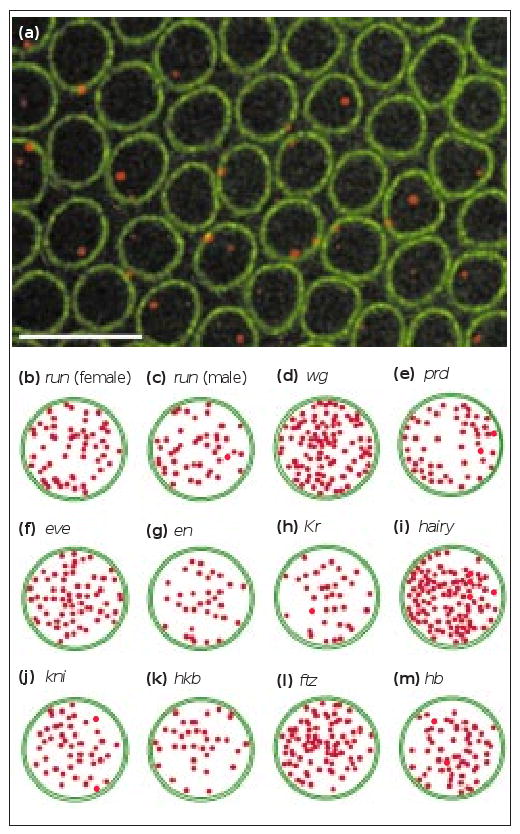
The position of transcribed genes in the plane perpendicular to the apical–basal axis of the nucleus. (a) Optical section through the layer of nuclei at the surface of the embryo, showing hairy (h) nascent transcript foci (red). AlexaWGA marks the nuclear envelope in green. The scale bar represents 10 μm. (b–m) Distribution of the nascent transcript foci of 11 genes plotted within average nuclear outlines. The distance to the nuclear envelope on the diagram is the same as the actual measured distance. Of the 11 genes, 10 had nascent transcript foci that could localize to any part of the nucleoplasm; prd showed some preference for the nuclear envelope, in accordance with the proximity of the gene to nuclear envelope attachment sites. No difference was observed between (b) female and (c) male embryos expressing runt (run), despite the different number of copies of the gene in the two sexes. Other gene abbreviations are: en, engrailed; eve, even-skipped; hkb, huckebein; kni, knirps; Kr, Krüppel; wg, wingless.
The intranuclear location of transcribed genes is independent of their level of expression
The perinuclear localization of chromatin helps to establish transcriptional silencing of some genes [8], and entire chromosomes can vary in their proximity to the nuclear periphery [9]. We tested whether the level of transcriptional activity of individual genes, in Drosophila, is related in any way to their proximity to the nuclear periphery. We first determined whether the intensity of fluorescence of a nascent transcript focus is a measure of the transcriptional activity of the gene. We measured the intensity of run nascent transcript foci in different parts of an embryo known to express run at different levels [10] (Figure 3a–c). Our results show that the intensity of the fluorescent signal is related to the level of expression of a gene (see Supplementary material). We then plotted, for a single embryo, the intensity of individual run nascent transcript foci against their distance from the nuclear periphery. Such plots were generated for a number of different transcribed genes and were reproducible from one embryo to another. In all cases that we studied, including different domains of run expression, a visual inspection of the plots showed that the intensity of nascent transcript foci was independent of their distance from the nuclear periphery (Figure 3d and Supplementary material). In all cases, linear regression analysis showed that the slope of the best-fit line was not significantly different from 0 (data not shown), confirming that the amount of nascent mRNA and the distance from the nuclear periphery were independent.
Figure 3.
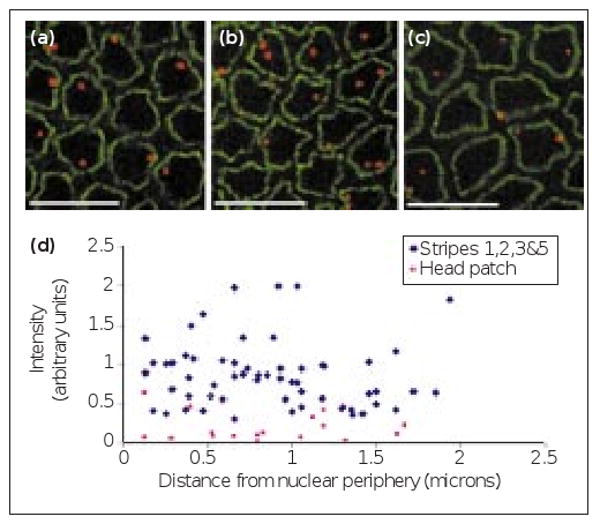
The intranuclear position and intensity of nascent transcript foci in different run expression domains. Representative optical sections through blastoderm nuclei used to quantify the relative fluorescence of nascent transcript foci in different run expression domains (red). AlexaWGA marks the nuclear envelope (green). The scale bars represent 10 μm. (a–c) The nascent transcript foci from stripe 1 of run, an X-linked gene, in (a) a male embryo, (b) a female embryo and (c) in the weakly expressed head patch of the embryo shown in (b). Each nucleus in (a) has only a single nascent transcript focus, but in (b) many nuclei contain a pair of nascent transcript foci, although some nuclei have a single nascent transcript focus due to pairing of homologous chromosomes. (d) A plot of the relative fluorescence intensity and distance from the nuclear periphery of individual run nascent transcript foci from different expression domains in a single embryo. The intensity and distance are unrelated whether in strongly expressing stripes (blue diamonds) or in the weaker head patch (pink squares).
The intranuclear position of genes is not affected by abnormally abundant nascent mRNA
To test whether very large genes with abundant nascent mRNA are localized differently from the 11 shorter genes described above, we investigated the intranuclear distribution of Ubx, a 77 kb gene requiring 55 minutes to be transcribed completely [11]. Ubx nascent transcript foci were not specifically localized with respect to the nuclear periphery (Figure 4b), in agreement with studies that used DNA probes to the region surrounding Ubx [12].
Figure 4.
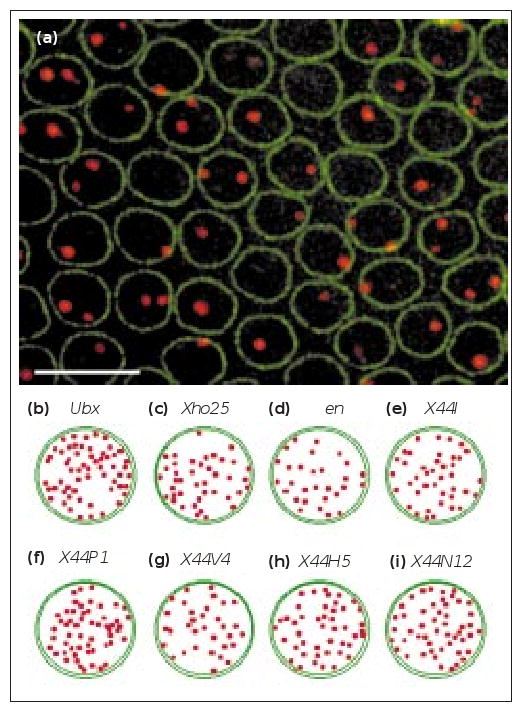
The intranuclear distribution of unusually abundant nascent transcript foci. (a) Nascent transcript foci (red) of the X44 transgene, which lacks a polyadenylation signal (see Supplementary material). AlexaWGA marks the nuclear envelope (green). The scale bar represents 10 μm. (b–i) The intranuclear distribution of genes containing large nascent transcript foci viewed within a plane perpendicular to the apical–basal axis of the nucleus, showing no restrictions on their intranuclear position. (b) Ubx. (c,d) Xho25 embryos stained with (c) a lacZ probe and (d) an en probe. (e–i) X44 embryos from five of the strongest expressing transgenic lines stained with probes against the untranslated sequences in the construct.
To further test whether a large increase in the amount of nascent mRNA could influence the intranuclear position of a gene, we used transgenic flies expressing constructs lacking a polyadenylation signal. In these constructs, transcription continues past the end of the gene and into flanking sequences, increasing the number of nascent transcripts decorating the DNA. We first examined the nascent transcripts of Xho25, a lacZ fusion inserted in the en locus and lacking a polyadenylation signal ([13]; see Supplementary material). We found that lacZ and en genes have a similar distribution with respect to the nuclear envelope (Figure 4c,d), showing that increasing the number of nascent transcripts decorating the DNA does not alter its intranuclear localization. To test other cytological locations, in addition to en, we constructed X44, a fusion construct that lacks a polyadenylation signal. Transcription of X44 is driven by the hb promoter and it contains 44 copies of a non-coding neutral sequence without a polyadenylation signal (see Supplementary material), leading to unusually bright nascent transcript foci (Figure 4a). The intranuclear distribution of nascent transcripts from the five most highly expressed lines showed no specific localization in cross sections of nuclei (Figure 4a,e–i). As in the case of smaller genes, the intensity of X44 foci was unrelated to their distance from the nuclear periphery (see Supplementary material).
In summary, our results show that transcribed genes are distributed within the nucleus according to the known Rabl configuration of chromosomes and proximity of certain chromosomal sites to the nuclear periphery. We found that different transcribed genes have distinct intranuclear distributions and their level of transcription is independent of their distance to the nuclear envelope. We interpret these results to mean that activation of transcription does not cause a major change in the intranuclear location of genes. If activated genes do move to new positions, then the distance moved must be small, and the sites to which they move must be numerous and evenly distributed. At least in Drosophila blastoderm nuclei, the distribution of actively transcribed genes is consistent with the possibility that transcriptional components are recruited to the site of the activated gene. These conclusions are likely to be general. Fundamental mechanisms such as recruitment of transcriptional components to genes and intranuclear transport of mRNA are unlikely to have evolved for a unique specialized role in the early Drosophila embryo. Indeed, there is evidence for a similar nuclear organization, and intranuclear transport of RNA in other systems [4].
Supplementary Material
Figure S1: The polarized cytology of the Drosophila interphase 14, blastoderm embryo. The elongated nuclei are arranged along the periphery of the embryo, dividing the cortical cytoplasm into apical and basal compartments. Cell membrane furrows move down between the nuclei to cellularize the embryo. The polarized nuclei contain an apical nucleolus (n) and Rabl-oriented chromosomes with apical centromeres (c) and basal telomeres (t). The red circle represents a transcribed gene. A pair of centrosomes in the apical cytoplasm nucleates a basket of microtubules, which form an apical cap around the nucleus with a few microtubules trailing down into the yolk.
Figure S2: The apical–basal distribution of transcribed genes on the X chromosome and left arm of chromosome 2. Map of the intranuclear positions of six transcribed genes from two different chromosome arms. The observed nuclear positions are plotted onto an average nucleus, 12.5 μm in length (see Supplementary materials and methods). The cytological positions of the genes on metaphase chromosome arms are drawn to scale on the right of each panel (based on [S28]). In the center of each panel, a histogram is drawn from the distribution of the nascent transcript foci that lie within 0.5 μm intervals along the apical–basal axis of the nucleus. The average position is indicated by an open circle and the standard deviation by an error bar in each case. (a) The intranuclear position of two transcribed X-linked genes, run and giant (gt). The gt gene (red) is located relatively near the telomere of the X chromosome and is transcribed in the basal region of the nucleus whereas run (green) is located near the middle of the chromosome and is transcribed in the middle of the nucleus. Tandemly repeated rDNA genes (blue) are located in a more apical position in accordance with their more proximal cytological position. (b) The positions of three transcribed genes from chromosome arm 2R. Kr (blue) is located very near the telomere, and is transcribed in the basal region of the nucleus. In contrast, en (red) and eve (green) are situated nearer the middle of the chromosome arm and are transcribed in more apical regions of the nucleus in correspondence with their order on the chromosome.
Figure S3: The relationship between intensity of nascent transcript foci and their distance to the nuclear periphery for (a) wg, (b) prd, (c) hairy, (d) ftz and (e–g) three independent insertions of X44. Plots of the relative integrated nascent transcript intensity (in arbitrary units measured by the CCD camera) against their distance from the nuclear periphery. Each plot contains data collected from a single representative embryo. A visual inspection of the plots indicates that, in all cases, the intensity of the nascent transcripts and their distance from the nuclear periphery are not related. Regression analysis confirms this in all cases as the slopes of the regression curves are not significantly different from 0 (data not shown).
Figure S4: Maps of constructs lacking polyadenylation signals leading to very large nascent transcript foci. (a) Map of the Xho25 (en–lacZ) transgene inserted 250 bp upstream of the transcription start site of the en gene, transcribed in the opposite direction and lacking polyadenylation and transcription termination sequences; and containing the rosy (ry) eye colour gene. The diagram is not drawn to scale and is based on [S22]. (b) Map of X44, a construct containing three bicoid-binding sites from a 0.75 kb fragment of the hb promoter region driving the expression of 44 tandem non-coding repeats and lacking polyadenylation and transcription termination sequences. The transgene was constructed in the pCaSpeR4 P-element transformation vector.
Table S1: Intensity of fluorescence of nascent transcript foci in different expression domains of run and in paired or unpaired loci.
Table S2: Intensity of fluorescence of nascent transcript foci at the periphery and in the interior of the nucleus.
Acknowledgments
We thank David Ish-Horowicz, David Tollervey, Joe Lewis, Adrian Bird and Hildegard Tekotte for their useful comments on the manuscript, and Jeff Bond for help with statistical analysis of the data. The work was supported by a Wellcome Trust career development fellowship to I.D., an MRC studentship to G.S.W. and NSF and NIH grants to P.H.O.
Footnotes
Supplementary material: Supplementary material including additional methodological details and results is available at http://current-biology.com/supmat/supmatin.htm.
References
- 1.Brown KE, Guest SS, Smale ST, Hanm K, Merkenschlager M, Fisher AG, et al. Association of transcriptionally silent genes with Ikaros complexes at centromeric heterochromatin. Cell. 1997;91:845–854. doi: 10.1016/s0092-8674(00)80472-9. [DOI] [PubMed] [Google Scholar]
- 2.Brown KE, Baxter J, Graf D, Merkenschlager M, Fisher AG. Dynamic repositioning of genes in the nucleus of lymphocytes preparing for cell division. Mol Cell. 1999;3:207–217. doi: 10.1016/s1097-2765(00)80311-1. [DOI] [PubMed] [Google Scholar]
- 3.Singer RH, Green MR. Compartmentalization of eukaryotic gene expression: causes and effects. Cell. 1997;91:291–294. doi: 10.1016/s0092-8674(00)80411-0. [DOI] [PubMed] [Google Scholar]
- 4.Marshall WF, Sedat JW. Nuclear architecture. In: Ohlsson R, editor. Genomic Imprinting, An Interdisciplinary Approach. Berlin: Springer-Verlag; 1999. pp. 283–301. [Google Scholar]
- 5.Wilkie GS, Davis I. High resolution and sensitive mRNA in situ hybridisation using fluorescent tyramide signal amplification. Technical Tips Online. 1998 t01458 ( http://www.biomednet.com/db/tto)
- 6.Marshall WF, Dernburg AF, Harmon B, Agard DA, Sedat JW. Specific interactions of chromatin with the nuclear envelope: positional determination within the nucleus in Drosophila melanogaster. Mol Biol Cell. 1996;7:825–842. doi: 10.1091/mbc.7.5.825. [DOI] [PMC free article] [PubMed] [Google Scholar]
- 7.Davis I, Francis-Lang H, Ish-Horowicz D. Mechanisms of intracellular transcript localization and export in early Drosophila embryos. Cold Spring Harbor Symp Quant Biol. 1993;58:793–798. doi: 10.1101/sqb.1993.058.01.086. [DOI] [PubMed] [Google Scholar]
- 8.Andrulis ED, Neiman AM, Zappulla DC, Sternglanz R. Perinuclear localization of chromatin facilitates transcriptional silencing. Nature. 1998;394:592–595. doi: 10.1038/29100. [DOI] [PubMed] [Google Scholar]
- 9.Croft JA, Bridger JM, Boyles S, Perry P, Teague P, Bickmore WA. Differences in the localization and morphology of chromosomes in the human nucleus. J Cell Biol. 1999;145:1119–1131. doi: 10.1083/jcb.145.6.1119. [DOI] [PMC free article] [PubMed] [Google Scholar]
- 10.Klingler M, Soong J, Butler B, Gergen JP. Disperse versus compact elements for the regulation of runt stripes in Drosophila. Dev Biol. 1996;177:73–84. doi: 10.1006/dbio.1996.0146. [DOI] [PubMed] [Google Scholar]
- 11.Shermoen AW, O'Farrell PH. Progression of the cell-cycle through mitosis leads to abortion of nascent transcripts. Cell. 1991;67:303–310. doi: 10.1016/0092-8674(91)90182-x. [DOI] [PMC free article] [PubMed] [Google Scholar]
- 12.Gemkow M, Verveer P, Arndt-Jovin D. Homologous association of the bithorax-complex during embryogenesis: consequences for transvection in Drosophila melanogaster. Development. 1998;125:4541–4552. doi: 10.1242/dev.125.22.4541. [DOI] [PubMed] [Google Scholar]
- 13.Hama C, Ali Z, Kornberg TB. Region-specific recombination and expression are directed by portions of the Drosophila engrailed promoter. Genes Dev. 1990;4:1079–1093. doi: 10.1101/gad.4.7.1079. [DOI] [PubMed] [Google Scholar]
- 14.Davis I, Ish-Horowicz D. Apical localization of pair-rule transcripts requires 3′ sequences and limits protein diffusion In the Drosophila blastoderm embryo. Cell. 1991;67:927–940. doi: 10.1016/0092-8674(91)90366-7. [DOI] [PubMed] [Google Scholar]
- 15.Dernburg AF, Sedat JW. Mapping three-dimensional chromosome architecture in situ. Meth Cell Biol. 1998;53:187. doi: 10.1016/s0091-679x(08)60880-8. [DOI] [PubMed] [Google Scholar]
Associated Data
This section collects any data citations, data availability statements, or supplementary materials included in this article.
Supplementary Materials
Figure S1: The polarized cytology of the Drosophila interphase 14, blastoderm embryo. The elongated nuclei are arranged along the periphery of the embryo, dividing the cortical cytoplasm into apical and basal compartments. Cell membrane furrows move down between the nuclei to cellularize the embryo. The polarized nuclei contain an apical nucleolus (n) and Rabl-oriented chromosomes with apical centromeres (c) and basal telomeres (t). The red circle represents a transcribed gene. A pair of centrosomes in the apical cytoplasm nucleates a basket of microtubules, which form an apical cap around the nucleus with a few microtubules trailing down into the yolk.
Figure S2: The apical–basal distribution of transcribed genes on the X chromosome and left arm of chromosome 2. Map of the intranuclear positions of six transcribed genes from two different chromosome arms. The observed nuclear positions are plotted onto an average nucleus, 12.5 μm in length (see Supplementary materials and methods). The cytological positions of the genes on metaphase chromosome arms are drawn to scale on the right of each panel (based on [S28]). In the center of each panel, a histogram is drawn from the distribution of the nascent transcript foci that lie within 0.5 μm intervals along the apical–basal axis of the nucleus. The average position is indicated by an open circle and the standard deviation by an error bar in each case. (a) The intranuclear position of two transcribed X-linked genes, run and giant (gt). The gt gene (red) is located relatively near the telomere of the X chromosome and is transcribed in the basal region of the nucleus whereas run (green) is located near the middle of the chromosome and is transcribed in the middle of the nucleus. Tandemly repeated rDNA genes (blue) are located in a more apical position in accordance with their more proximal cytological position. (b) The positions of three transcribed genes from chromosome arm 2R. Kr (blue) is located very near the telomere, and is transcribed in the basal region of the nucleus. In contrast, en (red) and eve (green) are situated nearer the middle of the chromosome arm and are transcribed in more apical regions of the nucleus in correspondence with their order on the chromosome.
Figure S3: The relationship between intensity of nascent transcript foci and their distance to the nuclear periphery for (a) wg, (b) prd, (c) hairy, (d) ftz and (e–g) three independent insertions of X44. Plots of the relative integrated nascent transcript intensity (in arbitrary units measured by the CCD camera) against their distance from the nuclear periphery. Each plot contains data collected from a single representative embryo. A visual inspection of the plots indicates that, in all cases, the intensity of the nascent transcripts and their distance from the nuclear periphery are not related. Regression analysis confirms this in all cases as the slopes of the regression curves are not significantly different from 0 (data not shown).
Figure S4: Maps of constructs lacking polyadenylation signals leading to very large nascent transcript foci. (a) Map of the Xho25 (en–lacZ) transgene inserted 250 bp upstream of the transcription start site of the en gene, transcribed in the opposite direction and lacking polyadenylation and transcription termination sequences; and containing the rosy (ry) eye colour gene. The diagram is not drawn to scale and is based on [S22]. (b) Map of X44, a construct containing three bicoid-binding sites from a 0.75 kb fragment of the hb promoter region driving the expression of 44 tandem non-coding repeats and lacking polyadenylation and transcription termination sequences. The transgene was constructed in the pCaSpeR4 P-element transformation vector.
Table S1: Intensity of fluorescence of nascent transcript foci in different expression domains of run and in paired or unpaired loci.
Table S2: Intensity of fluorescence of nascent transcript foci at the periphery and in the interior of the nucleus.