

Abstract
PURPOSE:
To characterize a tumor model containing a hypoxia-inducible reporter gene and to demonstrate utility by comparison of reporter gene expression to the uptake and distribution of the hypoxia tracer 18F-fluoromisonidazole (18F-FMISO).
METHODS:
I. Three tumors derived from the rat prostate cancer cell line R3327-AT were grown in each of two rats as follows: 1. parental R3327-AT, 2. positive control R3327-AT/PC in which the HSV1-tkeGFP fusion reporter gene was expressed constitutively, 3. R3327-AT/HRE in which the reporter gene was placed under the control of a HIF-responsive promoter sequence (HRE). Animals were co-administered a hypoxia-specific marker (pimonidazole) and the reporter gene probe 124I-2′-fluoro-2′-deoxy-1-ß-d-arabinofuranosyl-5-iodouracil (124I-FIAU) 3hr prior to sacrifice. Statistical analysis of the spatial association between 124I-FIAU uptake and pimonidazole fluorescent staining intensity was then performed on a pixel-by-pixel basis.
II. Utility of this system was demonstrated by assessment of reporter gene expression versus the exogenous hypoxia probe 18F-FMISO. Two rats, each bearing a single R3327-AT/HRE tumor, were injected with 124I-FIAU (3hr before sacrifice) and 18F-FMISO (2hr before sacrifice). Statistical analysis of the spatial association between 18F-FMISO and 124I-FIAU on a pixel-by-pixel basis was performed.
RESULTS:
I. Correlation coefficients between 124I-FIAU uptake and pimonidazole staining intensity were: 0.11 in R3327-AT tumors, −0.66 in R3327-AT/PC and 0.76 in R3327-AT/HRE, confirming that only in the R3327-AT/HRE tumor was HSV1-tkeGFP gene expression associated with hypoxia.
II. Correlation coefficients between 18F-FMISO and 124I-FIAU uptakes in R3327-AT/HRE tumors were r= 0.56, demonstrating good spatial correspondence between the two tracers.
CONCLUSIONS:
We have confirmed hypoxia-specific expression of the HSV1-tkeGFP fusion gene in the R3327-AT/HRE tumor model and demonstrated the utility of this model for the evaluation of radiolabeled hypoxia tracers.
Keywords: Hypoxia, cancer, reporter gene, nuclear medicine, PET tracer validation
1. Introduction
Tumor hypoxia has been identified as a major adverse prognostic factor for disease progression and for resistance to anti-cancer therapies. Whilst various approaches have been evaluated to assess tumor hypoxia in vivo, positron emission tomography (PET) imaging in particular has emerged as a promising non-invasive tool to accurately characterize tumor oxygenation. Many of the promising tracer compounds used in PET imaging of hypoxia are based upon a 2-nitroimidazole structure. The hypoxia selectivity of these compounds is based upon their ability to undergo reduction within hypoxic cells, with subsequent retention of reduced nitro-radical species following nucleic acid- and protein-adduct formation [1]. Currently, of the various 2-nitroimidazole compounds investigated as PET hypoxia tracers, 18F-fluromisonidazole (18F-FMISO) is the most extensively studied [2-4].
At the cellular level, low pO2 triggers an adaptive transcriptional response resulting in an alteration of the expression of an extensive number of genes, including those involved in glucose metabolism, apoptosis, angiogenesis and metastasis [5]. Central to these cellular responses is the oxygen-dependent transcriptional activity of hypoxia-inducible factor 1 (HIF-1). The HIF-1 transcription factor is a heterodimer consisting of a constitutively-expressed β-subunit, and an oxygen-regulated α-subunit (HIF-1α). In the presence of molecular oxygen, HIF-1α is rapidly degraded via oxygen-dependent proline hydroxylation and subsequent binding of the Von Hippel-Landau (VHL) protein, and is ultimately targeted for proteosomic degradation. Under hypoxic conditions, the proline hydroxylation and subsequent degradation of HIF-1α is inhibited, thus elevating the cellular level of active HIF-1. HIF-1 mediates transcriptional regulation via pentanucleotide (5′-RCGTG-3′) hypoxia response elements (HRE) on the upstream promoter region of HIF-responsive genes.
We have previously described observations using an artificial HIF1-dependent reporter gene construct consisting of the herpes simplex virus1-thymidine kinase protein (HSV1-tk) fused with the enhanced green fluorescent protein (eGFP) under the regulation of 8 contiguous pentameric HRE consensus sequences [6]. Using non-invasive PET imaging, we demonstrated retention of the radioactive reporter substrate 124I-5-iodo-2′-fluoro-2′deoxy-1-beta-d-arabinofuranosyl-uracil (124I-FIAU), and compared the images with those obtained later in the same subject animal using 18F-FMISO. However, it was not possible to confirm at that time that the pattern of 124I-FIAU localization reflects locoregional distribution of tumor hypoxia. Therefore, these already reported initial observations made at the global level must be also be validated at the microregional and cellular level if correct interpretations are to be made. The aims of this study were to demonstrate the hypoxia-dependence of HRE-driven reporter gene expression using a combination of histochemical and radiolabeled exogenous hypoxia tracers.
2. Methods and Materials
2.1. Cell Culture
The R3327-AT anaplastic rat prostate adenocarcinoma model was used for these studies. The retrovirally transduced sub-clones R3327/HRE-Cl2 and R3327/PC were also used. R3327/HRE-Cl2 contains the HSV1-tkeGFP fusion reporter gene construct under control of an artificial HRE (eight tandem repeats of the hypoxia response element from the 3′ enhancer region of the human Epo gene linked to a TATA box). R3327/PC contains the same reporter gene construct constitutively driven by the retroviral long terminal repeat (LTR). The production and characterization of the retroviral reporter vectors, and the transduced cell lines R3327/HRE-Cl2 and R3327/PC have been described previously [6-8]. All cell lines were maintained in Dulbecco's MEM supplemented with 10% FBS and penicillin/streptomycin at 37°C in a 5% CO2 atmosphere.
2.2. Radioisotope production and radiochemical synthesis
18F and 124I were produced on the MSKCC cyclotron (TR19/9, EBCO Technologies, Inc., Vancouver, Canada) using techniques described previously [7-9]. 18F-FMISO was prepared using a modified method of that reported by Yang [10]. Iodine-124 labeled 124I-FIAU was synthesized as previously described [11-13] using unlabeled precursors purchased from ABX (ABX GmbH, Radeberg, Germany).
2.3. Animal Studies
All animal studies presented here were performed in accordance to the regulations of the Institutional Animal Care and Use Committee (IACUC) and Research Animal Resource Center (RARC) of MSKCC .For the first study, four nude rats were inoculated with three tumors each. The following sites were used for tumor implantations: 1. Parental R3327-AT tumor were grown in the right hind limb. 2. Positive control tumors R3327-AT/PC were grown in the right shoulder. 3. R3327-AT/HRE tumors with the HSV1-tkeGFP gene controlled by the hypoxia response element were grown in the left hind limb. In attempt to equalize the sizes of tumors at the time of the experiment, parental R3327-AT tumors were initiated with 2×10⁶ cells in 20μl injected subcutaneously, while for the HRE and positive control tumors were initiated with 3×10⁶ cells in 20μl injected subcutaneously. 11 to 14 days post inoculation all the tumors reached 20-25 mm in diameter. To minimize the effects of the tumor size on the result of the experiment, and to assure comparability of the different types of the tumors, two animals which had all three tumors of a similar size were selected for the study. Each of the two animals received the following injections: At 3 hours prior to sacrifice, animals were administered (i.v.) 0.5mCi of 124I-FIAU plus 80mg/kg of body mass of pimonidazole hydrochloride (Chemicon, Temecula, CA) in 0.5ml of sterile saline. At 5 minutes prior to sacrifice, animals were injected with 15mg/kg of body mass of Hoechst 33342 (Sigma-Aldrich, St.Louis, MO) in 0.5 ml of sterile saline. Following sacrifice, the tumors were immediately dissected, snap-frozen in isopentane at −70°C, embedded in OCT and sectioned on a Microm HM500 cryostat microtome (Microm International GmbH, Walldorf, Germany). From each tumor a set of sequential 8μm thick sections representative of the central part of the tumor was collected. To acquire the distribution of 124I-FIAU, one section from each set was placed onto an imaging phosphor plate for autoradiography. 24 hours later, the images were read out in a 50μm pixel size mode using Fujifilm BAS-1800 II (Fuji Photo Film Co. Ltd., Tokyo, Japan) phosphor plate reader.
For the second study, two rats were implanted with one R3327-AT/HRE tumor each by means of subcutaneous injection of 3×10⁶ cells in 20μl of sterile saline. When the tumors had reached a size of 20-25 mm in diameter, the animals received i.v. injection of: (i) 0.5mCi of 124I-FIAU plus 80mg/kg of body mass of pimonidazole hydrochloride at 3 hours prior to sacrifice (ii) 1.75mCi (average) 18F-FMISO at 2 hours prior to sacrifice and (iii) 15mg/kg of body mass of Hoechst 33342 at 5 minutes prior to sacrifice, all injections given in 0.5 ml of sterile saline. Tumors were resected, measured, and weighted. Tumor 124I-FIAU activity was obtained using well counter. Thereafter, tumor tissue was frozen, embedded in OCT and then sectioned on a Microm HM500 cryostat microtome (Microm International GmbH, Walldorf, Germany) at 8 micron thickness. A set of sequential 8μm thick sections representative of the central part of each tumor was collected. One section from each set was used for dual-label autoradiography, as described below.
2.4. Dual-label autoradiography
To acquire the microdistributions of 124I-FIAU and 18F-FMISO, the method of dual exposure autoradiography was employed. With this technique, the same specimen is used for two separate exposures. The first exposure was performed at the earliest possible time after tumor sectioning. In this study, the duration of this first exposure was 5 hours. This image resulting from this exposure consists of a composite of the autoradiographic signal from both 124I-FIAU and 18F-FMISO radiotracers. The second exposure was initiated 36 hr later (about 20 half-lives for 18F) and therefore following complete decay of 18F. Therefore, the second exposure consists of the autoradiographic signal from longer-lived isotope (half-life = 4.2 days) 124I-FIAU only. The duration of this second exposure was 36 hours, to allow sufficient signal accrual from the lower activity 124I source.
It is possible to obtain an image of the 18F-FMISO distribution by performing image subtraction of the known contribution of 124I-FIAU. However, in order to correctly subtract the contribution of 124I-FIAU from the first exposure to reveal the 18F-FMISO distribution, it is necessary to appropriately account not only for combined effect of the isotope decay and the differing exposure durations, but also for the differences in image plate signal fade associated with those exposure durations. To account for these composite effects a series of 124I autoradiographic standards were created by dissolving a known activity of 124I per gram of OCT, and sectioning at the same thickness as the tumor tissue sections. These sections were exposed for the same dual exposure durations as those in the study. The ratios of counts between the 124I standards from the two exposures provided the normalization factors needed to perform the subtraction of the second image dataset from the first properly and to obtain a quantitatively-correct autoradiographic image of the 18F-FMISO microdistribution.
2.5. Fluorescence immunohistochemical staining
To obtain the images of vascular perfusion (Hoechst 33342) and locoregional hypoxia (pimonidazole uptake), sections adjacent to those used for autoradiography were fixed in cold acetone (10 minutes at −20°C), then incubated for 1hr at room temperature with primary mouse anti-pimonidazole antibody (Chemicon, Temecula, CA) diluted 1:10 in SuperBlock solution (Pierce Biotechnology, Inc., Rockford, IL) followed by secondary detection using goat anti-mouse-Alexa 488 g/ml in SuperBlock) (Molecular Probes, Eugene, OR). The immunohistochemically stained tumor sections were acquired at high magnification (X100) using an Olympus BX40 fluorescence microscope (Olympus America Inc., Melville, NY) equipped with a motorized stage (Prior Scientific Instruments Ltd., Cambridge, UK) and ImagePro software (Media Cybernetics Inc, Bethesda, MD) allowing the individual captured image frames to be rendered into a montage of the entire tumor section. In addition, hematoxylin and eosin (H&E) staining was performed to visualize tumor morphology. A set of representative images obtained by this method is shown in Figure 1.
Figure 1.
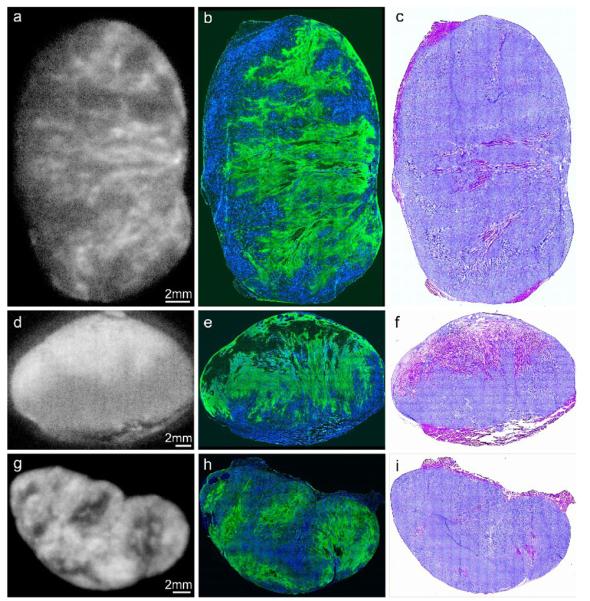
124I-FIAU autoradiograms (a,d,g), composite images (b,e,h) showing Hoechst 33342 (blood flow) in blue, pimonidazole stain (hypoxia) in green, and hematoxylin-eosin images (c,f,i), for each of the three tumor models. The top row (a,b,c) were obtained from an R3327-HRE tumor, the middle row. (d,e,f) from a parental control tumor and the bottom row (g,h,i) from a R3327-PC tumor with constitutive HSV1-TK expression. The brightness of each 124I-FIAU autoradiogram image (panels a,d,g) was adjusted individually for better visualization of intratumoral variations of 124I-FIAU uptake. Therefore, these images cannot be used to compare absolute levels of 124I-FIAU uptake.
2.6. Data Analysis
Digital fluorescence and autoradiography images were co-registered and processed as previously described [14]. This data provided the basis for a pixel-by-pixel map of two variables throughout an entire tumor section. For the purpose of data correlation, the intensities (or counts) of the pixels belonging within the tumor section were organized into a 2-column matrix where the number of rows corresponds to the total number of pixels in the region of interest. In this way, column one contains the relative intensities of 124I-FIAU autoradiograph and the corresponding co-registered pixel intensities of pimonidazole IHC staining are located in column two. These matrices can be large e.g. for a 256 × 256 pixel area the number of rows (equal to the total number of pixels) would be 65536. When such data are plotted in a 2-dimensional scatterplot the result is a dense cloud of points with a significant degree of overlap, making its interpretation often difficult. In order to simplify the display of the results for such large datasets, we have re-binned the data according to with the following algorithm: For all possible 2-way correlations one variable was designated as independent and the other as dependent. Data were then sorted in ascending order of the independent variable while maintaining the association between independent and dependent values. The data set was then split into deciles, each containing the same number of data points, i.e. the 10% of the data points lowest in terms of the independent variable, then the next lowest 10%, etc. The mean, standard deviation and 95% confidence limits on the mean were then calculated for each decile for both independent and dependent variables. Examples of a complete and subsequently re-binned dataset are shown in Figure 2. In this particular example the standard deviations plotted in the figure are in some instances as small as the magnitude of the dots representing rebinned data, and for this reason cannot be visualized in Figure 2b and some of the plots in Figure 3. This rebinning procedure enables better visualization of the association between variables, whilst significantly reducing the visual impact of statistical noise in the scattergram plots. However, all correlation coefficients between different markers were calculated using the original raw pixel data, and not using the rebinned data. Because of the very high number of individual data points, all the correlations reported here are statistically significant with corresponding p-numbers of 0.001 or less.
Figure 2.

Example of data generated from the pixel-by-pixel analysis. Panel (a) shows the complete dataset obtained by correlation of images of 124I-FIAU (Figure 1a) and pimonidazole (Figure 1b green). Panel (b) shows the same dataset re-binned according to the algorithm described above. The rebinning procedure enables to reduce the visual impact of statistical noise in the scatter plots and better visualize the association between variables.
Figure 3.

Scatterplots showing variation of 124I-FIAU, pimonidazole and Hoechst 33342 uptake in each of 3 tumor models with HSV1-tk reporter gene expression either absent (parental), constitutively expressed (positive) or HIF1-regulated (HRE). The error bars represents one standard deviation of the mean. Some error bars are small and therefore not visible beyond the symbol in these plots.
In order to quantify the degree of mismatch between 18F-FMISO and 124I-FIAU we have utilized a methodology described by Li et al [15]. In short, this procedure requires the use of thresholds to categorize pixels in both 18F-FMISO and 124I-FIAU images as either positive or negative. Threshold values were defined as a percentage of the maximum tracer uptake. Depending on the uptake of the tracers and the threshold used, pixels can be classified either as a match (i.e., +/+ or −/−) or a mismatch (i.e., +/− or −/+). Finally, 18F-FMISO and 124I-FIAU thresholds were varied in tandem, i.e. keeping the numerical values of both thresholds the same, until the maximum mismatch was found. The detailed description of the procedure can be found in Li et al [15].
3. Results
In the first study, we evaluated the distribution of 124I-FIAU in tumors containing constitutive HSV1-tk expression (positive), hypoxia-inducible HSV1-tk expression (HRE) and parental tumors with no HSV1-tk expression (parental) using digital autoradiography (DAR). The size, weight and 124I-FIAU uptake for each of the tumors collected in the first study are listed in Table 1. Using fluorescence microscopy, each tumor was also evaluated for distribution of hypoxia with the exogenous hypoxia marker pimonidazole and perfusion with Hoechst 33342 fluorescent dye (Figure 1). In this figure, brightness of each 124I-FIAU autoradiogram image (panels a,d,g) was adjusted individually for better visualization of intratumoral variations of 124IFIAU uptake. In each tumor type, we observed a similar peri-necrotic pimonidazole distribution in regions of low perfusion, and low pimonidazole uptake in well-perfused regions, indicating the inverse relationship between tumor hypoxia and vascular perfusion. However, the pattern of 124I-FIAU distribution greatly depended on the tumor type. Tumors with hypoxia-inducible HSV1-tk expression showed a close visual colocalization of both pimonidazole and 124I-FIAU, indicating HSV1-tk expression in regions of tumor hypoxia (Figure 1a-c). In parental tumors lacking HSV1-tk expression, we observed a more uniform distribution and considerably lower overall 124I-FIAU uptake, with the highest regions of activity appearing to correspond to areas of tumor necrosis (Figure 1d-f). This distribution is likely to reflect differential clearance of the radiotracer from well- and poorly-perfused tumor regions. However, the low absolute uptake observed in the parental tumor model demonstrates that this differential between well- and poorly-perfused tumor regions makes only a minor contribution to the distribution of 124I-FIAU in the HSV1-tk-transfected models.
Table 1.
Tumor sizes and specific 124I-FIAU activities.
| Tumor Size (mm) |
Tumor Mass (g) |
124I-FIAU Acitivity (μCi) |
Specific Acitivity (μCi/g) |
|
|---|---|---|---|---|
| Rat 1 Parental | 19 × 22 × 12 | 4.4 | 4 | 0.91 |
| Rat 1 HRE | 17 × 20 × 12 | 2.9 | 4 | 1.38 |
| Rat 1 Positive | 18 × 23 × 14 | 3.9 | 12 | 3.08 |
| Rat 2 Parental | 18 × 24 × 15 | 5.1 | 2 | 0.39 |
| Rat 2 HRE | 18 × 23 × 14 | 4.5 | 3 | 0.67 |
| Rat 2 Positive | 14 × 23 × 12 | 2.9 | 8 | 2.76 |
In tumors with constitutive HSV1-tk expression, 124I-FIAU distribution appeared to localize preferentially in well-perfused tumor regions (Figure 1g-i) and less in areas of hypoxia/necrosis. As all tumors cells in this model possess a high capacity to entrap 124I-FIAU, this distribution reflects a higher rate of delivery of radiotracer to well-perfused tumor regions than to poorly-perfused regions. The lower uptake in hypoxic/necrotic regions reflects the requirement for intact viable cells for radiotracer entrapment, and also reflects the minor overall contribution of differential tracer clearance from these regions compared to HSV1-tk-mediated 124I-FIAU entrapment.
Pixel-by-pixel analysis of the co-registered fluorescence and DAR images yielded quantitative correlative scatter plots of each of the parameters measured. Due to the large density of data in the full scatterplots, data was re-binned as described in the methods section. An example of a full scatterplot and a plot resulting from re-binning is shown in figure 2. Scatterplots were generated for each pair of variables using the complete original dataset (Figure 3a), and correlation coefficients (r) were calculated. The r values obtained are shown in Table 2.
Table 2.
Correlation coefficients between 124I-FIAU uptake, Pimonidazole and Hoechst 33342 staining intensity calculated for three different R3327-AT tumor models with HSV1-tk reporter gene either absent (parental), constitutively expressed (positive) or HIF1-regulated (HRE).
| HRE | Parental | Positive | |
|---|---|---|---|
| Pimonidazole vs. Hoechst |
−0.82* | −0.50 | −0.71 |
|
124I-FIAU vs. Pimonidazole |
0.76* | 0.11* | −0.66* |
|
124I-FIAU vs. Hoechst |
−0.73* | −0.66 | 0.64* |
denotes scatterplot shown in Figure 3.
As expected, all tumors showed a negative correlation between pimonidazole staining intensity and Hoechst 33342 intensity (e.g. Figure 3a). Tumors with hypoxia-inducible HSV1-tk expression (HRE) showed a positive correlation between 124I-FIAU uptake and pimonidazole staining intensity, and a negative correlation between 124I-FIAU uptake and Hoechst 33342 staining intensity (Figure 3b and c), demonstrating preferential accumulation of 124I-FIAU in regions of tumor hypoxia. There was no clear association between 124I-FIAU uptake and pimonidazole staining intensity in the parental tumors lacking HSV1-tk expression (Figure 3d). In the tumors with constitutive HSV1-tk expression, 124I-FIAU uptake was negatively correlated with pimonidazole staining intensity (Figure 3e). At the same time, there was positive correlation between 124I-FIAU uptake and Hoechst 33342 staining intensity (Figure 3f).
Following the initial characterization of the HRE reporter construct model, we assessed the ability of this system to reflect locoregional tumor hypoxia in vivo. This evaluation was achieved through the correlative analysis between the relative distributions of 124I-FIAU and the exogenous hypoxia tracer 18F-FMISO, obtained through dual isotope digital autoradiography. Each tumor was also evaluated for the distribution of pimonidazole and Hoechst 33342 using fluorescence microscopy as described above. Figure 4 shows a representative example of the results obtained. As previously, we observed peri-necrotic pimonidazole distribution in regions of low vascular perfusion, with negligible pimonidazole staining in regions of high vascular perfusion (Figure 4a-c).
Figure 4.

Representative example of data obtained from a single R3327-HRE tumor following administration of 124I-FIAU, 18F-FMISO, pimonidazole and Hoechst 33342. Fluorescence images of pimonidazole (panel a) and Hoechst 33342 (panel b) were compared to DAR images of 18F-FMISO (panel d) and 124I-FIAU (panel e). Following fluorescence imaging, the tumor section was subsequently stained with haematoxylin/eosin (panel c). Panel (f) is a co-registered pseudo-colored image of the distribution of 18F-FMISO (shown in green) and 124I-FIAU (shown in red).
The distributions of 18F-FMISO (Figure 4d) and 124I-FIAU (Figure 4e) appear visually similar with several regions of focal uptake apparent in the tumor. Correlative pixel analysis, shown in Figure 5, corroborates these observations. Correlation coefficients between the uptakes radiotracers 124I-FIAU, 18F-FMISO and staining intensities of Pimonidazole, Hoechst are shown in Table 3. A negative correlation (r = −0.72) between the vascular perfusion marker Hoechst 33342 and 124I-FIAU was observed, implying that HRE-driven reporter gene expression increases as vascular perfusion decreases. Similar negative correlations were observed between Hoechst 33342 and both 18F-FMISO and pimonidazole, supporting our expectation that regions of low vascular perfusion are indeed hypoxic (Figure 5a,c,f). A positive correlation between 124I-FIAU uptake and the hypoxia tracers 18F-FMISO and pimonidazole (r = 0.56 and 0.54 respectively) was obtained. This data indicates that HRE-driven reporter gene expression can be used to visualize the gene activation downstream of hypoxia, and can be used directly to substantiate the distribution of the hypoxia targeting PET tracer 18F-FMISO. To facilitate the comparison of the finding presented here with those of Li et al[15], we have determined the degree of overlap between 18F-FMISO and 124I-FIAU. Using the original pixel values from the co-registered images shown in Figure 4d and 4e, we determined the degree of spatial mismatch between the two radiotracers. This analysis indicated that the maximum spatial mismatch between 18F-FMISO and 124I-FIAU positive pixels was 27% using a threshold of 65% of the maximum pixel value (Figure 6).
Figure 5.

Scatterplots showing variation of 124I-FIAU, 18F-FMISO, pimonidazole and Hoechst 33342 uptake in the R3327-HRE model, where HSV1-tk reporter gene expression is HIF1-regulated. Error bars are as described for Figure 3.
Table 3.
Correlation coefficients between the uptakes radiotracers 124I-FIAU, 18F-FMISO and staining intensities of Pimonidazole, Hoechst in tumors containing HIF1-regulated HSV1-tk reporter gene (HRE).
| Pimonidazole | Hoechst | 124I-FIAU | 18F-MISO | |
|---|---|---|---|---|
| Pimonidazole | 1.00 | −0.73* | 0.54* | 0.80* |
| Hoechst | −0.73* | 1.00 | −0.72* | −0.61* |
| 124I-FIAU | 0.54* | −0.72* | 1.00 | 0.56* |
| 18F-MISO | 0.80* | −0.61* | 0.56* | 1.00 |
denotes scatterplot shown in Figure 5.
Figure 6.

Analysis of the mismatch between 124I-FIAU and 18F-FMISO distribution. Pixel values obtained from DAR images of 18F-FMISO (Figure 4d) and 124I-FIAU (Figure 4e) were plotted (black points). The degree of mismatch (defined as points falling into the upper left and lower right quadrants) was assessed at all possible quadrant threshold values, and was found to be maximal when the threshold was set to 65% of the maximal value. The degree of mismatch using this threshold value was 29.6 %.
4. Discussion
The aims of this study were to characterize an artificial hypoxia-responsive reporter gene system in vivo, and to demonstrate the oxygen-sensitivity of this system by comparison with exogenous markers of tumor hypoxia. We have previously demonstrated in vitro the oxygen-dependent expression of a HSV1-tkeGFP fusion reporter gene when placed under the transcriptional control of an upstream promoter region containing 8 pentameric HRE sequences [6]. The expression of this reporter gene is assessed with the reporter substrate 124I-FIAU, which is phosphorylated by the HSV1-tk enzyme and retained in expressing cells [9]. This system therefore has the potential for non-invasive assessment of hypoxia-regulated gene expression using PET imaging techniques. However, in vivo validation of this system is required before definitive conclusions can be drawn from such studies, as there are many complicating factors which could affect uptake and distribution of 124I-FIAU. These include non-hypoxic regulation of HIF1α expression in vivo, the unpredictable effects of acute hypoxia and reoxygenation on the expression of reporter construct and the possibility of non-uniform delivery of reporter substrate due to heterogeneous tumor vascular perfusion.
In order to confirm that the uptake of the radiolabeled reporter gene probe reflects the tumor physiology, it is necessary to be able to visualize both the microenvironment and the distribution of the probe with the high enough resolution to allow for identification of the individual features of tumor microenvironment and then confirm that the uptake of the radiolabeled probe varies accordingly. As shown in multiple studies performed on both animal and human tumor specimens, the typical feature size for tumor microenvironmental pattern, e.g. the width of a hypoxia rim, can be 100 micron or smaller [16-18]. The resolution of PET imaging systems cannot provide fine enough image detail necessary for the type of analysis provided by the study described here. However, the combined use of phosphor plate autoradiography with fluorescent microscopy allows the appropriate higher resolution analysis to be performed allowing the specificity of the 124I-FIAU for hypoxia to be accurately addressed. The use of these two imaging modalities not only allows for obtaining of high resolution images, but also for precise co-registration of images acquired from the same or adjacent sections.
In this study, we chose to perform pixel-by pixel analysis of tumor sections from a relatively small number of sample animals. The study of tracer distribution at the tumor microregional level requires that measurements be made at the highest spatial resolution possible, and also in a manner that preserves important positional information. The large number of data points per section generated from this method over multiple micro-environmental regions within each tumor allows for a robust statistical analysis of tracer distribution, and precludes the need for a large number of tumors for the analysis.
We examined the locoregional tumor distribution of 124I-FIAU in tumor models containing constitutive (positive), hypoxia-inducible (HRE) or negative HSV1-tk expression (Figure 1). In the tumors with constitutive expression of HSV1-tk, 124I-FIAU uptake was observed predominantly in regions of well-perfused viable tissue, with relatively lower uptake observed in regions of high pimonidazole uptake. Regions of tumor necrosis also had lower uptake relative to those of viable tumor tissue. This distribution reflects a combination of the entrapment of 124I-FIAU in all viable tumor cells with a higher degree of radiotracer delivery to regions of high vascular perfusion. The relatively low accumulation in necrotic tumor regions confirms the requirement for intact viable cells to enable phosphorylation and entrapment of 124IFIAU.
In contrast, tumors lacking HSV1-tk expression showed overall lower 124I-FIAU accumulation in the tumor and the areas exhibiting the highest concentration of tracer corresponded to the necrotic tumor zones (Figure 1 d-f). As tumor cells in this model lack the enzyme required to entrap the radiotracer, this distribution most likely reflects a slower clearance rate of the diffusible non-phosphorylated radiotracer from the poorly perfused tumor regions.
In tumors containing the hypoxia-inducible HSV1-tk (HRE) construct, 124I-FIAU distribution appeared to closely match the fluorescent immunohistochemical staining pattern of the hypoxia marker pimonidazole (Figures 1a-c). Uptake of radiotracer was relatively lower in well-perfused tumor regions, indicating low expression of the reporter construct in normoxic cells. This implies that the principle mechanism of 124I-FIAU uptake in HRE tumors is hypoxia-induced HSV1-tk expression, and that the issues of differential radiotracer delivery and clearance rate do not significantly affect the ability of this reporter gene model system to accurately reflect spatial regions of tumor hypoxia.
Pixel-by pixel analysis of co-registered autoradiographic and fluorescence microscopy images corroborated observations made by visual inspection (Figure 3), that uptake of the reporter gene probe is observed in the same spatial location as regions of low tumor pO2. Quite different correlations were observed between 124I-FIAU uptake with Hoechst 33342 and pimonidazole in the positive (constitutive HSV1-tk expression) or parental (absent HSV1-tk expression) control studies respectively, thus providing further validation of the hypoxia-inducible reporter gene system in this in vivo model. eGFP expression was assessed by fluorescence microscopy in frozen sections obtained from positive control (PC) and hypoxia-inducible (HRE) tumors (data not shown). These images established that autofluorescence of the necrotic regions in the green part of the spectrum was approaching that of eGFP for the tumor model with hypoxia-regulated expression of HSV1-tkeGFP. Since hypoxic areas frequently form a rim around necrosis, it was not possible to reliably differentiate between eGFP expression and necrotic autofluorescence. The situation was different for the tumor model with constitutive expression of eGFP. In this case levels of eGFP fluorescence were significantly higher than non-specific autofluorescence. However, the combination of low specific signal intensity and high non-specific necrotic autofluorescence in the HRE tumors made meaningful quantitative comparison of eGFP expression difficult to perform.
The second part of this study was designed to evaluate the similarities and differences between 18F-FMISO and 124I-FIAU distribution in a tumor model with hypoxia-induced HSV1-tk expression at the histological level. Whilst comparative PET studies can provide non-invasive quantitative data, the resolution of even dedicated small animal microPET systems is insufficient to resolve spatial differences in distribution at the microscopic level. To establish that radiotracer-based detection of reporter gene expression reflects the underlying tumor physiology, it is necessary to demonstrate that what is observed at the macroscopic level is reflected at the microscopic level. The dual-autoradiographic technique used in this study demonstrated a strong correlation between the spatial distribution of the two radiotracers 18F-FMISO and 124I-FIAU and of the distribution of pimonidazole immunofluorescence staining (Figure 4).
Analysis of the degree of mismatch between intensity – based segmented 18F-FMISO and 124I-FIAU images resulted in a maximal mismatch of 27% between the two radiotracers, which is close agreement with the reported degree of mismatch between pimonidazole and the endogenous HIF-regulated protein carbonic anhydrase 9 (CA9) [15].
The data presented in this study demonstrate an overall consistency between the molecular events, induced by hypoxia as evidenced by reporter gene expression, with the exogenous hypoxia markers pimonidazole, visualized by immunohistochemistry, and 18F-FMISO, as visualized here by autoradiography. This consistency is not self-evident on account of the differing temporal kinetics and pO2 response governing the oxygen-dependence of hypoxia-induced gene expression and the irreversible trapping of exogenous bio-reducing hypoxia tracers. Previous studies have observed induction of HIF-mediated gene transcription below 5% O2 [19, 20] whilst uptake of 2-nitroimidazole compounds increases greatly only below 1.3% O2 (10mmHg) [21, 22]. This would be predicted to result in HRE-mediated reporter gene expression over a larger proportion of the hypoxic gradient than would be observed with 2-nitroimidazole compounds. As can be seen in Figure 3d-f, we generally observed what appears to be 124I-FIAU uptake in a greater fraction of the tumor area when compared to 18F-FMISO, although this cannot be determined definitively without the use of a threshold value of positivity. In addition, definitive statements regarding the pO2 gradients between normoxic and hypoxic zones cannot be made by digital autoradiography, because the ∼50 micron spatial resolution of this technique is still large relative to the spatial scale over which these hypoxic gradients occur [23].
In regard to the temporal kinetics of HRE-mediated reporter gene expression, we have previously demonstrated that half-maximal HRE-driven reporter gene expression in this model occurs between 4 and 8 hours after HIF1α induction [6], in contrast to assessment of 18F-FMISO uptake at 1-2 hours post-administration. This could result in a spatial differential between physical hypoxia (indicated by 2-nitroimidazole binding) and HRE-driven reporter gene expression, as regions of recently formed hypoxia would only be reflected by the former. Visual inspection of Figure 4(f) does indeed indicate regions of focal 18F-FMISO uptake that are negative for 124I-FIAU, whilst generally the reverse situation (focal 124I-FIAU uptake, negative 18F-FMISO) was not observed. This phenomenon is reflected in Figures 3b and 5b, d, where the uptake of 124I-FIAU appears to plateau as both pimonidazole and 18F-FMISO uptake continues to rise. Furthermore, intermittent (or acute) hypoxia would preferentially be visible by 18F-FMISO rather than 124I-FIAU HRE reporter gene imaging. However, the overall agreement and strong correlation between the distributions of the two radiotracers, found in this study, suggests the dominant component of the low pO2 intra-tumor distribution in the R3327-AT model results from chronic tumor hypoxia.
In conclusion, the data presented validates our hypoxia-induced reported gene model system in an in vivo setting, in spite of possible complications that must be taken into consideration when interpreting reporter transgene expression.
Acknowledgements
Grant support: NIH grants R01 CA84596, R24 CA83084 and P01 CA115675. Dr Carlin is funded in part by the Byrne Foundation and the Geoffrey Beene Cancer Research Foundation. Dr Pugachev is funded in part by the AAPM Research Initiative.
List of Abbreviations
- 18F-FMISO
18F-fluoromisonidazole
- 124I-FIAU
124I-5-iodo-2′-fluoro-2′deoxy-1-beta-D-arabino-furanosyl-uracil
- eGFP
enhanced green fluorescent protein
- HIF
hypoxia-inducible factor
- HIF1α
hypoxia-inducible factor subunit 1 alpha
- HRE
hypoxia response element
- HSV1-tk
herpes simplex virus 1-thymidine kinase
- PET
positron emission tomography
Footnotes
Publisher's Disclaimer: This is a PDF file of an unedited manuscript that has been accepted for publication. As a service to our customers we are providing this early version of the manuscript. The manuscript will undergo copyediting, typesetting, and review of the resulting proof before it is published in its final citable form. Please note that during the production process errors may be discovered which could affect the content, and all legal disclaimers that apply to the journal pertain.
References
- 1.Ballinger JR. Imaging hypoxia in tumors. Semin Nucl Med. 2001;31:321–9. doi: 10.1053/snuc.2001.26191. [DOI] [PubMed] [Google Scholar]
- 2.Chapman JD. Hypoxic sensitizers--implications for radiation therapy. N Engl J Med. 1979;301:1429–32. doi: 10.1056/NEJM197912273012606. [DOI] [PubMed] [Google Scholar]
- 3.Rasey JS, Koh WJ, Evans ML, Peterson LM, Lewellen TK, Graham MM, et al. Quantifying regional hypoxia in human tumors with positron emission tomography of [18F]fluoromisonidazole: a pretherapy study of 37 patients. Int J Radiat Oncol Biol Phys. 1996;36:417–28. doi: 10.1016/s0360-3016(96)00325-2. [DOI] [PubMed] [Google Scholar]
- 4.Rajendran JG, Wilson DC, Conrad EU, Peterson LM, Bruckner JD, Rasey JS, et al. [(18)F]FMISO and [(18)F]FDG PET imaging in soft tissue sarcomas: correlation of hypoxia, metabolism and VEGF expression. Eur J Nucl Med Mol Imaging. 2003;30:695–704. doi: 10.1007/s00259-002-1096-7. [DOI] [PubMed] [Google Scholar]
- 5.Semenza GL. Targeting HIF-1 for cancer therapy. Nat Rev Cancer. 2003;3:721–32. doi: 10.1038/nrc1187. [DOI] [PubMed] [Google Scholar]
- 6.Wen B, Burgman P, Zanzonico P, O'Donoghue J, Cai S, Finn R, et al. A preclinical model for noninvasive imaging of hypoxia-induced gene expression; comparison with an exogenous marker of tumor hypoxia. Eur J Nucl Med Mol Imaging. 2004;31:1530–8. doi: 10.1007/s00259-004-1673-z. [DOI] [PubMed] [Google Scholar]
- 7.Zanzonico P, O'Donoghue J, Chapman JD, Schneider R, Cai S, Larson S, et al. Iodine-124-labeled iodo-azomycin-galactoside imaging of tumor hypoxia in mice with serial microPET scanning. Eur J Nucl Med Mol Imaging. 2004;31:117–28. doi: 10.1007/s00259-003-1322-y. [DOI] [PubMed] [Google Scholar]
- 8.Hackman T, Doubrovin M, Balatoni J, Beresten T, Ponomarev V, Beattie B, et al. Imaging expression of cytosine deaminase-herpes virus thymidine kinase fusion gene (CD/TK) expression with [124I]FIAU and PET. Mol Imaging. 2002;1:36–42. doi: 10.1162/15353500200200003. [DOI] [PubMed] [Google Scholar]
- 9.Tjuvajev JG, Stockhammer G, Desai R, Uehara H, Watanabe K, Gansbacher B, et al. Imaging the expression of transfected genes in vivo. Cancer Res. 1995;55:6126–32. [PubMed] [Google Scholar]
- 10.Yang DJ, Wallace S, Cherif A, Li C, Gretzer MB, Kim EE, et al. Development of F-18-labeled fluoroerythronitroimidazole as a PET agent for imaging tumor hypoxia. Radiology. 1995;194:795–800. doi: 10.1148/radiology.194.3.7862981. [DOI] [PubMed] [Google Scholar]
- 11.Tjuvajev JG, Avril N, Oku T, Sasajima T, Miyagawa T, Joshi R, et al. Imaging herpes virus thymidine kinase gene transfer and expression by positron emission tomography. Cancer Res. 1998;58:4333–41. [PubMed] [Google Scholar]
- 12.Lim JL, Berridge MS. An efficient radiosynthesis of [18F]fluoromisonidazole. Appl Radiat Isot. 1993;44:1085–91. doi: 10.1016/0969-8043(93)90110-v. [DOI] [PubMed] [Google Scholar]
- 13.Martin GV, Caldwell JH, Graham MM, Grierson JR, Kroll K, Cowan MJ, et al. Noninvasive detection of hypoxic myocardium using fluorine-18-fluoromisonidazole and positron emission tomography. J Nucl Med. 1992;33:2202–8. [PubMed] [Google Scholar]
- 14.Pugachev A, Ruan S, Carlin S, Larson SM, Campa J, Ling CC, et al. Dependence of FDG uptake on tumor microenvironment. Int J Radiat Oncol Biol Phys. 2005;62:545–53. doi: 10.1016/j.ijrobp.2005.02.009. [DOI] [PubMed] [Google Scholar]
- 15.Li XF, Carlin S, Urano M, Russell J, Ling CC, O'Donoghue JA. Visualization of hypoxia in microscopic tumors by immunofluorescent microscopy. Cancer Res. 2007;67:7646–53. doi: 10.1158/0008-5472.CAN-06-4353. [DOI] [PubMed] [Google Scholar]
- 16.Troost EG, Laverman P, Philippens ME, Lok J, van der Kogel AJ, Oyen WJ, et al. Correlation of [(18)F]FMISO autoradiography and pimonodazole immunohistochemistry in human head and neck carcinoma xenografts. Eur J Nucl Med Mol Imaging. 2008;35:1803–11. doi: 10.1007/s00259-008-0772-7. [DOI] [PubMed] [Google Scholar]
- 17.Busk M, Horsman MR, Jakobsen S, Keiding S, van der Kogel AJ, Bussink J, et al. Imaging hypoxia in xenografted and murine tumors with 18F-fluoroazomycin arabinoside: a comparative study involving microPET, autoradiography, PO2-polarography, and fluorescence microscopy. Int J Radiat Oncol Biol Phys. 2008;70:1202–12. doi: 10.1016/j.ijrobp.2007.11.034. [DOI] [PubMed] [Google Scholar]
- 18.Wijffels KI, Kaanders JH, Rijken PF, Bussink J, van den Hoogen FJ, Marres HA, et al. Vascular architecture and hypoxic profiles in human head and neck squamous cell carcinomas. Br J Cancer. 2000;83:674–83. doi: 10.1054/bjoc.2000.1325. [DOI] [PMC free article] [PubMed] [Google Scholar]
- 19.Jiang BH, Semenza GL, Bauer C, Marti HH. Hypoxia-inducible factor 1 levels vary exponentially over a physiologically relevant range of O2 tension. Am J Physiol. 1996;271:C1172–80. doi: 10.1152/ajpcell.1996.271.4.C1172. [DOI] [PubMed] [Google Scholar]
- 20.Sorensen BS, Hao J, Overgaard J, Vorum H, Honore B, Alsner J, et al. Influence of oxygen concentration and pH on expression of hypoxia induced genes. Radiother Oncol. 2005;76:187–93. doi: 10.1016/j.radonc.2005.06.037. [DOI] [PubMed] [Google Scholar]
- 21.Koch CJ. Measurement of absolute oxygen levels in cells and tissues using oxygen sensors and 2-nitroimidazole EF5. Methods Enzymol. 2002;352:3–31. doi: 10.1016/s0076-6879(02)52003-6. [DOI] [PubMed] [Google Scholar]
- 22.Gross MW, Karbach U, Groebe K, Franko AJ, Mueller-Klieser W. Calibration of misonidazole labeling by simultaneous measurement of oxygen tension and labeling density in multicellular spheroids. Int J Cancer. 1995;61:567–73. doi: 10.1002/ijc.2910610422. [DOI] [PubMed] [Google Scholar]
- 23.Ljungkvist AS, Bussink J, Rijken PF, Kaanders JH, van der Kogel AJ, Denekamp J. Vascular architecture, hypoxia, and proliferation in first-generation xenografts of human head-and-neck squamous cell carcinomas. Int J Radiat Oncol Biol Phys. 2002;54:215–28. doi: 10.1016/s0360-3016(02)02938-3. [DOI] [PubMed] [Google Scholar]