Recently developed labeling technologies have enabled new insights into cellular function and biomolecular interaction. While great advances have been made in encodable probes,[1] molecular labels,[2] ultrabright emitters,[3] and specific coupling chemistries,[4] the benefits of a single combined technology offering small size, bright emission, and potential genetic encodability has yet to be realized. Within the past few years, few-atom silver nanoclusters have offered promise to combine small size and potentially ultrabright emission in a variety of scaffolds, which stabilize silver nanocluster emission ranging in brightness from that of typical organic dyes[5] to that exceeding brightness of semiconductor quantum dots.[6,7] Based on a nucleolus-bound silver binding protein, we report a significant advance toward utilizing silver nanocluster emission within living cells and the potential for further optimization of small peptide scaffolds for improved nanocluster optical properties.
Frequently used by pathologists, silver nanoparticle-based staining has been utilized to detect nucleolus organizing regions within cells and thus partially reveal nucleolus location.[8,9] This method is thought to reflect cell proliferation activity of potentially cancerous cells.[10] The rather harsh, general protocol for nucleolar silver staining within fixed cells (>5.8 M silver nitrate, 60 °C) yields large metallic silver nanoparticles that appear as dark spots under brightfield microscopy or electron microscopy due to the interaction between argyrophilic proteins and silver.[11] Considering the specific nucleolar staining with large silver nanoparticles, we expected that fluorescent silver nanoclusters could be produced in vivo in the nucleoli of cells by ambient temperature photoactivation, and that one of the known silver-binding proteins, nucleolin, may serve as a guide for templating the high efficiency creation of fluorescent silver nanoclusters.
Although encountering problems with alteration of activity and autofluorescence, especially at low copy numbers, live cell imaging studies often employ GFP fusions, expensive fluorescent antibodies, or specifically designed dyes against certain subcellular components for visualization via fluorescence microscopy.[12] Circumventing background emission, novel long-lived europium complexes designed for nucleolar targeting can be temporally distinguished using time-gated microscopy.[13] While such long-lived emitters increase bulk S/N, their low emission rates preclude observation of low copy numbers. Recent instrumental developments now enable imaging of very short lifetime materials as well.[14] Such fast (∼100 ps) gating could enable fast emitters to be observed before standard (ns) dyes begin to emit. When combined with silver nanoclusters exhibiting picosecond lifetimes,[6,15] high S/N imaging of noble metal nanoclusters should be readily accomplished even in the presence of other dyes.
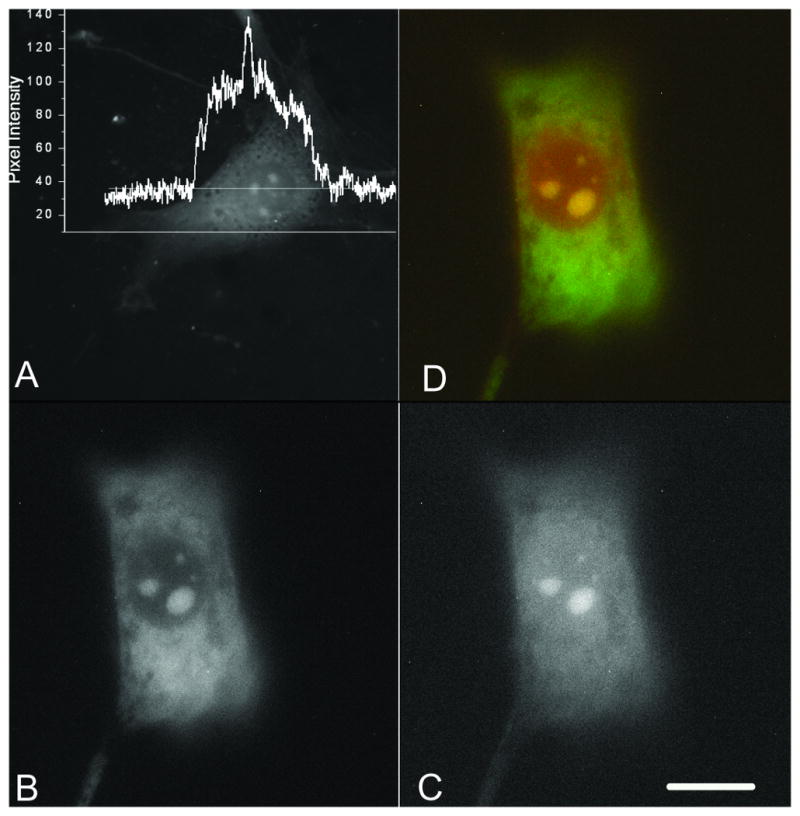
Contrary to the ordinary harsh silver staining conditions, fluorescent silver nanocluster formation can be initiated and used to stain the cells at much lower AgNO3 concentrations (20 mM, supplementary materials) via ambient temperature photoactivation. Such images (Fig. 1) always emphasize several bright regions reminiscent of nucleoli, on top of weak cytoplasmic and nuclear emission. The emission intensity of the ‘bright regions’ is about twice the intensity of that from the cytoplasm, and exhibits broad spectra between 500-700 nm under blue excitation (supplementary materials), likely resulting from multiple emissive species of 2-7 Ag atoms in the cells. The spectra differ somewhat among different cellular components, with the bright spots exhibiting slightly higher ratios of red to green emission than cytoplasm. The emission of the silver-stained cells is quite fast (220 ps (33%) and 1760 ps (67%)) and very stable, maintaining more than 50% intensity for 25 min of continuous illumination at 1 mW/cm2 (supplementary materials). To confirm fluorescent silver nucleolar staining, colocalization experiments were performed with SYTO® RNASelect green fluorescence stain (Invitrogen). As shown in Fig. 1, the merged image (D) of RNASelect fluorescence (B, BP 515 - 525; green channel) and fluorescent nanocluster silver staining (C, LP 665; red channel) confirms nucleolar staining.
Figure 1.

Emission from formaldehyde-fixed NIH 3T3 cells loaded with 100 mM silver nitrate for 20 hrs. A) Fluorescence image; the inset is the intensity profile along the line drawn across the cell. Scale bar: 30 μm. B) to D) Colocalization of silver and SYTO ® RNASelect staining. B) emission from RNASelect fluorescence (green channel), C) emission from silver clusters (red channel), D) merge of B) and C).
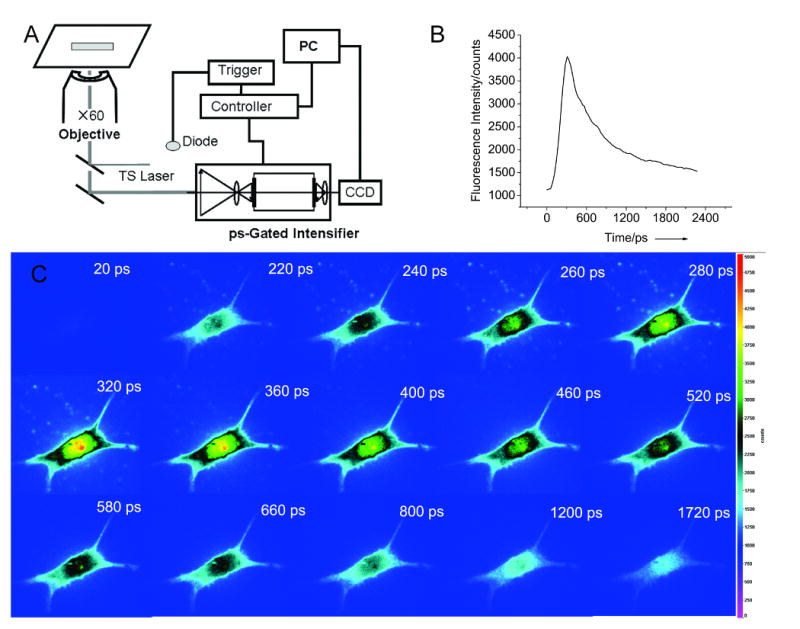
As the silver clusters exhibit short lifetimes, the silver stained cells can be monitored with picosecond-gated microscopy to minimize contributions from autofluorescence or other co-loaded dyes (Fig. 2). The 212-ps IRF-broadened emission centered at the nucleus increases to its maximum intensity within 320 ps and then fades to the autofluorescence level within a further 1500 ps. The variation in emission intensity of cellular images is in line with the lifetime decay of the silver clusters in cells. Not only is this the first report of silver fluorescence of cells, but to our knowledge, is also the first report collecting short-time emission to increase S/N by temporally rejecting slower emission from other co-loaded dyes or autofluorescence.
Figure 2.

Time-gated images of NIH 3T3 cells stained with silver nitrate. A) Microscope setup integrated with ps-gated intensifier (LaVision Picostar HR) and CCD camera (Andor iXon). B) Time-slices of a cell stained with silver nitrate. C) Time profile of the time series images showing the fast silver nanocluster emission at short times. Note that black indicates an intermediate intensity level in this color scheme.
Consisting of more than 700 amino acids, nucleolin was identified as one of the major proteins to bind silver atoms in silver staining,[16] and appears to nucleate the formation of fluorescent silver nanoclusters in our studies. Unfortunately, nucleolin is far too large to be useful as a label. Ligands which can protect the silver clusters are indispensable as the silver clusters are very vulnerable, with reduction potential decreasing from 0.799 V of the conventional silver electrode to -1.8 V of free silver atom.[17] This implies that the newly-formed silver clusters will be oxidized quickly if no protection is available. As the silver binding site is unknown, we designed a short peptide KECDKKECDKKECDK (P1), incorporating the specific amino acids most prevalent in nucleolin: glutamic acid (15.6%), lysine (12.7%), and aspartic acid (8.5%). We also incorporated several cystine groups based on the known strong silver affinity of thionein.[18] This nucleolin-inspired peptide (P1) forms and stabilizes fluorescent silver clusters directly in phosphate buffered saline (PBS), indicating a strong interaction between silver and ligand. However, the silver clusters protected with P1 (P1-Ag) in aqueous solution are only moderately stable at room temperature (chemical lifetime, 3 days). The short peptide length may limit nanocluster stability due to greater vulnerability to oxygen and chloride ion in aqueous solution. In separate ongoing studies of silver nanocluster creation in specifically designed dendrimers, we observed that hydrophobic regions facilitate the formation of silver clusters (unpublished), leading us to improve the peptide by incorporating several hydrophobic amino acids to yield HDCHLHLHDCHLHLHCDH (P2) and HDCNKDKHDCNKDKHDCN (P3). Silver clusters protected with P2 and P3 (P2-Ag and P3-Ag) are much more stable (chemical lifetime, 2 weeks in deionized water and 5 weeks in PBS, respectively). Nevertheless, all the peptide-protected silver clusters are stable at -20 °C for at least one month.
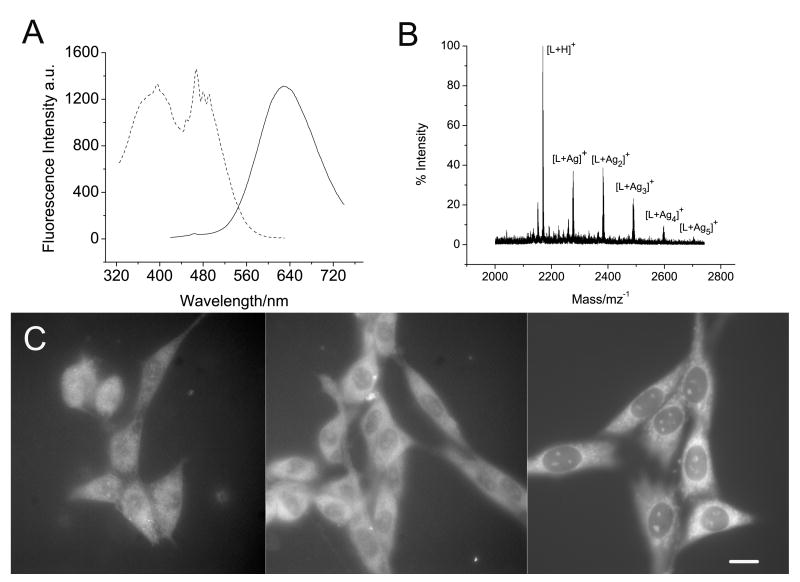
These silver clusters exhibit similar photophysics to those in the nucleolus, but with narrower emissions at 610 nm (P1-Ag), 615 nm (P2-Ag) or 630 nm (P3-Ag) (Fig. 3A and supplementary materials). The MALDI mass spectrometry confirms the presence of silver clusters, in which Ag2, Ag3, Ag4, or Ag5 are bound to a single peptide (Fig. 3B). The fluorescence decay of P1-Ag can be fit biexponentially, with a fast component of 260 ps (58%), and a slow component of 2300 ps (42%). Silver clusters prepared in P2 and P3 also exhibit similar lifetimes (P2-Ag: 73 ps (15%) and 1900 ps (85%); P3-Ag: 420 ps (36%) and 2900 ps (64%). The photophysical similarity between silver-stained cells and peptide-protected silver clusters also strongly supports the observation of fluorescent silver clusters in cells. This in turn indicates that nucleolin as well as other argyrophilic proteins can be very useful guides for biocompatible silver cluster preparation.
Figure 3.
Photophysics of P3-Ag and its cell loading. A) Emission and excitation spectra of aqueous P3-Ag solution. Emission (solid) was excited at 400 nm, and excitation (dotted) was detected at 630 nm. B) MALDI mass spectrum of P3-Ag. C) Fluorescence images of NIH 3T3 cells loaded with P3-Ag (0.5 mg) Left) in DMEM at 37 °C and 5% CO2, Center) in DMEM at 4 °C, and Right) methanol-fixed NIH 3T3 cells loaded with P3-Ag in DMEM at r.t. incubation time: 1 hr. Under these imaging conditions, no detectable emission from the control cells without Ag nanoclusters is observed (not shown). Scale bar 30 μm.
Contrary to much larger semiconductor QDs which typically only enter cells via endocytosis and remain trapped in endosomes, live cells loaded with much smaller P3-Ag in Dulbecco's Modified Eagle's Medium (DMEM) at 37 °C and 5% CO2 for 1 hr show the silver nanocluster emission to be distributed evenly (Fig. 3C, a). The P3-Ag also passes through the nuclear membrane, resulting in the weak nuclear staining. The methanol-fixed cells loaded with P3-Ag for 1 hr (Fig. 3C, c) show evenly distributed silver cluster emission in the cytoplasm and strong nuclear staining of some organelles. P3-Ag was also loaded into cells at 4 °C (Fig. 3C, b), suggesting that the peptide protected silver clusters do not enter by endocytosis – an important feature for further biological applications.
Supplementary Material
Footnotes
The authors gratefully acknowledge financial support from NSF BES-0323453, Invitrogen Corp., NIH R01GM68732, and NIH P20GM072021, and thank Prof. D. F. Doyle for use of his cell culture facility, and Prof. Y.-L. Tzeng for the gift of the peptides
Supporting information for this article is available on the WWW under http://www.angewandte.org or from the author.
References
- 1.Oparka KJ, Roberts AG, Santa Cruz S, Boevink P, Prior DAM, Smallcombe A. Nature. 1997;388:401. [Google Scholar]
- 2.Chem I, Ting AY. Curr Opin Biotech. 2005;16:35. doi: 10.1016/j.copbio.2004.12.003. [DOI] [PubMed] [Google Scholar]
- 3.Stellacci F, Bauer CA, Meyer-Friedrichsen T, Wenseleers W, Marder SR, Perry JW. J Am Chem Soc. 2003;125:328. doi: 10.1021/ja0281277. [DOI] [PubMed] [Google Scholar]
- 4.Breinbauer R, Köhn M. Chem Bio Chem. 2003;4:1147. doi: 10.1002/cbic.200300705. [DOI] [PubMed] [Google Scholar]
- 5.Petty JT, Zheng J, Hud NV, Dickson RM. J Am Chem Soc. 2004;126:5207. doi: 10.1021/ja031931o. [DOI] [PubMed] [Google Scholar]
- 6.Zheng J, Dickson RM. J Am Chem Soc. 2002;124:13982. doi: 10.1021/ja028282l. [DOI] [PubMed] [Google Scholar]
- 7.Peyser-Capadona L, Zheng J, Gonzalez JI, Lee TH, Patel SA, Dickson RM. Phys Rev Lett. 2005;94:058301. doi: 10.1103/PhysRevLett.94.058301. [DOI] [PubMed] [Google Scholar]
- 8.Scheer U, Hock R. Curr Opin Cell Biol. 1999;11:365. doi: 10.1016/S0955-0674(99)80054-4. [DOI] [PubMed] [Google Scholar]
- 9.Goodpasture C, Bloom SE. Chromosoma. 1975;53:37. doi: 10.1007/BF00329389. [DOI] [PubMed] [Google Scholar]
- 10.Horky M, Kotala V, Anton M, Wesierska-Gadek J. Ann N Y Acad Sci. 2002;973:258. doi: 10.1111/j.1749-6632.2002.tb04645.x. [DOI] [PubMed] [Google Scholar]
- 11.Roussel P, Hernandez-Verdun D. Exp Cell Res. 1994;214:465. doi: 10.1006/excr.1994.1283. [DOI] [PubMed] [Google Scholar]
- 12.Kennedy BK, Gotta M, Sinclair DA, Mills K, McNabb DS, Murthy M, Pak SM, Laroche T, Gasser SM, Guarente L. Cell. 1997;89:381. doi: 10.1016/s0092-8674(00)80219-6. [DOI] [PubMed] [Google Scholar]
- 13.Yu J, Parker D, Pal R, Poole RA, Cann MJ. J Am Chem Soc. 2006;128:2294. doi: 10.1021/ja056303g. [DOI] [PubMed] [Google Scholar]
- 14.Dowling K, Dayel MJ, Lever MJ, French PMW, Hares JD, Dymoke-Bradshaw AKL. Opt Lett. 1998;23:810. doi: 10.1364/ol.23.000810. [DOI] [PubMed] [Google Scholar]
- 15.Peyser LA, Vison AE, Bartko AP, Dickson RM. Science. 2001;291:103. doi: 10.1126/science.291.5501.103. [DOI] [PubMed] [Google Scholar]
- 16.Bourbon HM, Lapeyre B, Amalric F. J Mol Biol. 1988;200:627. doi: 10.1016/0022-2836(88)90476-7. [DOI] [PubMed] [Google Scholar]
- 17.Henglein A. Chem Rev. 1989;89:1861. [Google Scholar]
- 18.Wapnir RA. Protein Nutrition and Mineral Absorption. CRC Press; Boca Raton, Florida, USA: 1991. p. 147. [Google Scholar]
Associated Data
This section collects any data citations, data availability statements, or supplementary materials included in this article.


