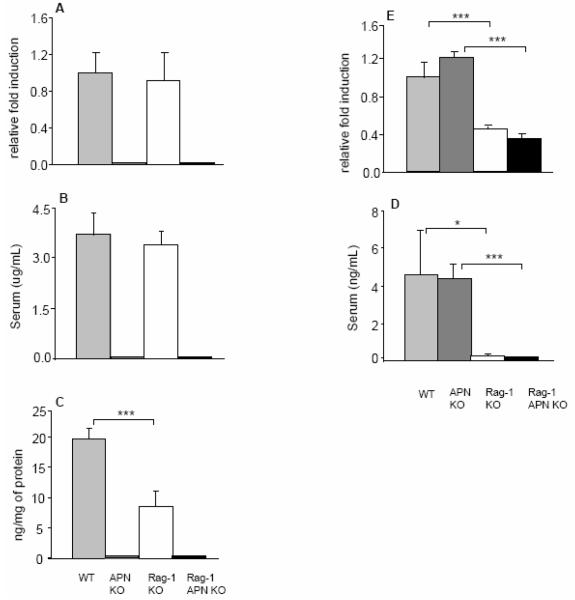
Figure 4. Adipokine levels in Rag-1 KO and Rag-1 APN KO after transfer of RBhigh cells.
Expression of APN and leptin in mesenteric adipose tissue of WT (light gray bars), APN KO (dark gray bars), Rag-1 KO (white bars) and Rag-1 APN KO mice (black bars) was determined by real-time RT-PCR (A and D). Data are expressed as fold induction compared with control WT mice that did not receive RBhigh cells. Adiponectin and leptin levels were measured in serum (B and D) and in colon culture supernatants (C) in WT (light gray bars), APN KO (dark gray bars), Rag-1 KO (white bars) and Rag-1 APN KO mice (black bars) by ELISA. Data are mean +/− SEM, n=5-13 mice per group. *p<0.05, ***p<0.001

