

Abstract
Background and Purpose
White-matter hyperintensities (WMHs) detected by magnetic resonance imaging are thought to represent the effects of cerebral small-vessel disease and neurodegenerative changes. We sought to determine whether the spatial distribution of WMHs discriminates between different disease groups and healthy aging individuals and whether these distributions are related to local cerebral perfusion patterns.
Methods
We examined the pattern of WMHs by T2/fluid-attenuated inversion recovery–weighted magnetic resonance imaging in 3 groups of subjects: cerebral amyloid angiopathy (n=32), Alzheimer disease or mild cognitive impairment (n=41), and healthy aging (n=29). WMH frequency maps were calculated for each group, and spatial distributions were compared by voxel-wise logistic regression. WMHs were also analyzed as a function of normal cerebral perfusion patterns by overlaying a single photon emission computed tomography atlas.
Results
Although WMH volume was greater in cerebral amyloid angiopathy and Alzheimer disease/mild cognitive impairment than in healthy aging, there was no consistent difference in the spatial distributions when controlling for total WMH volume. Hyperintensities were most frequent in the deep periventricular WM in all 3 groups. A strong inverse correlation between hyperintensity frequency and normal perfusion was demonstrated in all groups, demonstrating that WMHs were most common in regions of relatively lower normal cerebral perfusion.
Conclusions
WMHs show a common distribution pattern and predilection for cerebral WM regions with lower atlas-derived perfusion, regardless of the underlying diagnosis. These data suggest that across diverse disease processes, WM injury may occur in a pattern that reflects underlying tissue properties, such as relative perfusion.
Keywords: Alzheimer disease, cerebral amyloid angiopathy, magnetic resonance imaging, perfusion, white-matter hyperintensities
White-matter hyperintensities (WMHs), as detected by T2-weighted magnetic resonance imaging (MRI), are present in many neurologic diseases and are frequent in healthy older individuals.1-3 Age and hypertension are significant risk factors for increased WMHs in healthy aging (HA).2,4 Greater WMH burdens have been found in neurologic syndromes such as vascular dementia, cerebral amyloid angiopathy (CAA), and Alzheimer disease (AD) and mild cognitive impairment (MCI).5-8 It is unclear whether the increased volume of WMHs in these disorders is related to a shared etiology of the primary disease, an incidental secondary pathogenic process, or rather the superimposition of different types of WM damage exhibiting a common appearance on MRI.
Although MRI is sensitive in detecting pathologic changes in the WM, it is relatively nonspecific in distinguishing demyelination, axonal degeneration, lacunar changes, or inflammatory parenchymal alterations, eg, edema and inflammatory infiltrates. Histopathologic studies9-11 and more recent magnetization transfer imaging studies12,13 have shown that in healthy and disease conditions, WMHs are quite heterogeneous. In healthy older individuals, the vast majority of these hyperintensities are believed to be vascular in nature, purportedly resulting from ischemic and hypoxic changes.4,14-16 In CAA, the vascular deposition of amyloid leads to loss of vessel wall integrity and intracerebral hemorrhages (ICHs).17 These changes in vascular structure or function may cause increased WM injury in these subjects as well.11,18 In AD and MCI subjects, it is unclear whether WMHs reflect a secondary vascular disorder or whether they are linked to a primary neurodegenerative pathology leading to secondary WM injury.
We sought to determine whether the spatial distribution of age- and disease-related WMHs depends primarily on the underlying clinical diagnosis or whether it reflects regional differences in the cerebral WM itself. In this retrospective, cross-sectional analysis, we examined the voxel-wise spatial distributions of MRI-detected WMHs in patients with CAA, AD/MCI, and nondemented HA subjects. These spatial distributions were compared statistically to determine regions of significant difference that were independent of differences in total WMH burden. We also used an atlas of normal cerebral perfusion to examine the relation between brain regions predisposed to develop WMHs and the normal pattern of regional perfusion.
Methods
Subjects
We studied subjects with a diagnosis of probable CAA (n=32) or AD/MCI (n=41) and nondemented HA subjects (n=29). AD/MCI and CAA subjects represent a subset of participants from a prior study with MRI data suitable for spatial analysis.19 In brief, probable AD was diagnosed according to National Institute of Neurological and Communicative Disorders and Stroke–Alzheimer’s Disease and Related Disorders Association criteria,20 MCI by the Peterson criteria,21 and probable CAA by the Boston criteria.22 Median global Clinical Dementia Rating23 scores were 0.5 (25th and 75th percentiles, 0.5 and 0.5) and 1 (25th and 75th percentiles, 0.5 and 2) for the MCI and AD subjects, respectively. CAA subjects presented with ICH and, because of the confounding effects of the acute stroke, did not receive systematic cognitive testing at the time of scanning. HA subjects were recruited from the same community as our disease population through print advertisement and underwent a multistage screening procedure to exclude subjects with major vascular risk factors or other significant medical, neurologic, or psychiatric diseases, as described previously.24 Twenty-nine subjects with Clinical Dementia Rating sum of boxes and global scores of 0 and a consensus diagnosis of normal cognition were selected. All subjects gave informed consent and were enrolled in institutional review board–approved studies.
MRI Acquisition and Analysis
All subjects underwent MRI examination of the brain at 1.5 T (Signa, General Electric Medical Systems, Milwaukee, Wis) that included a T2-weighted or fluid-attenuated inversion-recovery (FLAIR) sequence. HA subjects had dual-echo (proton density and T2-weighted) axial images acquired with interleaved sequences (repetition time/echo time/echo time [TR/TE/TE]=3000/30/80 ms, 256×256 matrix size, and 3-mm slice thickness). For AD/MCI and CAA subjects, whole-brain FLAIR axial images (TR/TE=10 000/ 140 ms, inversion time=2200 ms) and fast spin-echo T2-weighted images (TR=6025 ms, TE=102 ms) were acquired in the axial plane with a 256×256 matrix size, 5-mm slice thickness, and 1-mm gap.
A region of interest encompassing areas of supratentorial WMHs was created from T2-weighted or FLAIR MRI images through a combination of signal-intensity thresholding and manual editing with the use of MRIcro (www.mricro.com; University of Nottingham, Nottingham, UK).19 Hyperintensity of the septum pellucidum, which is of doubtful pathologic significance, and of the area immediately adjacent to its connection with the corpus callosum was not considered as a WMH. A high interrater reliability of this method (intraclass correlation coefficient=0.98)19 and a high correlation between WMHs measured on T2-weighted and FLAIR sequences (intraclass correlation coefficient=0.99) have been reported previously.25 Because the presence of acute or chronic ICH can obscure the underlying brain parenchyma, these voxels were manually segmented and excluded from analysis. In addition, we excluded the ICH-involved hemisphere from the determination of total WMH volume, instead doubling the WMH volume of the uninvolved hemisphere in these cases, as previously reported.19 To account for differences in head size, the WMH volumes were calculated in common space (ie, representing relative rather than absolute WMH volumes) after affine transformation described next.
Single-photon emission computed tomography (SPECT) images from 47 healthy individuals between the ages of 22 and 49 years (mean±SD age, 34.3±7.6 years; 25 men) were obtained from a public repository maintained by the Society of Nuclear Medicine Brain Imaging Council (available at http://brainscans.indd.org/brncncl4.htm). The SPECT imaging was acquired after intravenous injection of 1000 MBq of Tc-99m–ethylene cysteinate dimer (Neurolite, DuPont Pharma, Billerica, Mass) on a triple-headed Picker camera (Prism 3000, Picker International, Cleveland, Ohio). Raw images were reconstructed with use of a standardized low-pass filter (order=4.0, cutoff=0.26), followed by global proportional scaling to a range of values from 0 to 1000 relative perfusion units. A mean atlas was calculated and transformed into Montreal Neurological Institute standard space26 as described next. Central slices of the atlas, masked with the International Consortium of Brain Mapping WM probability atlas at a threshold of 0.75, are presented in Figure 1 to illustrate the inhomogeneity of perfusion within the WM. Atlas-derived perfusion for WM ranged from 287 to 903, with a mean perfusion of 537.
Figure 1.
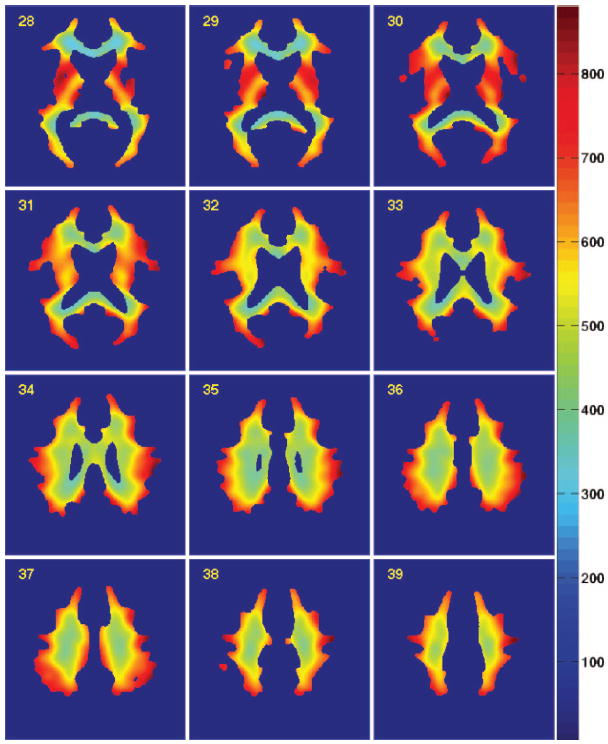
Atlas of normal cerebral WM perfusion. SPECT perfusion atlas generated from 47 healthy adult volunteers was masked by a coregistered WM probability atlas. (A conservative threshold of 0.75 was used for illustrative purposes only.) Perfusion values are indicated by the color bar, in which red indicates higher relative perfusion (scale, relative perfusion units).
The Centre for Functional MRI of the Brain’s Linear Image Registration Tool27 was applied with 12 degrees of freedom and a mutual information criterion to calculate affine transformations for each subject’s MRI images. Registration quality was ensured with visual inspection of transformed subject images. The transforms were used to resample the WMH segmentations into Montreal Neurological Institute space for spatial distribution analysis. The SPECT perfusion atlas was resampled into the native space of each individual subject by applying the inverse transformation for comparison of regional atlas-derived perfusion differences between WMHs in each of our subject cohorts.
WMH frequency maps were calculated for each group to indicate the WMH prevalence at each voxel (ie, a value of 0.50 would indicate that 50% of subjects in that cohort had WMHs in that anatomic location [voxel] after transformation to common space). Normal perfusion values, derived from the SPECT atlas, were extracted for each voxel in the frequency maps for each cohort. Finally, the atlas-derived perfusion values were also extracted for each voxel identified as a WMH in all individual subject segmentations.
Statistical Analysis
Total WMH volumes were calculated for each disease group and compared by Student’s t test. To identify anatomic regions with significantly different WMH prevalence, frequency maps for the HA, AD/MCI, and CAA cohorts were compared by voxel-wise logistic regression. Logistic regression was performed on the binary WMH segmentations (where 1=WMH) for each voxel in which a WMH was identified in at least 1 subject. The dependent variable was the presence or absence of a WMH in that voxel for each subject, and the independent/predictor variable was disease group either alone or together with total WMH volume. Descriptive statistics and the nonparametric Kruskal-Wallis test were used to compare the atlas-derived WMH perfusion values between the 3 cohorts. The relation between WMH frequency and normal atlas-derived perfusion was assessed by Pearson’s correlation. A probability value threshold of 0.05 was used to define statistical significance, with correction for multiple comparisons where appropriate.
Results
All subjects demonstrated multifocal T2 hyperintensity in the cerebral WM. Subject demographic and quantitative MRI characteristics for the HA, AD/MCI, and CAA cohorts are reported in Table 1. The sex distribution did not differ between the groups; however, we found an age difference between the disease groups (ANOVA P=0.04), in which the AD/MCI group was slightly older than the HA group (post hoc P=0.04). WMH volume was significantly lower in the HA cohort compared with both the AD/MCI and CAA groups (P<0.001 and P<0.0001, respectively) but did not differ between AD/MCI and CAA groups (P=0.19). Interhemispheric WMH volumes were highly concordant in the 10 CAA subjects without ICH (r=0.99), in the HA cohort (r=0.98), and in the AD/MCI (r=0.96) cohort. Total WMH volume was significantly greater in subjects with coronary artery disease (P=0.004), a history of hypertension (P=0.01), and a history of ischemic stroke (P=0.012) but did not differ with respect to diabetes.
Table 1.
Subject Demographics, Clinical Characteristics, and WMH Volumes
| HA, n=29 | AD/MCI, n=41 | CAA, n=32 | |
|---|---|---|---|
| Males | 11 (37.9) | 21 (51.2) | 12 (37.5) |
| Mean±SD age, y | 71.21±5.1 | 75.10±7.1 | 72.25±7.1 |
| Coronary artery disease | 2 (6.9) | 16 (39.0) | 7 (21.9) |
| Diabetes | 1 (3.4) | 7 (17.1) | 2 (6.3) |
| History of hypertension | 10 (34.5) | 17 (41.5) | 15 (46.9) |
| History of ischemic stroke | 0 (0.0) | 1 (2.4) | 4 (12.5) |
| Total WMH volume, median (25th, 75th percentiles) | 1.71 (0.75, 5.37) | 16.1 (9.20, 33.56) | 33.5 (15.51, 49.11)* |
Values are n and (%). All volumes are in milliliters.
Total WMH in the CAA cohort was estimated by doubling the non-ICH hemisphere, as previously validated.19
WMH frequency maps were generated for each of the 3 groups to visualize the spatial distributions of WMHs (Figure 2). WMHs in HA subjects were multifocal and distributed around the frontal and posterior horns of the lateral ventricles as well as in the parietal WM. These same regions were more extensively affected in the disease groups, with voxels of WMH present in >60% of subjects in the AD/MCI and CAA groups. WMHs were less frequent in the juxtacortical, subcortical, and deep WM, though again more common in the AD/MCI and CAA groups than in HA.
Figure 2.
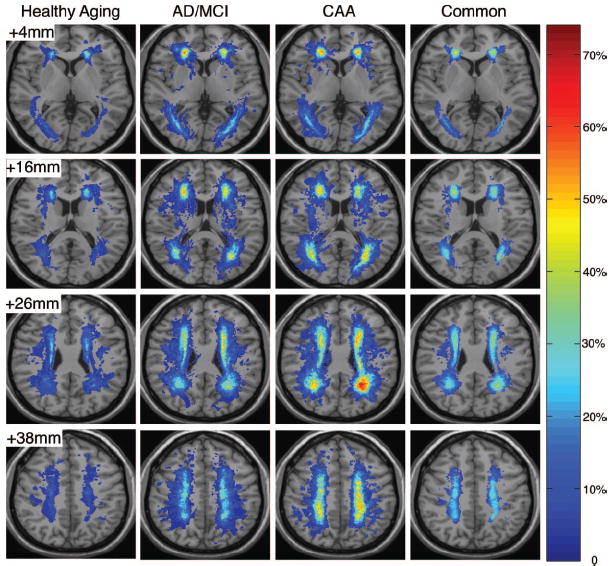
Spatial distribution of WMHs. The WMH frequency distributions for the HA, AD/MCI, and CAA cohorts were overlaid onto the International Consortium of Brain Mapping template to which all individual subject MRI images were registered. WMH frequency corresponds to the proportion of subjects in each cohort having WMHs in that image voxel. The fourth column represents the regions of WMHs common to all subjects, with the relative frequency across the entire study population.
Voxel-wise logistic-regression analysis with and without controlling for total WMH volume was performed to yield probability value maps, displayed with a threshold for statistical significance. Figure 3 demonstrates several small clusters of significant difference between either the AD/MCI or CAA group and the HA. These regions were absent, however, when controlling for the confounding effects of total WMH load. Therefore, observed differences in the frequency distributions (Figure 2) can be accounted for by differences in WMH burden; ie, subjects with the same total WMH volume would have the same spatial pattern regardless of their diagnosis. The additional confounds of age, diabetes, and history of stroke, hypertension, or coronary artery disease were also evaluated in logistic-regression models and were found to not be significantly associated with voxel-wise WMH location.
Figure 3.
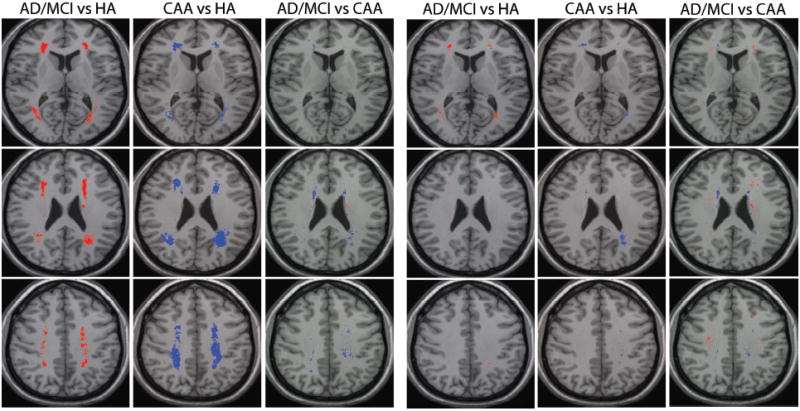
Statistical comparison of WMH distributions. WMH distributions were compared between the 3 groups by voxel-wise logistic regression, with and without controlling for total WMH volume in each subject. Voxels in which the prevalence of WMHs differed significantly (P<0.05) are presented according to the group with the higher WMH prevalence: HA higher (green), AD/MCI higher (red), and CAA higher (blue). Three representative slices are shown.
Finally, we analyzed the distribution of WMHs in the context of normal atlas-derived cerebral perfusion patterns. Normal perfusion values derived from the SPECT atlas were extracted for all WMH voxels present in >10% of subjects in each subgroup. The perfusion of these regions was significantly different in the 3 cohorts (Kruskal-Wallis test P<0.0001), with the median perfusion value being lowest in the HA group and highest in the CAA group (Table 2). The relation between WMH frequency and normal atlas-derived perfusion is presented in the histogram in Figure 4 and demonstrates a strong inverse correlation for all subjects (r=−0.54, P<0.001). This finding was consistent within each of the cohorts as well, though slightly weaker in the HA group (HA r=−0.38, AD/MCI r=−0.52, CAA r=−0.50; P<0.001 for all correlations), thus illustrating that WMHs are more likely to be present in regions of cerebral WM with lower relative perfusion, at least in the normal brain.
Table 2.
Normal Atlas-Derived Perfusion Values for Regions in Which WMHs Were Present in >10% (ie, Frequency Threshold of 0.10) of Subjects in the HA, AD/MCI, and CAA Cohorts
| Normal Regional Perfusion Values, Median (25th, 75th Percentiles) | |
|---|---|
| HA | 430 (391, 484) |
| AD/MCI | 472 (412, 539) |
| CAA | 493 (429, 571) |
| Kruskal-Wallis P value* | P<0.0001 (χ2=7002.915) |
Pairwise analysis by the Mann–Whitney U test was also significant for all comparisons.
Figure 4.
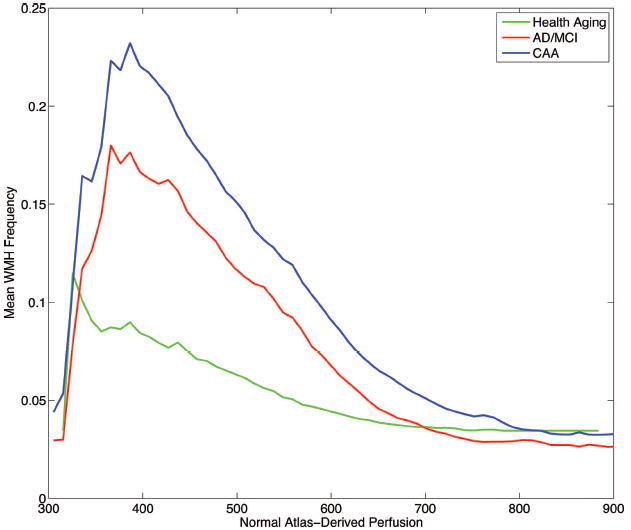
WMH frequency histogram with respect to normal atlas-derived perfusion for the HA (green), AD/MCI (red), and CAA (blue) cohorts. The increased prevalence of hyperintensity in regions of relatively lower normal perfusion is evident (Pearson’s r=−0.54, P<0.001 across all subjects).
Discussion
This analysis sought to compare the distribution of WMHs, an MRI marker of damage in the cerebral WM, in subjects diagnosed with CAA and AD/MCI and nondemented HA individuals. Although global WMH volumes were considerably greater in CAA and AD/MCI than in HA subjects, we found a common spatial pattern of hyperintensities, consistent with the recent finding of similar distributions in region-based approaches in HA and AD.6,7 We further demonstrated, using an atlas of normal cerebral perfusion patterns, that WMHs in all disease groups show a predilection for regions of WM that normally have lower relative perfusion. We believe that this is the first study to examine how the normal regional variability in WM perfusion influences the distribution of WMHs.
WMH frequency distributions demonstrated a predilection for deep periventricular WM regions, specifically, areas around the frontal and posterior ventricular horns. This pattern was maintained even in HA subjects, in whom the overall burden of WMHs was substantially lower. Logistic-regression analysis controlling for total WMH volume showed the overall spatial pattern of hyperintensity to be conserved in all 3 groups. There was no evidence of a disease-specific anatomic distribution of WMHs, such as a specific CAA-related pattern of posterior WMHs that might have been predicted from the posterior predominance of CAA pathology and CAA-related hemorrhages.28,29 We also did not observe an AD-associated increase in WMHs in posterior periventricular WM and the splenium of the corpus callosum, as was recently reported,8 despite study populations that were similar in terms of age, sex, and cognitive impairment. However, although recruitment of their healthy controls was not detailed, our HA subjects were more normal. Furthermore, their study did not control for the increased total burden of WMHs in AD, potentially accounting for the discordant findings of our analysis.
There are several possible hypotheses regarding the common pattern of WMH distribution across disease groups. Whereas our subject groups were selected for their presumed distinct pathologic mechanisms of WM damage, it is possible that these processes converge to cause a common pattern of WMHs, perhaps by altering cerebral perfusion. An alternative possibility is that particular brain regions, such as the frontal and posterior horns of the lateral ventricles, are predisposed to WMHs by regional properties, such as normally lower or more easily compromised regional perfusion. This possibility is supported by the present study, in which a strong inverse correlation between WMH frequency and normal, atlas-derived perfusion values was demonstrated.
In CAA subjects, WMHs present in normally better-perfused regions of WM presumably reflect CAA-related small-vessel dysfunction. The basis for increased WMHs in normally well-perfused WM in AD/MCI is less clear. Although some AD-associated WM lesions result from secondary degenerative changes,30,31 the role of vascular processes in AD is increasingly recognized.32,33 All risk factors for vascular disease are also risk factors for AD,32,33 and observational studies have reported that treatments that improve cerebral perfusion may reduce AD risk or progression.34,35 Interestingly, O’Sullivan et al36 demonstrated the largest perfusion reductions in the periventricular area in healthy subjects with WMHs compared with those without. It is possible that the relation between WMH load and reduced perfusion in the deep WM may help to explain the presence of WMHs in normally higher-perfused regions in AD/MCI and CAA subjects.
The blood supply of the cerebral WM is unique and may contribute to regional susceptibility to damage. The major cerebral arteries give off long, penetrating arteries that pierce the cortex and travel deep into the WM. These vessels do not undergo arborization to form a complex branching network but rather give off small, perpendicular arteries that supply cylindrical WM regions.37,38 The periventricular WM is primarily supplied by branches of the subependymal arteries that arise from the ventriculostriate arteries.38 Anastomoses between these vessels and the penetrating arteries from the cortical surface are either very rare or completely nonexistent.39 Periventricular WM therefore constitutes a watershed territory particularly susceptible to ischemic events resulting from either local or systemic variations in circulation. A likely cause of diminished blood flow with aging is arteriosclerosis; however, increasing age also leads to increased tortuosity and lengthening of these vessels, which may contribute to hypoperfusion.40
The SPECT atlas used for these analyses was intentionally derived from healthy younger subjects rather than from WMH study subjects. The rationale for this choice was to explore the healthy baseline environment in which WM damage eventually occurs. Conversely, in perfusion studies of older subjects,41,42 it is unclear whether the observed changes in perfusion occur before WMH development and contribute to their pathogenesis or whether they occur after WMHs, therefore resulting from associated tissue damage. We therefore derived our atlas from subjects who were <50 years of age, in whom we would expect few incidental WMH lesions, to examine how normal regional perfusion variability relates to WMH distribution.
The cross-sectional nature of the present work prohibited direct observation of the accumulation and evolution of WMHs in the context of normal perfusion patterns, as noted earlier. Although our study sought to answer a different question than studies acquiring in vivo perfusion, such data would have enabled additional analyses, such as between actual and atlas-derived perfusion patterns. In this retrospective study, differences existed in the data acquisition parameters for the MRI scans. However, we have previously demonstrated the reliability of segmentations from T2 and FLAIR images.25 Furthermore, we attempted to minimize these effects by applying a strict manual segmentation algorithm, performed by a single individual (M.E.G.), to ensure consistency in WMH identification. Our study focused on WM damage visible on structural MRI scans, but significant WM damage beyond detected lesions has been found on diffusion-weighted MRI.43 Future studies should compare the distribution of focal and diffuse damage in the context of normal perfusion. Finally, WM perfusion is one third that of gray matter, and this limits the sensitivity of perfusion methods. However, there was significant variance in our atlas to examine relative regional differences.
The present study raises the possibility that regional susceptibility may be a stronger determinant of WMH occurrence than the underlying disease process. Future studies should address whether regional WM vulnerability results from increased occurrence of damage or diminished tissue repair capacity in these regions, both of which may be modulated by the level of perfusion. Given the increasing focus on cognitive and neurologic effects of WMHs,44-46 another key area for study will be the relation between regional WM vulnerability and the anatomic connections by which WM tracts participate in higher cortical function.
Summary
The results of this exploratory, retrospective study suggest that regional variability in the normal pattern of cerebral perfusion influences the distribution of WMHs.
Acknowledgments
The authors thank Drs Anand Viswanathan and Arnaud Charil for critical reading of the manuscript.
Sources of Funding This work was funded by National Institutes of Health grants F30 NS049808 (C.M.H.), R01 AG026484 (S.M.G.), K24 NS056207 (S.M.G.), P01 AG04953 (R.J.K., D.B., M.S.A., C.R.G.G.), and P41 RR13218-01 (C.R.G.G.) and the Harvard Center for Neurodegeneration and Repair (C.M.H.).
Footnotes
Disclosures None.
References
- 1.Guttmann CR, Jolesz FA, Kikinis R, Killiany RJ, Moss MB, Sandor T, Albert MS. White matter changes with normal aging. Neurology. 1998;50:972–978. doi: 10.1212/wnl.50.4.972. [DOI] [PubMed] [Google Scholar]
- 2.Meyer JS, Kawamura J, Terayama Y. White matter lesions in the elderly. J Neurol Sci. 1992;110:1–7. doi: 10.1016/0022-510x(92)90002-3. [DOI] [PubMed] [Google Scholar]
- 3.Schmidt R, Schmidt H, Kapeller P, Enzinger C, Ropele S, Saurugg R, Fazekas F. The natural course of MRI white matter hyperintensities. J Neurol Sci. 2002;203(204):253–257. doi: 10.1016/s0022-510x(02)00300-3. [DOI] [PubMed] [Google Scholar]
- 4.Breteler MM, van Swieten JC, Bots ML, Grobbee DE, Claus JJ, van den Hout JH, van Harskamp F, Tanghe HL, de Jong PT, van Gijn J, et al. Cerebral white matter lesions, vascular risk factors, and cognitive function in a population-based study: the Rotterdam Study. Neurology. 1994;44:1246–1252. doi: 10.1212/wnl.44.7.1246. [DOI] [PubMed] [Google Scholar]
- 5.Burton EJ, McKeith IG, Burn DJ, Firbank MJ, O’Brien JT. Progression of white matter hyperintensities in Alzheimer disease, dementia with Lewy bodies, and Parkinson disease dementia: a comparison with normal aging. Am J Geriatr Psychiatry. 2006;14:842–849. doi: 10.1097/01.JGP.0000236596.56982.1c. [DOI] [PubMed] [Google Scholar]
- 6.Chen YF, Wang H, Chu Y, Huang YC, Su MY. Regional quantification of white matter hyperintensity in normal aging, mild cognitive impairment, and Alzheimer’s disease. Dement Geriatr Cogn Disord. 2006;22:177–184. doi: 10.1159/000094785. [DOI] [PubMed] [Google Scholar]
- 7.Gootjes L, Teipel SJ, Zebuhr Y, Schwarz R, Leinsinger G, Scheltens P, Moller HJ, Hampel H. Regional distribution of white matter hyperintensities in vascular dementia, Alzheimer’s disease and healthy aging. Dement Geriatr Cogn Disord. 2004;18:180–188. doi: 10.1159/000079199. [DOI] [PubMed] [Google Scholar]
- 8.Yoshita M, Fletcher E, Harvey D, Ortega M, Martinez O, Mungas DM, Reed BR, DeCarli CS. Extent and distribution of white matter hyperintensities in normal aging, MCI, and AD. Neurology. 2006;67:2192–2198. doi: 10.1212/01.wnl.0000249119.95747.1f. [DOI] [PMC free article] [PubMed] [Google Scholar]
- 9.Lucchinetti C, Bruck W, Parisi J, Scheithauer B, Rodriguez M, Lassmann H. Heterogeneity of multiple sclerosis lesions: implications for the pathogenesis of demyelination. Ann Neurol. 2000;47:707–717. doi: 10.1002/1531-8249(200006)47:6<707::aid-ana3>3.0.co;2-q. [DOI] [PubMed] [Google Scholar]
- 10.Scheltens P, Barkhof F, Leys D, Wolters EC, Ravid R, Kamphorst W. Histopathologic correlates of white matter changes on MRI in Alzheimer’s disease and normal aging. Neurology. 1995;45:883–888. doi: 10.1212/wnl.45.5.883. [DOI] [PubMed] [Google Scholar]
- 11.Haglund M, Englund E. Cerebral amyloid angiopathy, white matter lesions and Alzheimer encephalopathy—a histopathological assessment. Dement Geriatr Cogn Disord. 2002;14:161–166. doi: 10.1159/000063606. [DOI] [PubMed] [Google Scholar]
- 12.Fazekas F, Ropele S, Enzinger C, Gorani F, Seewann A, Petrovic K, Schmidt R. MTI of white matter hyperintensities. Brain. 2005;128:2926–2932. doi: 10.1093/brain/awh567. [DOI] [PubMed] [Google Scholar]
- 13.Spilt A, Goekoop R, Westendorp RG, Blauw GJ, de Craen AJ, van Buchem MA. Not all age-related white matter hyperintensities are the same: a magnetization transfer imaging study. AJNR Am J Neuroradiol. 2006;27:1964–1968. [PMC free article] [PubMed] [Google Scholar]
- 14.DeCarli C, Miller BL, Swan GE, Reed T, Wolf PA, Carmelli D. Cerebrovascular and brain morphologic correlates of mild cognitive impairment in the National Heart, Lung, and Blood Institute Twin Study. Arch Neurol. 2001;58:643–647. doi: 10.1001/archneur.58.4.643. [DOI] [PubMed] [Google Scholar]
- 15.Jeerakathil T, Wolf PA, Beiser A, Massaro J, Seshadri S, D’Agostino RB, DeCarli C. Stroke risk profile predicts white matter hyperintensity volume: the Framingham Study. Stroke. 2004;35:1857–1861. doi: 10.1161/01.STR.0000135226.53499.85. [DOI] [PubMed] [Google Scholar]
- 16.Ovbiagele B, Saver JL. Cerebral white matter hyperintensities on MRI: current concepts and therapeutic implications. Cerebrovasc Dis. 2006;22:83–90. doi: 10.1159/000093235. [DOI] [PubMed] [Google Scholar]
- 17.Zhang-Nunes SX, Maat-Schieman ML, van Duinen SG, Roos RA, Frosch MP, Greenberg SM. The cerebral β-amyloid angiopathies: hereditary and sporadic. Brain Pathol. 2006;16:30–39. doi: 10.1111/j.1750-3639.2006.tb00559.x. [DOI] [PMC free article] [PubMed] [Google Scholar]
- 18.Gray F, Dubas F, Roullet E, Escourolle R. Leukoencephalopathy in diffuse hemorrhagic cerebral amyloid angiopathy. Ann Neurol. 1985;18:54–59. doi: 10.1002/ana.410180110. [DOI] [PubMed] [Google Scholar]
- 19.Gurol ME, Irizarry MC, Smith EE, Raju S, Diaz-Arrastia R, Bottiglieri T, Rosand J, Growdon JH, Greenberg SM. Plasma β-amyloid and white matter lesions in AD, MCI, and cerebral amyloid angiopathy. Neurology. 2006;66:23–29. doi: 10.1212/01.wnl.0000191403.95453.6a. [DOI] [PubMed] [Google Scholar]
- 20.McKhann G, Drachman D, Folstein M, Katzman R, Price D, Stadlan EM. Clinical diagnosis of Alzheimer’s disease: report of the NINCDS-ADRDA work group under the auspices of Department of Health and Human Services task force on Alzheimer’s disease. Neurology. 1984;34:939–944. doi: 10.1212/wnl.34.7.939. [DOI] [PubMed] [Google Scholar]
- 21.Petersen RC, Stevens JC, Ganguli M, Tangalos EG, Cummings JL, DeKosky ST. Practice parameter: early detection of dementia:mild cognitive impairment (an evidence-based review): report of the quality standards subcommittee of the American Academy of Neurology. Neurology. 2001;56:1133–1142. doi: 10.1212/wnl.56.9.1133. [DOI] [PubMed] [Google Scholar]
- 22.Knudsen KA, Rosand J, Karluk D, Greenberg SM. Clinical diagnosis of cerebral amyloid angiopathy: validation of the Boston criteria. Neurology. 2001;56:537–539. doi: 10.1212/wnl.56.4.537. [DOI] [PubMed] [Google Scholar]
- 23.Morris JC. The clinical dementia rating (CDR): current version and scoring rules. Neurology. 1993;43:2412–2414. doi: 10.1212/wnl.43.11.2412-a. [DOI] [PubMed] [Google Scholar]
- 24.Daly E, Zaitchik D, Copeland M, Schmahmann J, Gunther J, Albert M. Predicting conversion to Alzheimer disease using standardized clinical information. Arch Neurol. 2000;57:675–680. doi: 10.1001/archneur.57.5.675. [DOI] [PubMed] [Google Scholar]
- 25.Chen YW, Gurol ME, Rosand J, Viswanathan A, Rakich SM, Groover TR, Greenberg SM, Smith EE. Progression of white matter lesions and hemorrhages in cerebral amyloid angiopathy. Neurology. 2006;67:83–87. doi: 10.1212/01.wnl.0000223613.57229.24. [DOI] [PMC free article] [PubMed] [Google Scholar]
- 26.Evans AC, Collins DL, Mills SR, Brown ED, Kelly RL, Peters TM. 3D statistical neuroanatomical models from 305 MRI volumes. Proc IEEE Nucl Science Symp Med Imag Conf. 1994;3:1813–1817. [Google Scholar]
- 27.Jenkinson M, Bannister P, Brady M, Smith S. Improved optimization for the robust and accurate linear registration and motion correction of brain images. Neuroimage. 2002;17:825–841. doi: 10.1016/s1053-8119(02)91132-8. [DOI] [PubMed] [Google Scholar]
- 28.Rosand J, Muzikansky A, Kumar A, Wisco JJ, Smith EE, Betensky RA, Greenberg SM. Spatial clustering of hemorrhages in probable cerebral amyloid angiopathy. Ann Neurol. 2005;58:459–462. doi: 10.1002/ana.20596. [DOI] [PubMed] [Google Scholar]
- 29.Vinters HV, Gilbert JJ. Cerebral amyloid angiopathy: incidence and complications in the aging brain, II: the distribution of amyloid vascular changes. Stroke. 1983;14:924–928. doi: 10.1161/01.str.14.6.924. [DOI] [PubMed] [Google Scholar]
- 30.Fazekas F, Kapeller P, Schmidt R, Offenbacher H, Payer F, Fazekas G. The relation of cerebral magnetic resonance signal hyperintensities to Alzheimer’s disease. J Neurol Sci. 1996;142:121–125. doi: 10.1016/0022-510x(96)00169-4. [DOI] [PubMed] [Google Scholar]
- 31.Roher AE, Kuo YM, Esh C, Knebel C, Weiss N, Kalback W, Luehrs DC, Childress JL, Beach TG, Weller RO, Kokjohn TA. Cortical and leptomeningeal cerebrovascular amyloid and white matter pathology in Alzheimer’s disease. Mol Med. 2003;9:112–122. [PMC free article] [PubMed] [Google Scholar]
- 32.Breteler MM. Vascular risk factors for Alzheimer’s disease: an epidemiologic perspective. Neurobiol Aging. 2000;21:153–160. doi: 10.1016/s0197-4580(99)00110-4. [DOI] [PubMed] [Google Scholar]
- 33.de la Torre JC. Alzheimer disease as a vascular disorder: nosological evidence. Stroke. 2002;33:1152–1162. doi: 10.1161/01.str.0000014421.15948.67. [DOI] [PubMed] [Google Scholar]
- 34.Guo Z, Fratiglioni L, Zhu L, Fastbom J, Winblad B, Viitanen M. Occurrence and progression of dementia in a community population aged 75 years and older: relationship of antihypertensive medication use. Arch Neurol. 1999;56:991–996. doi: 10.1001/archneur.56.8.991. [DOI] [PubMed] [Google Scholar]
- 35.Hanon O, Pequignot R, Seux ML, Lenoir H, Bune A, Rigaud AS, Forette F, Girerd X. Relationship between antihypertensive drug therapy and cognitive function in elderly hypertensive patients with memory complaints. J Hypertens. 2006;24:2101–2107. doi: 10.1097/01.hjh.0000244961.69985.05. [DOI] [PubMed] [Google Scholar]
- 36.O’Sullivan M, Lythgoe DJ, Pereira AC, Summers PE, Jarosz JM, Williams SC, Markus HS. Patterns of cerebral blood flow reduction in patients with ischemic leukoaraiosis. Neurology. 2002;59:321–326. doi: 10.1212/wnl.59.3.321. [DOI] [PubMed] [Google Scholar]
- 37.Pantoni L, Garcia JH. Pathogenesis of leukoaraiosis: a review. Stroke. 1997;28:652–659. doi: 10.1161/01.str.28.3.652. [DOI] [PubMed] [Google Scholar]
- 38.Rowbotham GF, Little E. Circulations of the cerebral hemispheres. Br J Surg. 1965;52:8–21. doi: 10.1002/bjs.1800520104. [DOI] [PubMed] [Google Scholar]
- 39.De Reuck J. The human periventricular arterial blood supply and the anatomy of cerebral infarctions. Eur Neurol. 1971;5:321–334. doi: 10.1159/000114088. [DOI] [PubMed] [Google Scholar]
- 40.Spangler KM, Challa VR, Moody DM, Bell MA. Arteriolar tortuosity of the white matter in aging and hypertension: a microradiographic study. J Neuropathol Exp Neurol. 1994;53:22–26. doi: 10.1097/00005072-199401000-00003. [DOI] [PubMed] [Google Scholar]
- 41.Marstrand JR, Garde E, Rostrup E, Ring P, Rosenbaum S, Mortensen EL, Larsson HB. Cerebral perfusion and cerebrovascular reactivity are reduced in white matter hyperintensities. Stroke. 2002;33:972–976. doi: 10.1161/01.str.0000012808.81667.4b. [DOI] [PubMed] [Google Scholar]
- 42.Sachdev P, Wen W, Shnier R, Brodaty H. Cerebral blood volume in T2-weighted white matter hyperintensities using exogenous contrast based perfusion MRI. J Neuropsychiatry Clin Neurosci. 2004;16:83–92. doi: 10.1176/jnp.16.1.83. [DOI] [PubMed] [Google Scholar]
- 43.Salat DH, Smith EE, Tuch DS, Benner T, Pappu V, Schwab KM, Gurol ME, Rosas HD, Rosand J, Greenberg SM. White matter alterations in cerebral amyloid angiopathy measured by diffusion tensor imaging. Stroke. 2006;37:1759–1764. doi: 10.1161/01.STR.0000227328.86353.a7. [DOI] [PubMed] [Google Scholar]
- 44.Burton EJ, Kenny RA, O’Brien J, Stephens S, Bradbury M, Rowan E, Kalaria R, Firbank M, Wesnes K, Ballard C. White matter hyperintensities are associated with impairment of memory, attention, and global cognitive performance in older stroke patients. Stroke. 2004;35:1270–1275. doi: 10.1161/01.STR.0000126041.99024.86. [DOI] [PubMed] [Google Scholar]
- 45.Tullberg M, Fletcher E, DeCarli C, Mungas D, Reed BR, Harvey DJ, Weiner MW, Chui HC, Jagust WJ. White matter lesions impair frontal lobe function regardless of their location. Neurology. 2004;63:246–253. doi: 10.1212/01.wnl.0000130530.55104.b5. [DOI] [PMC free article] [PubMed] [Google Scholar]
- 46.van den Heuvel DM, ten Dam VH, de Craen AJ, Admiraal-Behloul F, Olofsen H, Bollen EL, Jolles J, Murray HM, Blauw GJ, Westendorp RG, van Buchem MA. Increase in periventricular white matter hyperintensities parallels decline in mental processing speed in a non-demented elderly population. J Neurol Neurosurg Psychiatry. 2006;77:149–153. doi: 10.1136/jnnp.2005.070193. [DOI] [PMC free article] [PubMed] [Google Scholar]