

Abstract
The CYP1A1, CYP1A2, and CYP1B1 enzymes are inducible by benzo[a]pyrene (BaP) and 2,3,7,8-tetrachlorodibenzo-p-dioxin (TCDD); metabolism of BaP by these enzymes leads to electrophilic intermediates and genotoxicity. Throughout the gastrointestinal (GI) tract, we systematically compared basal and inducible levels of the CYP1 mRNAs by Q-PCR, and localized the CYP1 proteins by immunohistochemistry. Cyp1(+/+) wild-type were compared with the Cyp1a1(−/−), Cyp1a2(−/−), and Cyp1b1(−/−) single-knockout and Cyp1a1/1b1(−/−) and Cyp1a2/1b1(−/−) double-knockout mice. Oral BaP was compared with intraperitoneal TCDD. In general, maximal CYP1A1 mRNA levels were 3-10 times greater than CYP1B1, which were 3-10 times greater than CYP1A2 mRNA levels. Highest inducible concentrations of CYP1A1 and CYP1A2 occurred in proximal small intestine, whereas the highest basal and inducible levels of CYP1B1 mRNA occurred in esophagus, forestomach, and glandular stomach. Ablation of either Cyp1a2 or Cyp1b1 gene resulted in a compensatory increase in CYP1A1 mRNA — but only in small intestine. Also in small intestine, although BaP- and TCDD-mediated CYP1A1 inductions were roughly equivalent, oral BaP-mediated CYP1A2 mRNA induction was ∼40-fold greater than TCDD-mediated CYP1A2 induction. CYP1B1 induction by TCDD in Cyp1(+/+) and Cyp1a2(−/−) mice was 4–5 times higher than that by BaP; however, in Cyp1a1(−/−) animals CYP1B1 induction by TCDD or BaP was approximately equivalent. CYP1A1 and CYP1A2 proteins were generally localized nearer to the lumen than CYP1B1 proteins, in both squamous and glandular epithelial cells. These GI tract data suggest that the inducible CYP1A1 enzyme, both in concentration and in location, might act as a “shield” in detoxifying oral BaP and, hence, protecting the animal.
Keywords: CYP1A1, CYP1A2, CYP1B1, Q-PCR, Immunohistochemistry, Tongue, Esophagus, Stomach, Duodenum, Jejunum, Colon, Benzo[a]pyrene, 2, 3, 7, 8-Tetrachlorodibenzo-p-dioxin
Introduction
The human and mouse cytochrome P450 (CYP) gene super-families contain 57 and 102 protein-coding genes, respectively [20]. CYP proteins are heme-thiolate enzymes involved in innumerable cellular functions such as eicosanoid metabolism, cholesterol and bile acid biosynthesis, steroid synthesis and metabolism, biogenic amine synthesis and degradation, vitamin D3 synthesis and metabolism, and hydroxylation of retinoic acid and presumably other morphogens. A handful of CYP enzymes remain that still have no known unequivocal functions [19,20]. Environmental procarcinogens and toxicants are metabolized largely by enzymes in the CYP1, CYP2, CYP3, and CYP4 families.
Among the 18 mammalian CYP families, the CYP1 family comprises three orthologous members in human and mouse: CYP1A1, CYP1A2, and CYP1B1. The three CYP1 genes are up-regulated via the aryl hydrocarbon receptor (AHR), which binds as a heterodimer with the AHR nuclear transporter (ARNT) to DNA motifs known as AHR response elements [17,19,20]. CYP1 inducers usually are ligands that activate the AHR, thereby causing the receptor to move from cytosol to the nucleus [28]; these ligands include benzo[a]pyrene (BaP) and 2,3,7,8-tetrachlorodibenzo-p-dioxin (TCDD) [16,17].
BaP is the prototype of numerous polycyclic aromatic hydrocarbons (PAHs), which enter the environment most often as the result of combustion processes. Most of the AHR ligands are CYP1 substrates. BaP is readily metabolized by CYP1A1 and CYP1B1, and thus a single dose can be cleared within a few days—resulting in CYP1 induction followed by de-induction. On the contrary, TCDD is much more potent than BaP as an AHR ligand and inducer of CYP1; this potency of induction occurs primarily because TCDD is only negligibly metabolized, allowing for a half-life of months or years in certain cell types and tissues of the animal [16]. Environmental mixtures of PAHs contain some molecules that are easily metabolized and others that are virtually unable to be metabolized. Thus, in the present study we chose to compare the effects of oral (po) BaP with intraperitoneal (ip) TCDD throughout the gastrointestinal (GI) tract; intriguingly, dramatic differences were found.
CYP1A1 in the liver and GI tract has a striking ability to detoxify oral BaP, whereas it appears that CYP1B1 in bone marrow and immune system behaves in the opposite manner [29,30]. Because human exposure to most PAHs is by way of the GI tract, it is imperative to understand the expression of both CYP1A1 and CYP1B1 in the GI tract. Insofar as we know that CYP1A2 levels can impact the expression of the other CYP1s [30], we chose to include CYP1A2 in this study.
The Cyp1a1(−/−) [5], Cyp1a2(−/−) [13], and Cyp1b1(−/−) [4] single-knockout and Cyp1a1/1b1(−/−) and Cyp1a2/1b1(−/−) double-knockout mouse lines [30] have been generated and used in toxicity studies. The present study focuses on the mouse GI tract. Herein, we test the hypothesis that CYP1A1 throughout the GI tract might be interposed between the environment and the organism. Is this true? If not, where does this rule not hold? Further, is CYP1B1 in the same tissue or cell types as CYP1A1, or do PAHs reach CYP1B1 only after getting beyond the CYP1A1 shield? Following po BaP or ip TCDD, which portions of the GI tract contain inducible CYP1, and to what extent? Are there differences in the CYP1 inducibility profile between BaP and TCDD? Do any of the CYP1 members show substantial constitutive expression in the GI tract? Which portions of the GI tract are highest, and which lowest, for CYP1 expression? By quantifying CYP1 mRNA levels, do these accurately reflect CYP1 protein levels? The present study addresses these questions: we have quantified mRNA concentrations by means of quantitative-polymerase chain reaction (Q-PCR); we have determined the location of CYP1 enzymes within the GI tract and cell type via immunohistochemistry (IHC). Histological sections were prepared from the entire GI tract—from tongue to colon. We have compared wild-type Cyp1(+/+) versus the Cyp1a1(−/−), Cyp1a2(−/−), and Cyp1b1(−/−) single-knockouts and versus the Cyp1a1/1b1(−/−) and Cyp1a2/1b1(−/−) double-knockouts; ablation of a gene so that its mRNA and protein are unequivocally zero serves as a valuable negative control in this study.
Materials and methods
Chemicals
BaP was purchased from Sigma (St. Louis, MO). TCDD was bought from Accustandard, Inc. (New Haven, CT). All other chemicals and reagents were procured from either Aldrich Chemical Company (Milwaukee, WI) or Sigma Chemical Company as the highest available grades.
Animals
Development of the Cyp1a1(−/−) [5], Cyp1a2(−/−) [13], and Cyp1b1(−/−) [4] single-knockout lines and the Cyp1a1/1b1(−/−) and Cyp1a2/1b1(−/−) double-knockout lines [30] has been described. The Cyp1a1/1a2(−/−) double-knockout has recently been produced via Cre-mediated interchromosomal excision [6]; however, this line was not yet available at the time of the present study. All five knockout genotypes have been back-crossed into the C57BL/6J background for at least eight generations; this ensures that the knockout genotype resides in a genetic background that is >99.8% C57BL/6J [18]. Age-matched C57BL/6J Cyp1(+/+) wild-type mice from The Jackson Laboratory (Bar Harbor, ME) can therefore be used as comparable controls. All experiments with these six genotypes were carried out in males and begun at 6±1 weeks of age. All animal experiments were approved by, and conducted in accordance with, the National Institutes of Health standards for the care and use of experimental animals and the University Cincinnati Medical Center Institutional Animal Care and Use Committee.
Biohazard precaution
BaP and TCDD are highly toxic chemicals and likely human carcinogens. All personnel were instructed in safe handling procedures. Lab coats, gloves, and masks were worn at all times, and contaminated materials were collected separately for disposal by the Hazardous Waste Unit or by independent contractors. BaP- and TCDD-treated mice were housed separately, and their carcasses regarded as contaminated biological materials.
Treatment and tissue isolation
BaP (100 mg/kg ip) was sometimes given as a single dose 48 h before sacrifice. For oral administration, BaP (10 mg/ml) was dissolved in corn oil. The lab rodent chow (Harlan Teklad; Madison, WI) was soaked in the BaP-laced corn oil for at least 24 h before presentation to mice that had been without food (but with water) overnight; this po BaP dose has been estimated as 125 mg/kg body weight per day and in the present study it was given for 5 days [21,29]. TCDD in corn oil was given ip (15 μg/kg) as a single dose 48 h before sacrifice. For oral administration, TCDD (1.5 μg/kg) was sometimes given by gavage 48 h before sacrifice. Untreated mice received identical amounts of corn oil—either ip or po. We first determined that BaP- vs TCDD-mediated induction was maximal in the GI tract at these doses and times of administration.
Tissues were removed between 9:00 AM and 10:00 AM to exclude any circadian rhythm effects. Tissues included tongue, esophagus, forestomach, glandular stomach, proximal small intestine (first 3 cm beyond the pyloric junction—containing the entire duodenum and portion of jejunum), ileum, and colon. Because data from ileum and colon provided no additional unusual findings, compared with that seen in other tissues, the ileum and colon samples are not described in as much detail. These seven tissues were collected from groups (N=3) of the six genotypes—for mRNA quantitation and for IHC—from ip versus po corn oil-treated, ip versus po BaP-treated, and ip versus po TCDD-treated mice. Experiments were carried out twice, to ensure reproducibility.
Total RNA preparation
Total RNA was isolated (seven tissues; total of 216 mice) using the RNAgents Total RNA Isolation System (Promega, WI).
Reverse transcription
Total RNA (2 μg) was added to a reaction containing 3.8 μM oligo(dT)20 and 0.77 mM dNTP—to a final volume of 13 μl. Reactions were incubated 65°C for 5 min and then 4°C for 2 min. To the reaction mixture we added 7 μl of solution containing 14 mM dithiothreitol, 40 units RNaseOUT Recombinant RNase inhibitor (Invitrogen; CA), and 200 units SuperScript III (Invitrogen). Reactions were incubated 50°C for 50 min, followed by 75°C for 10 min (to inactivate the reverse transcriptase). Distilled water (80 μl) was added to the isolated cDNA; these samples were then stored at −80°C until use.
CYP1 mRNA copy numbers
The mRNAs from each of the three Cyp1 genes were quantified by fitting RT-PCR data to a curve generated from cloned RNAs (cRNAs) for each CYP1. Briefly, templates for cRNA synthesis were produced by PCR on cDNA constructs from each CYP1 cDNA that had been cloned into pcDNA3.1(+) (Invitrogen). PCR was performed, using a forward primer including T7 promoter sequence and a reverse primer having an oligo(dT) that followed the stop codon. The amplified products were purified by electrophoresis. In vitro transcription was performed using the T7 RiboMAX Express Large-Scale RNA Production System (Promega). After DNaseI treatment, the cRNAs were spectrophotometrically quantified. The cRNAs were used to generate a standard curve in real-time (RT)-PCR from which mRNA copy number from RT-RNA measurements (see below) could be extrapolated.
Real-time quantitative PCR (Q-PCR)
We used the primers listed below. Q-PCR was performed in the ABI PRISM 7000 Sequence Detection System (Applied Biosystems), using SYBR Premix EX Taq (Takaro Bio, Inc.; Shiga, Japan). Individual CYP1 mRNA abundance was determined, using the standard-curve method (from 101 to 108 copies/μl), as previously described by K. Livak (PE-ABI; Sequence Detector User; Bulletin 2) [33]. Each sample was normalized to glyceraldehyde-3-phosphate dehydrogenase mRNA.
| Gene | Forward primer | Reverse primer |
| Cyp1a1 | CCTCATGTACCTGGTAACCA | AAGGATGAATGCCGGAAGGT |
| Cyp1a2 | AAGACAATGGCGGTCTCATC | GACGGTCAGAAAGCCGTGGT |
| Cyp1b1 | ACATCCCCAAGAATACGGTC | TAGACAGTTCCTCACCGATG |
| Gapdh | TGCACCACCAACTGCTTAG | GATGCAGGGATGATGTTC |
Microsomal protein immunoblots
Microsomes (S9 fraction) from small intestine (3 cm extending distally from the pylorus) were prepared as previously described [29,30]. Protein concentrations were determined using the Bio-Rad protein reagent (Bio-Rad; Hercules, CA). Microsomal proteins were separated on sodium dodecyl sulfate (0.1%)-polyacrylamide (10%) minigels. Separated proteins were transferred to nitrocellulose and visualized with Ponceau S to verify equivalent loading across lanes. Western blot analysis was performed using primary rabbit polyclonal anti-rat CYP1A antibody (1:500; Daiichi Pharmaceuticals Co., Ltd.; Tokyo); this antibody recognizes both mouse CYP1A1 and CYP1A2 proteins. We also used a rabbit polyclonal anti-mouse CYP1B1 antibody that had been developed in our laboratory in collaboration with Alpha Diagnostic International (1:125; San Antonio, TX); this antibody recognizes mouse CYP1B1 protein better than three other antibodies we have tested [6]. The amino acid sequences used to make the peptide immunogen for the anti-CYP1B1 antibody were a combination of 301EKKASGAPGDDSSG312, 437PEDFDPARFLDKDGF451, and 491CNFKANQNESSNMS504; to the first two peptides, a cysteine residue was added at the N-terminus, as suggested by Alpha Diagnostic International to improve its immunogenicity, whereas the third peptide already had a natural cysteine residue at the N-terminus. Alkaline phosphatase-conjugated secondary antibodies (Kirkegaard Perry Lab., Gaithersburg, MD) and the Alkaline Phosphatase Conjugate Substrate Kit (Bio-Rad Lab., Hercules, CA) were used for visualization; exposure times ranged from 5 to 15 min.
Immunohistochemistry
At sacrifice, the seven GI tract tissues (listed above) were harvested, washed in phosphate-buffered saline, and then placed for 6–8 h in 4% paraformaldehyde. Following dehydration, the tissues were embedded in paraffin. Sections were cut at 5 μm, deparaffinized, rehydrated, and then incubated with 1% H2O2 for 30 min. With regard to IHC for all three CYP1 proteins, the tissue sections were blocked overnight at 4°C. The tissue sections were then placed for 2 h at room temperature with the primary antibody, rabbit polyclonal anti-rat CYP1A antibody. After the slides were washed, they were incubated with goat anti-rabbit IgG or goat anti-rabbit IgG-HRP (1:100; Dako; Carpinteria, CA) for 45 min at room temperature, and the reaction was detected using the AEC substrate kit for peroxidase (Vector). The same procedures were carried out with our rabbit polyclonal anti-mouse CYP1B1 antibody.
Finally, all sections were counterstained lightly with hematoxylin, and the sections were photographed at several magnifications, using a NIKON microscope with a SPOT 1 camera. For each antibody, images from each genotype, treatment, tissue, and animal (replicates of three mice) were made. The most representative image possible was selected and, from these, image panels were constructed (tissue type, genotype, treatment), in order to compare the intensity and distribution of the CYP1 protein. For the final figures, images were adjusted for contrast and brightness. Although the anti-CYP1A1/1A2 recognized both CYP1A proteins, the localization of induced CYP1A1 was easily assessed in Cyp1a2(−/−) and the Cyp1a2/1b1(−/−) double-knockout mice; likewise, the location of basal and induced CYP1A2 was easily determined in Cyp1a1(−/−) and Cyp1a1/1b1(−/−) mice.
Statistical analysis
Statistical significance between groups was determined by analysis of variance among groups and Student's t test between groups. All assays were performed in duplicate or triplicate, and repeated at least twice. Statistical analyses were also performed with the use of SAS statistical software (SAS Institute Inc.; Cary, NC) and Sigma Plot (Systat Software, Inc.; Point Richmond, CA).
Results
Comparison of ip vs po BaP, TCDD
Combustion processes form PAHs, as well as small amounts of TCDD and other dioxin-like compounds. Mixtures of PAHs notoriously comprise both chemicals that are easily metabolized and chemicals that are extremely resistant to metabolism. Thus, our reason for examining the effects of BaP and TCDD separately was to see whether important differences between BaP and TCDD might exist; as demonstrated below, we encountered some striking and unexpectedly large differences.
When ip and po BaP treatments were compared, inducible levels of CYP1 mRNAs were at least two times higher throughout the GI tract after oral BaP than after ip BaP. When ip vs po TCDD treatment was compared, however, inducible levels of CYP1 mRNAs in the GI tract were essentially the same whether it was ip or po TCDD (data not shown). These findings likely reflect the lower potency of BaP as a CYP1 inducer due to the ease of BaP being metabolized, compared with the much higher potency of TCDD as a CYP1 inducer—due to only negligible metabolism of TCDD. For the remainder of this study, and consistent with other ongoing projects in our laboratory [29,30], we therefore chose to focus on the comparison of oral BaP with ip TCDD treatment; these two routes of administration, these two CYP1 inducers, and the three Cyp1 gene products compose the remaining experiments in this study.
CYP1A1 mRNA levels throughout the GI tract
The method by which we used Q-PCR is extremely precise and quantitative. In the Cyp1(+/+) wild-type mouse (Fig. 1a), oral BaP was 4 times more effective at inducing CYP1A1 mRNA in the proximal small intestine as compared with that in esophagus: about 11×107 molecules versus 2.5×10⁷ molecules of mRNA/μg of total RNA, respectively. CYP1A1 mRNA amounts were ∼2.0×10⁷ copies in forestomach and colon and < 1×10⁷ copies in tongue and glandular stomach. In contrast, TCDD-induced CYP1A1 mRNA was between 8 and 9×10⁷ molecules in esophagus, forestomach, glandular stomach, small intestine, and colon, and about 1×10⁷ molecules in tongue.
Fig. 1.
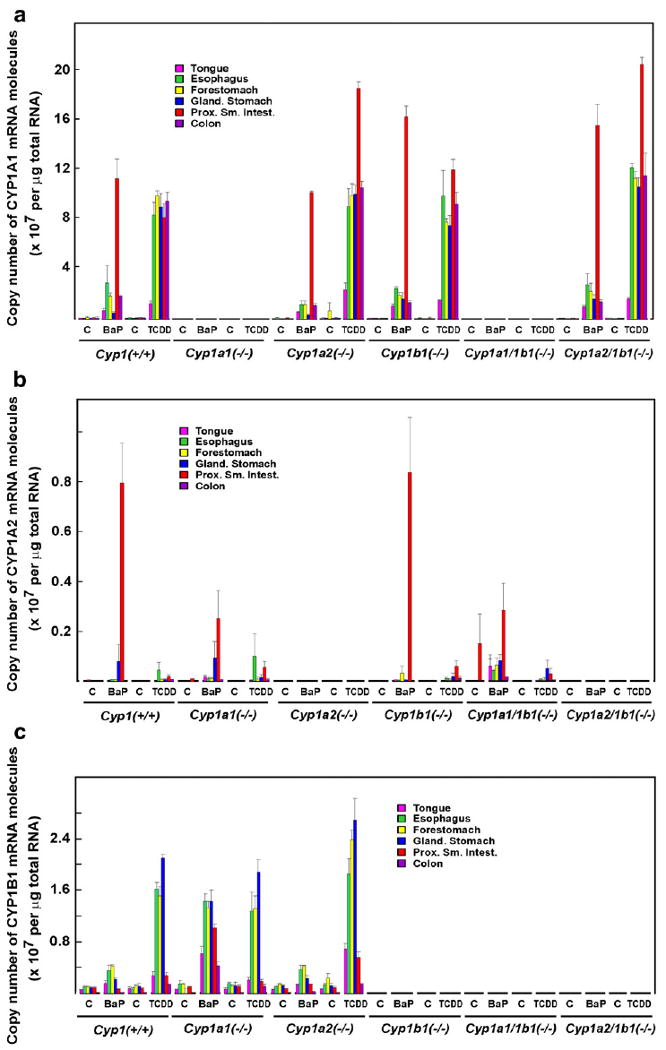
Quantification of transcripts. (a) CYP1A1 mRNA levels in tongue, esophagus, forestomach, glandular stomach, small intestine, and colon. (b) CYP1A2 mRNA levels in these same tissues. (c) CYP1B1 mRNA levels in these same tissues. Across the bottom of all three panels, “C” to the left of “BaP” denotes po corn oil for 5 days as control, and “C” to the left of “TCDD” denotes ip corn oil vehicle 48 h before sacrifice. The levels of CYP1 mRNA in control mice could represent constitutive gene expression, induction by inducer molecules (plant products) in the lab chow that was given ad libitum, or a combination of the two.
The corn oil vehicle-treated control Cyp1(+/+) mice showed levels of CYP1A1 mRNA that were barely detectable, as compared with the Cyp1a1(−/−) and Cyp1a1/1b1(−/−) mice that had absolutely no detectable CYP1A1 mRNA due to the ablation of the Cyp1a1 gene. Because basal CYP1A1 expression is widely known to be nil, what levels of mRNA expression that we do see are likely to represent CYP1 inducers in the lab chow.
In the Cyp1a2(−/−) mouse (Fig. 1a), the BaP- and TCDD-inducible CYP1A1 mRNA profiles were quite similar to that of the Cyp1(+/+) wild-type, except that—in the absence of CYP1A2 in the proximal small intestine—TCDD-inducible CYP1A1 mRNA levels were doubled. Compared with that in Cyp1(+/+) mice, this effect on CYP1A1 mRNA in small intestine was also seen in BaP-treated Cyp1b1(−/−) mice and in BaP- or TCDD-treated Cyp1a2/1b1(−/−) mice. Hence, removal of either the CYP1A2 or the CYP1B1 enzyme in the proximal small intestine resulted in some type of compensatory increase of CYP1A1 mRNA. In contrast, absence of the CYP1B1 enzyme in esophagus, stomach, and colon of BaP-treated Cyp1b1(−/−) or Cyp1a2/1b1(−/−) mice, and absence of the CYP1A2 enzyme in esophagus, stomach, and colon of BaP-treated Cyp1a2(−/−) mice, caused little effect on CYP1A1 mRNA levels in these tissues.
CYP1A2 mRNA levels
In the GI tract, CYP1A2 mRNA levels (Fig. 1b) are 3–10 times less than CYP1A1 mRNA levels; however, the effects of BaP versus TCDD on CYP1A2 were the biggest surprise. In Cyp1(+/+) wild–type and in Cyp1b1(−/−) mice (i.e., in the presence of the induced CYP1A1 enzyme), oral BaP dramatically increased CYP1A2 mRNA to ∼0.8×10⁷ copies of mRNA/μg of total RNA in the proximal small intestine, compared with constitutive CYP1A2 mRNA that was below the level of detection in Cyp1(+/+) or Cyp1b1(−/−) mice. This amount of CYP1A2 mRNA induction by oral BaP easily represents a 100-fold increase. In contrast, there were∼0.2×10⁷ molecules of BaP-induced CYP1A2 mRNA/μg of total RNA in the absence of CYP1A1 [i.e., in small intestine of Cyp1a1(−/−) and Cyp1a1/1b1(−/−) mice].
CYP1A2 mRNA levels were detectable but otherwise quite unremarkable in all the other tissues of the GI tract. Interestingly, ip TCDD barely increased CYP1A2 mRNA in the proximal small intestine. Oral BaP induced CYP1A2 mRNA ∼40-fold greater than ip TCDD in small intestine; this striking difference in inducibility between BaP and TCDD was not seen elsewhere throughout the GI tract. The corn oil vehicle-treated control Cyp1(+/+) mice showed levels of CYP1A2 mRNA that were usually detectable, as compared with the Cyp1a2(−/−) and Cyp1a21/1b1(−/−) mice that had absolutely no detectable CYP1A2 mRNA due to the ablation of the Cyp1a2 gene.
CYP1B1 mRNA levels
CYP1B1 mRNA levels exhibited a considerably different profile from that of CYP1A1/1A2: CYP1B1 expression was highest in esophagus, forestomach, and glandular stomach (Fig. 1c), which contrasts with CYP1A1/1A2 mRNA that is clearly found highest in the proximal small intestine. CYP1B1 mRNA levels (Fig. 1c) are about 3–10 times less than CYP1A1 mRNA concentrations and about 3–10 times greater than CYP1A2 mRNA levels in all tissues examined (Fig. 1).
In Cyp1(+/+) wild-type and in Cyp1a2(−/−) mice, oral BaP produced no more than 2- to 3-fold induction of CYP1B1 mRNA in any part of the GI tract, relative to CYP1B1 levels in oil-treated control mice. BaP-induced CYP1B1 mRNA was between 0.1 and 0.4×10⁷ molecules per 1.0 μg of total RNA, whereas constitutive CYP1B1 levels (in all mouse lines having the Cyp1b1 gene intact) showed between 0.06 and 0.1×10⁷ copies in all six tissues of the GI tract. In contrast, po BaP in the Cyp1a1(−/−) mouse showed increases in CYP1B1 mRNA levels to 0.6 to 1.5×10⁷ molecules per 1.0 μg of total RNA—i.e., 10–15 times higher than basal CYP1B1 mRNA levels. In the absence of the Cyp1a1 gene, therefore, this apparently leads to abnormally high levels of the BaP inducer in the GI tract (presumably because of no CYP1A1 enzyme), which is then able to “superinduce” CYP1B1 mRNA levels to abnormally high levels throughout the entire GI tract.
TCDD-mediated induction of CYP1B1 mRNA—in the esophagus, forestomach, and glandular stomach—reached levels between 1.2 and 2.6×10⁷ molecules per 1.0 μg of total RNA. Curiously, ip TCDD-mediated CYP1B1 mRNA induction in small intestine was about 5–10 times less than that in esophagus or stomach. Basal CYP1B1 mRNA levels were substantial in all six tissues of the GI tract, as contrasted to Cyp1b1(−/−), Cyp1a1/1b1(−/−), or Cyp1a2/1b1(−/−) mice that have absolutely no detectable CYP1B1 mRNA due to the global absence of the Cyp1b1 gene. In summary, the basal and inducible mRNA profile of each of the three CYP1 enzymes is distinctly different from one another, and the induction profiles are strikingly different between oral BaP and ip TCDD in many parts of the GI tract.
Western immunoblot analysis of smooth intestine CYP1A1/1A2
Only in proximal small intestine did we see the strikingly greater induction of CYP1A1 mRNA by TCDD, and not as much by BaP in Cyp1a2(−/−) mice (Fig. 1a). We thus wished to confirm that this also could be extrapolated to the amount of CYP1A1 protein seen on a Western immunoblot. Fig. 2 illustrates microsomal proteins isolated from small intestine; the dramatic increase in CYP1A1 protein can be seen only in TCDD-treated Cyp1a2(−/−) knockout mice, whereas BaP-treated Cyp1a2(−/−) mice show virtually the same amount of induced CYP1A1 protein as that in Cyp1(+/+) wild-type.
Fig. 2.

Western immunoblot of microsomes from proximal small intestine. The animals received oral BaP for 5 days or ip TCDD 48 h before sacrificing. Using the primary rabbit polyclonal anti-rat CYP1A antibody, we performed a Western analysis on microsomal proteins from the small intestine of Cyp1(+/+) wild-type, Cyp1a1(−/−) knockout, and Cyp1a2(−/−) knockout mice. This antibody recognizes both mouse CYP1A1 and CYP1A2 proteins. The two rows at bottom denote the genetic composition of these mice: (+) means the Cyp1a1 (or Cyp1a2) gene is present and functioning; (–) means the gene has been ablated by means of standard knockout methodology. Oil (left of BaP at top) denotes oral corn oil for 5 days. Oil (left of TCDD) denotes ip corn oil 48 h before sacrifice.
Localization of the CYP1 proteins throughout the GI tract
Detailed histological descriptions of the CYP1 proteins throughout the GI tract are described in the legends of Figs. 3, 4, 5, 6, and 7. By comparing Q-PCR with IHC, we conclude there is no instance in which the precise quantification of basal or inducible CYP1 mRNA levels differs substantially from the concentrations of CYP1 protein seen histologically; thus, we believe that to measure mRNA by Q-PCR is sufficient in assessing the approximate amount of CYP1 proteins throughout the mouse GI tract.
Fig. 3.

IHC analysis of tongue: (a) with anti-CYP1A1/1A2 antibody, and (b) with anti-CYP1B1 antibody. In this figure and in Figs. 4 through 7, green denotes CYP1A1, blue CYP1A2, and red CYP1B1 proteins detected by the antibody. Arrowheads depict unambiguous antibody staining; circles depict detectable mRNA by Q-PCR but no obvious localization of the protein staining could be discerned in this particular picture. “L” [labeled only in the corn oil-treated Cyp1a1(−/−) panel] stands for “lumen” of the GI tract. The GI lumen is always at the top of each panel (for ease of orientation to the tissue for the reader). The “L” in that panel is also placed there to draw attention to the fact that some nonspecific background staining is often seen in the gut contents at the lumen-epithelial cell surface and should not be confused with bona fide CYP1 protein. The CYP1A proteins are located near the top of the papillae, below the keratin layer. Positive staining with the anti-CYP1A antibody occurs only in the superficial layers of the squamous epithelium of the papillae of the tongue and, regardless of inducer or route of administration, the basal cells are not stained. On the other hand, the anti-CYP1B1 antibody shows a more homogeneous distribution throughout the squamous epithelium—whether constitutive or induced. TCDD-induced CYP1A1 and CYP1B1 protein levels appear to be slightly greater than BaP-induced CYP1A1 and CYP1B1––consistent with the mRNA levels shown in Figs. 1a and c. CYP1A2 levels in tongue are negligible. Bar at lower right =50 μm for all images in Figs. 3 through 7.
Fig. 4.

IHC analysis of esophagus: (a) with anti-CYP1A1/1A2 antibody, and (b) with anti-CYP1B1 antibody. The green, blue, and red arrowheads and circles, and bar at lower right, are described in the Fig. 3 legend. From the basal layer to the keratin layer of the esophageal epithelium in wild-type or Cyp1a2(−/−) mice, TCDD-induced CYP1A1 protein is at least two times as great than BaP-induced CYP1A1 (consistent with the mRNAs shown in Fig. 1a). The bottom-to-top gradient of expression suggests that the greater the degree of (terminal) differentiation of these cells, the more highly induced the CYP1 enzymes. Even more striking, TCDD-induced CYP1B1 protein is 4–5 times higher in concentration than BaP-induced CYP1B1 protein (consistent with the mRNAs shown in Fig. 1c). The anti-CYP1B1 staining appears to be localized a little lower in the esophageal squamous epithelium than the anti-CYP1A staining proteins.
Fig. 5.

IHC analysis of forestomach: (a) with anti-CYP1A1/1A2 antibody, and (b) with anti-CYP1B1 antibody. The green, blue, and red arrowheads and circles, and bar at lower right, are described in the Fig. 3 legend. From the basal layer to the keratin layer of the esophageal epithelium in wild-type, Cyp1a2(−/−), Cyp1b1(−/−), and Cyp1a2/1b1(−/−) mice, TCDD-induced CYP1A1 protein is several times greater than BaP-induced CYP1A1 (consistent with the mRNAs shown in Fig. 1a). CYP1A2 protein is barely detectable, but where it is detectable is in BaP-treated but not TCDD-treated Cyp1a1/1b1(−/−) mice. TCDD-induced CYP1B1 protein is several times higher than BaP-induced CYP1A1 protein in wild-type and in Cyp1a2(−/−) mice, but TCDD- and BaP-induced CYP1B1 protein amounts are similar in amount to that in Cyp1a1(−/−) mice. As with esophagus, the bottom-to-top gradient of expression suggests that the greater the degree of (terminal) differentiation of these cells, the more highly induced the CYP1 enzymes. Again as with esophagus, the CYP1B1 protein appears to be more concentrated in the lower squamous epithelium than the CYP1A proteins.
Fig. 6.

IHC analysis of glandular stomach: (a) with anti-CYP1A1/1A2 antibody, and (b) with anti-CYP1B1 antibody. The green, blue, and red arrowheads and circles, and bar at lower right, are described in the Fig. 3 legend. The CYP1A1 protein is largely confined to the mucous neck cells, especially in the TCDD-treated mice. There are some instances of CYP1A1 staining in the lumen of the gastric glandular epithelium in BaP-treated, but not in TCDD-treated, animals. The amount of CYP1A2 protein everywhere is very low. The anti-CYP1B1 antibody also may show some staining in the rough endoplasmic reticulum of zymogen cells, but the CYP1B1 protein did not appear to be in parietal cells or mucous neck cells. The basal and inducible CYP1B1 proteins are present somewhat lower in the glands, as well as down in some of the crypt enterocytes.
Fig. 7.
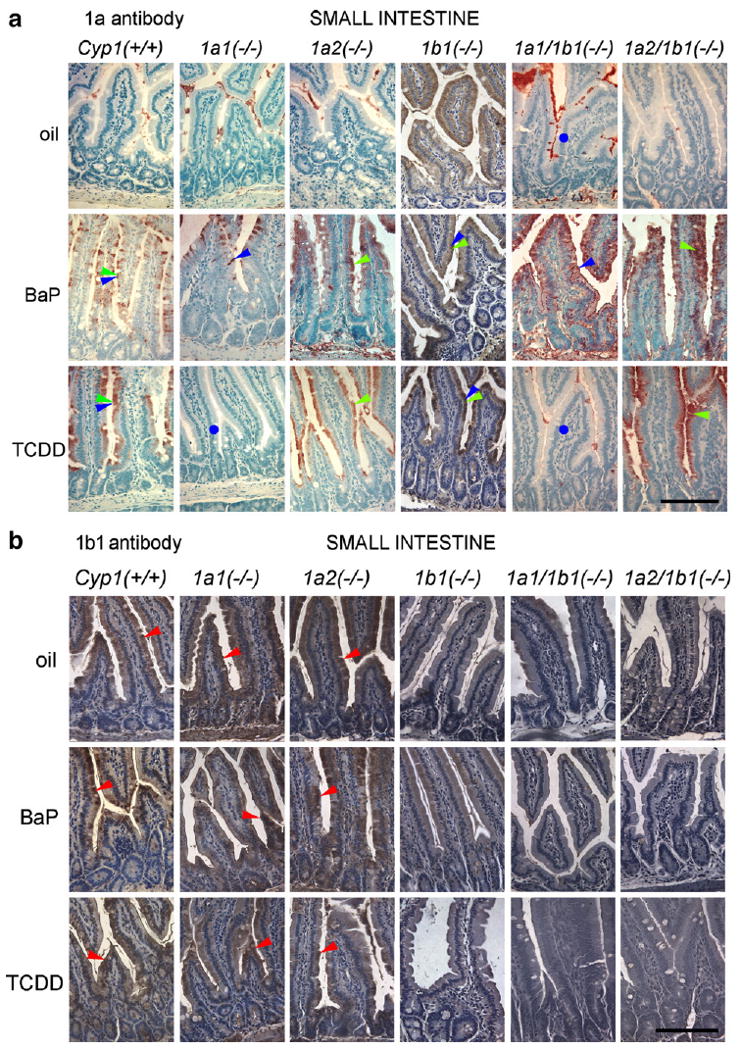
IHC analysis of proximal small intestine: (a) with anti-CYP1A1/1A2 antibody; and (b) with anti-CYP1B1 antibody. The green, blue, and red arrowheads and circles, and bar at lower right, are described in the Fig. 3 legend. Both BaP- and TCDD-treated mice show an anti-CYP1A antibody reaction product in enterocytes, and the upper part of the villus has greater numbers of enterocytes staining positive than enterocytes at the base of the villi; the crypts appear to be largely spared. The degree of staining of enterocytes also shows a gradient: seen first in the supranuclear region when CYP1A proteins are only slightly induced, and then when induction is stronger, the whole enterocyte shows staining—including regions beneath the nucleus. The constitutive and inducible CYP1B1 proteins are present somewhat lower in the glands, as well as down in some of the crypt enterocytes.
In the tongue (Fig. 3), the anti-CYP1A1/1A2 antibody staining represented almost exclusively CYP1A1 protein. Moreover, the CYP1A1 protein was seen only in the superficial layers of the squamous epithelium of the papillae, irrespective of BaP or TCDD treatment. On the contrary, the CYP1B1 protein appeared to be distributed more uniformly throughout the squamous epithelium.
Within the esophagus (Fig. 4) and forestomach (Fig. 5), the greater the degree of terminal differentiation of the squamous epithelium, the higher was the amount of CYP1 protein. Again, localization of the CYP1B1 protein differed from that of the CYP1A1/1A2 proteins. CYP1B1 appeared to be localized slightly lower in the squamous epithelial layer than the CYP1A1 and CYP1A2 proteins. Because CYP1A2 protein was very low, most of the anti-CYP1A1/1A2 antibody staining represented the CYP1A1 protein.
The majority of observations in the esophagus were also seen in the forestomach (Fig. 5). The CYP1B1 protein again appeared to be more concentrated in the lower squamous epithelium than were the CYP1A1 and CYP1A2 proteins. Moreover, TCDD- and BaP-mediated CYP1A1 induction accounts for almost all that is being stained by the anti-CYP1A1/1A2 antibody; CYP1A2 levels contributed little.
In the glandular stomach (Fig. 6), TCDD-inducible CYP1A1 was substantially greater in amounts than BaP-inducible CYP1A1 protein and localized to the mucous neck cells. Basal and inducible CYP1B1 proteins likewise were localized in mucous neck cells; TCDD-induced CYP1B1 was much greater in concentration than BaP-induced CYP1B1 protein, except in Cyp1a1(−/−) mice where TCDD- and BaP-inducible CYP1B1 were similar in amounts. Barely detectable amounts of basal and inducible CYP1A2 could be found in glandular stomach.
In the proximal small intestine (Fig. 7), BaP-induced CYP1A2 was much greater in amounts than TCDD-induced CYP1A2, yet these levels were much lower than the concentrations of the CYP1A1 protein. The CYP1A1/1A2 proteins were found in enterocytes, and in the upper portion of the villus, more so than at the base of the villi. There also appeared to be a gradient, where the antibody reaction is first seen in the supranuclear region of the enterocytes when the CYP1A1/1A2 proteins are low in amounts. Then, when induction is more robust, the entire enterocyte is full of the CYP1A1/1A2 proteins. The constitutive and inducible CYP1B1 proteins were present somewhat lower in the glands, including some antibody staining in a few of the crypt enterocytes.
Comparison of CYP1 mRNA and protein levels
Table 1 shows the relative levels of CYP1 mRNAs and proteins throughout the GI tract. Overall, the Western immunoblot (Fig. 2) and the staining intensity for the three CYP1 proteins (Figs. 3–7) agreed well with the mRNA levels (Fig. 1). Basal CYP1B1 (mRNA and protein) levels were detected in all control (po or ip corn oil-treated) mice, whereas CYP1A1 or CYP1A2 (mRNA or protein) levels were almost never detectable without treatment by BaP or TCDD. Throughout the GI tract, localization of the BaP-induced or the TCDD-induced CYP1 proteins always occurred in the same cell types, yet CYP1B1 was located consistently lower than CYP1A1 or CYP1A2 expression. In all genotypes and throughout the GI tract, the lamina propria and muscle (as well as some contents in the lumen) showed some nonspecific staining; the fact that it occurred, for example, with CYP1A1 protein equally in Cyp1(+/+) wild-type and Cyp1a1(−/−) knockout mice confirms that such staining is nonspecific.
Table 1.
Relative amounts of CYP1 mRNA and protein in six tissues from six genotypes treated with po BaP versus ip TCDDa
| Cyp1(+/+) | Cyp1a1(−/−) | Cyp1a2(−/−) | Cyp1b1(−/−) | Cyp1a1/1b1(−/−) | Cyp1a2/1b1(−/−) | |||||||||||||
|---|---|---|---|---|---|---|---|---|---|---|---|---|---|---|---|---|---|---|
| Corn oil | BaP | TCDD | Corn oil | BaP | TCDD | Corn oil | BaP | TCDD | Corn oil | BaP | TCDD | Corn oil | BaP | TCDD | Corn oil | BaP | TCDD | |
| CYP1A1 mRNA and proteinb | ||||||||||||||||||
| Tongue | 0 | ++ | ++ | 0 | 0 | 0 | 0 | ++ | ++ | 0 | ++ | ++ | 0 | 0 | 0 | 0 | ++ | +++ |
| Esophagus | 0 | ++ | +++ | 0 | 0 | 0 | 0 | ++ | +++ | 0 | ++ | ++ | 0 | 0 | 0 | 0 | ++ | +++ |
| Forestomach | 0 | ++ | +++ | 0 | 0 | 0 | 0 | ++ | +++ | 0 | ++ | +++ | 0 | 0 | 0 | 0 | ++ | +++ |
| Glandular stomach | 0 | + | +++ | 0 | 0 | 0 | 0 | + | +++ | 0 | + | +++ | 0 | 0 | 0 | 0 | + | +++ |
| Duodenum/jejunum | 0 | +++ | +++ | 0 | 0 | 0 | 0 | +++ | ++++ | 0 | +++ | +++ | 0 | 0 | 0 | 0 | +++ | ++++ |
| Colon | 0 | + | +++ | 0 | 0 | 0 | 0 | + | +++ | 0 | + | +++ | 0 | 0 | 0 | 0 | + | +++ |
| CYP1A2 mRNA and proteinb | ||||||||||||||||||
| Tongue | 0 | + | + | 0 | + | + | 0 | 0 | 0 | 0 | + | + | 0 | + | + | 0 | 0 | 0 |
| Esophagus | 0 | ++ | + | 0 | ++ | + | 0 | 0 | 0 | 0 | + | + | 0 | ++ | + | 0 | 0 | 0 |
| Forestomach | 0 | + | ± | 0 | + | ± | 0 | 0 | 0 | 0 | + | ± | 0 | ++ | ± | 0 | 0 | 0 |
| Glandular stomach | 0 | ++ | + | 0 | ++ | + | 0 | 0 | 0 | 0 | + | + | 0 | ++ | + | 0 | 0 | 0 |
| Duodenum/jejunum | 0 | +++++ | + | 0 | +++ | + | 0 | 0 | 0 | 0 | +++++ | + | 0 | +++ | + | 0 | 0 | 0 |
| Colon | 0 | ± | ± | 0 | ± | ± | 0 | 0 | 0 | 0 | ± | ± | 0 | ± | ± | 0 | 0 | 0 |
| CYP1B1 mRNA and proteinb | ||||||||||||||||||
| Tongue | + | ++ | ++ | + | +++ | ++ | + | + | +++ | 0 | 0 | 0 | 0 | 0 | 0 | 0 | 0 | 0 |
| Esophagus | + | +++ | ++++ | + | ++++ | ++++ | + | +++ | ++++ | 0 | 0 | 0 | 0 | 0 | 0 | 0 | 0 | 0 |
| Forestomach | + | +++ | ++++ | + | ++++ | ++++ | + | +++ | ++++ | 0 | 0 | 0 | 0 | 0 | 0 | 0 | 0 | 0 |
| Glandular stomach | + | ++ | +++++ | + | ++++ | ++++ | + | ++ | +++++ | 0 | 0 | 0 | 0 | 0 | 0 | 0 | 0 | 0 |
| Duodenum/jejunum | + | + | ++ | + | ++++ | ++ | + | ++ | +++ | 0 | 0 | 0 | 0 | 0 | 0 | 0 | 0 | 0 |
| Colon | + | + | + | + | ++ | + | + | + | ++ | 0 | 0 | 0 | 0 | 0 | 0 | 0 | 0 | 0 |
At no location in the GI tract did there appear to be a substantial deviation between the fold increase in a CYP1 mRNA level versus its protein level.
Semiquantitative estimates of the relative amounts of CYP1A1, CYP1A2, and CYP1B1 proteins were made: “zero” represents absolutely no detection (due to gene ablation in the entire mouse);
“±” signifies minimally detectable;
“+”, “++”, “+++”, “++++”, and “+++++” denote increasing amounts, respectively, as detected by both Q-PCR and IHC, so that “five pluses” might reflect perhaps 40 times as much as “one plus”.
Discussion
Ever since the pioneering study of BaP hydroxylase activity throughout rat intestine by the Wattenberg lab [32], numerous additional GI tract studies have been carried out, in rats more than in mice: induction of CYP enzyme activities [11,15,25, 26,31,35], localization in specific cell types [7,11,24], or CYP gene regulation [3,8,27,34–37] by foreign chemical inducers [1,9,24–26,36], inducers from dietary intake [2,8,10,11,14,15, 22,31,35], or disease states [12,23]. It should be emphasized that CYP3A enzymes, abundant in the GI tract [3,8,11,12,15,22,25, 31,34,36], also metabolize PAHs such as BaP. The vast majority of these studies have focused only on the duodenum and proximal jejunum, undoubtedly because it has been well established that drug metabolism is strikingly higher there than in the rest of the GI tract. Ever since the Wattenberg study, not a single more recent additional publication has compared drug-metabolizing activity or gene expression throughout the GI tract, from tongue to colon. The kinetics of CYP induction has previously been described in the duodenum, where initially activities are induced just above the crypt, following which enterocytes containing highly induced CYP activities migrate with time toward the tip of the villi before sloughing off [11]. One more recent study [36] compared mRNA levels with protein concentrations via IHC—but this group looked only at mouse proximal small intestine.
By contrast, the present study has measured the precise amount of CYP1A1, CYP1A2, and CYP1B1 mRNA molecules per total RNA, plus we have assessed the localization of all three proteins by IHC—from tongue to colon. Two different CYP1 inducers (BaP and TCDD), and two different routes of administration (po and ip) of the CYP1 inducer, were compared. To be certain to exclude nonspecific protein staining by IHC, we had the benefit of the three single-knockout and two double–knockout mouse lines. Another reason why we chose to carry out the present study, despite some overlap with previous GI tract studies, was to conduct an all-inclusive examination, in a single species, where proof of CYP identity could be shown using mouse lines with the absence of a given Cyp1 gene. This could not previously have been accomplished. Moreover, there have been reports in the literature of no detectable CYP1A2 in the GI tract; in the present study we show that CYP1A2 mRNA and protein are indeed very much present, especially in the proximal small intestine following oral BaP treatment.
As found in many other GI tract studies, we also determined that CYP1A expression is highest in duodenum and jejunum (proximal small intestine), less in the glandular stomach, forestomach, and esophagus, and least in the ileum, colon, and tongue. In contrast, CYP1B1 (basal and inducible) is present at the highest levels in esophagus, forestomach, and glandular stomach, less in small intestine, and much less in colon and tongue. By comparing IHC with Q-PCR, it would appear that, in no instance, are basal or inducible CYP1 mRNA levels substantially different from what we see as CYP1 protein concentrations. Therefore, the BaP and TCDD induction processes more closely reflect gene transcription rather than large differences in mRNA or protein stabilization.
Unexpectedly, there was at least a 5-fold greater CYP1A2 induction in the small intestine of oral BaP-treated wild-type mice, compared with that in (ip or po) TCDD-treated mice. In the other direction, TCDD-mediated CYP1B1 induction in the stomach was more than 2-fold greater than oral BaP-mediated CYP1B1 induction. These findings should serve as a warning to anyone trying to decide between a PAH and TCDD inducer and between ip vs oral administration: studying the effects of CYP1A2 or CYP1B1 induction in the GI tract can give the researcher unexpected data. Moreover, because the substrate specificity of CYP1A2 (i.e., predominantly arylamines and at least two dozen drugs) differs dramatically from that of CYP1A1 or CYP1B1 (i.e., predominantly PAHs, halogenated hydrocarbons, and few if any drugs), pretreatment of oral BaP vs TCDD can result in large differences in metabolite profile—be they endogenous compounds, foreign chemicals, mutagens, or drugs.
When ip BaP treatment was compared with po BaP treatment, we found that inducible levels of CYP1 mRNAs are at least twice higher throughout the entire GI tract after oral than after ip BaP. This makes sense, because an easily metabolized PAH inducer having direct contact with the walls of the entire GI tract could be more efficient at inducing CYP1 than an easily metabolized PAH inducer injected into the peritoneal cavity. It has also been noted in rat intestine that po administration of a CYP1 inducer leads to induction detectable after 1 h, compared with ip administration of the same inducer for which 6 h or more are needed [11]. When ip TCDD treatment was compared with po TCDD treatment, on the contrary, inducible levels of CYP1 mRNAs in the GI tract were essentially the same with ip as with po TCDD. These findings likely reflect the lower potency of BaP as a CYP1 inducer due to the ease of BaP being metabolized, compared with the much higher potency of TCDD as a CYP1 inducer—due to only negligible metabolism of TCDD.
These findings also reflect an important pharmacokinetic difference. A chemical administered ip is taken up largely by the venous portal system, then moves through the liver, then to the heart, then to the lungs and back to the heart, and finally through the arteries to the various tissues including GI tract. In contrast, a chemical (especially a hydrophobic chemical) given orally first has direct contact with the epithelial cells of the GI tract, but then is largely taken up by the lymphatic system rather than the venous portal system [16]; the lymphatic duct empties the chemical into the subclavian vein, then to the heart, then to the lungs and back to the heart, and finally through the arteries to the various tissues before reaching the liver. This important difference between ip vs po administration of relatively highly hydrophobic environmental toxicants should also be appreciated for the administration of highly hydrophobic drugs, i.e., the pharmacologist who administers a drug ip is likely to find different pharmacokinetics from the same drug administered orally.
In addition, prevailing wisdom would tell us that oral BaP (in corn oil-soaked lab chow) is likely not to be thoroughly emulsified and absorbed until it reaches the duodenum. Because we see little BaP absorption in wild-type mice, induction profiles in liver may reflect the induction that occurs in the proximal small intestine (the first true site of exposure); there may be little induction elsewhere. In contrast, when CYP1A1 is genetically absent, BaP may become systemic and therefore induction of other CYP1 proteins may become more highly widespread.
We also determined histologically that the CYP1A1 and CYP1A2 proteins are generally localized nearer to the lumen than the CYP1B1 proteins, and this was true in both squamous and glandular epithelial cells. These data suggest to us that, at least throughout the GI tract, the inducible CYP1A1 enzyme (and perhaps CYP1A2 at least in the proximal small intestine), both in concentration and location, might act as “guard” in detoxifying oral BaP and, hence, protecting the animal. It therefore follows logically that, for any of us to have robust CYP1A1 induction in our GI tract, we might be more resistant to any toxic effects of ingesting BaP in our food or from the environment.
This model system, including the single- and double-knockout mouse lines, therefore, is one in which differences in toxicity and malignancy can be dissected––depending on the dose of the CYP1 inducer, the route of administration, the target organ under study, and the ability to express particular CYP1 enzymes in a specific cell type. Now that we have quantified and localized the three CYP1 enzymes throughout the GI tract in the present study, it is planned in the near future to measure metabolite profiles in the various tissues and cell types, as the animals begin to develop tissue damage or malignancy caused by PAHs and other environmental toxicants.
Acknowledgments
We thank our colleagues for valuable discussions and critical readings of the manuscript. These studies were supported, in part, by NIH Grants R01 ES08147 (D.W.N.), R01 ES014403 (D.W.N.), and P30 ES06096 (T.P.D. and D.W.N.).
Abbreviations
- CYP1A1
cytochrome P450 1A1
- CYP1A2
cytochrome P450 1A2
- CYP1B1
cytochrome P450 1B1
- Q-PCR
quantitative-polymerase chain reaction
- BaP
benzo[a]pyrene
- PAHs
polycyclic aromatic hydrocarbons
- TCDD (or “dioxin”)
2,3,7,8-tetrachlorodibenzo-p-dioxin
- IHC
immunohistochemistry
- ip
intraperitoneal administration
- po
per os (oral) administration. Mouse (and rat) genes are italicized with only the first letter capitalized (e.g., Cyp1a1), whereas human and other nonrodent genes are italicized with all letters capitalized (e.g., CYP1A1). Rodent, human, and generic cDNA/mRNA/protein/enzyme activities are never italicized and all letters always capitalized (e.g., CYP1A1)
References
- 1.Borm PJ, Frankhuijzen-Sierevogel A, Noordhoek J. Kinetics of in vitro O-deethylation of phenacetin and 7-ethoxycoumarin by rat intestinal mucosal cells and microsomes. The effect of induction with 3-methylcho-lanthrene and inhibition with α-naphthoflavone. Biochem Pharmacol. 1983;32:1573–1580. doi: 10.1016/0006-2952(83)90330-1. [DOI] [PubMed] [Google Scholar]
- 2.Bradfield CA, Bjeldanes LF. Structure-activity relationships of dietary indoles: a proposed mechanism of action as modifiers of xenobiotic metabolism. J Toxicol Environ Health. 1987;21:311–323. doi: 10.1080/15287398709531021. [DOI] [PubMed] [Google Scholar]
- 3.Burk O, Koch I, Raucy J, Hustert E, Eichelbaum M, Brockmoller J, Zanger UM, Wojnowski L. The induction of cytochrome P450 3A5 (CYP3A5) in the human liver and intestine is mediated by the xenobiotic sensors pregnane X receptor (PXR) and constitutively activated receptor (CAR) J Biol Chem. 2004;279:38379–38385. doi: 10.1074/jbc.M404949200. [DOI] [PubMed] [Google Scholar]
- 4.Buters JT, Sakai S, Richter T, Pineau T, Alexander DL, Savas U, Doehmer J, Ward JM, Jefcoate CR, Gonzalez FJ. Cytochrome P450 CYP1B1 determines susceptibility to 7,12-dimethylbenz[a]anthra-cene-induced lymphomas. Proc Natl Acad Sci U S A. 1999;96:1977–1982. doi: 10.1073/pnas.96.5.1977. [DOI] [PMC free article] [PubMed] [Google Scholar]
- 5.Dalton TP, Dieter MZ, Matlib RS, Childs NL, Shertzer HG, Genter MB, Nebert DW. Targeted knockout of Cyp1a1 gene does not alter hepatic constitutive expression of other genes in the mouse [Ah] battery. Biochem Biophys Res Commun. 2000;267:84–189. doi: 10.1006/bbrc.1999.1913. [DOI] [PubMed] [Google Scholar]
- 6.Dragin N, Uno S, Wang B, Dalton TP, Nebert DW. Generation of “humanized” hCYP1A1_1A2_Cyp1a1/1a2(−/−) mouse line. Biochem Biophys Res Commun. 2007;359:635–642. doi: 10.1016/j.bbrc.2007.05.202. [DOI] [PMC free article] [PubMed] [Google Scholar]
- 7.Dubey RK, Singh J. Localization and characterization of drug-metabolizing enzymes along the villus-crypt surface of the rat small intestine I. Monooxygenases. Biochem Pharmacol. 1988;37:169–176. doi: 10.1016/0006-2952(88)90714-9. [DOI] [PubMed] [Google Scholar]
- 8.Fontana RJ, Lown KS, Paine MF, Fortlage L, Santella RM, Felton JS, Knize MG, Greenberg A, Watkins PB. Effects of a chargrilled meat diet on expression of CYP3A, CYP1A, and P-glycoprotein levels in healthy volunteers. Gastroenterology. 1999;117:89–98. doi: 10.1016/s0016-5085(99)70554-8. [DOI] [PubMed] [Google Scholar]
- 9.Heimann R, Rice RH. Polycyclic aromatic hydrocarbon toxicity and induction of metabolism in cultivated esophageal and epidermal keratinocytes. Cancer Res. 1983;43:4856–4862. [PubMed] [Google Scholar]
- 10.Ito S, Chen C, Satoh J, Yim S, Gonzalez FJ. Dietary phytochemicals regulate whole-body CYP1A1 expression through an aryl hydrocarbon receptor nuclear translocator-dependent system in gut. J Clin Invest. 2007;117:1940–1950. doi: 10.1172/JCI31647. [DOI] [PMC free article] [PubMed] [Google Scholar]
- 11.Kaminsky LS, Fasco MJ. Small intestinal cytochromes P450. Crit Rev Toxicol. 1991;21:407–422. doi: 10.3109/10408449209089881. [DOI] [PubMed] [Google Scholar]
- 12.Leblond FA, Petrucci M, Dube P, Bernier G, Bonnardeaux A, Pichette V. Down-regulation of intestinal cytochrome P450 in chronic renal failure. J Am Soc Nephrol. 2002;13:1579–1585. doi: 10.1097/01.asn.0000017575.50319.77. [DOI] [PubMed] [Google Scholar]
- 13.Liang HC, Li H, McKinnon RA, Duffy JJ, Potter SS, Puga A, Nebert DW. Cyp1a2(−/−) null mutant mice develop normally but show deficient drug metabolism. Proc Natl Acad Sci U S A. 1996;93:1671–1676. doi: 10.1073/pnas.93.4.1671. [DOI] [PMC free article] [PubMed] [Google Scholar]
- 14.Lindeskog P, Overvik E, Nilsson L, Nord CE, Gustafsson JA. Influence of fried meat and fiber on cytochrome P-450 mediated activity and excretion of mutagens in rats. Mutat Res. 1988;204:553–563. doi: 10.1016/0165-1218(88)90058-4. [DOI] [PubMed] [Google Scholar]
- 15.McDanell RE, McLean AE. Differences between small and large intestine and liver in the inducibility of microsomal enzymes in response to stimulation by phenobarbitone and β-naphthoflavone in the diet. Biochem Pharmacol. 1984;33:1977–1980. doi: 10.1016/0006-2952(84)90558-6. [DOI] [PubMed] [Google Scholar]
- 16.Nebert DW, Dalton TP. The role of cytochrome P450 enzymes in endogenous signalling pathways and environmental carcinogenesis. Nat Rev, Cancer. 2006;6:947–960. doi: 10.1038/nrc2015. [DOI] [PubMed] [Google Scholar]
- 17.Nebert DW, Dalton TP, Okey AB, Gonzalez FJ. Role of aryl hydrocarbon receptor-mediated induction of the CYP1 enzymes in environmental toxicity and cancer. J Biol Chem. 2004;279:23847–23850. doi: 10.1074/jbc.R400004200. [DOI] [PubMed] [Google Scholar]
- 18.Nebert DW, Dalton TP, Stuart GW, Carvan MJ., III “Gene-swap knock-in” cassette in mice to study allelic differences in human genes. Ann NY Acad Sci. 2000;919:148–170. doi: 10.1111/j.1749-6632.2000.tb06876.x. [DOI] [PubMed] [Google Scholar]
- 19.Nebert DW, Russell DW. Clinical importance of the cytochromes P450. Lancet. 2002;360:1155–1162. doi: 10.1016/S0140-6736(02)11203-7. [DOI] [PubMed] [Google Scholar]
- 20.Nelson DR, Zeldin DC, Hoffman SM, Maltais LJ, Wain HM, Nebert DW. Comparison of cytochrome P450 (CYP) genes from the mouse and human genomes, including nomenclature recommendations for genes, pseudogenes and alternative-splice variants. Pharmacogenetics. 2004;14:1–18. doi: 10.1097/00008571-200401000-00001. [DOI] [PubMed] [Google Scholar]
- 21.Robinson JR, Felton JS, Levitt RC, Thorgeirsson SS, Nebert DW. Relationship between “aromatic hydrocarbon responsiveness” and the survival times in mice treated with various drugs and environmental compounds. Mol Pharmacol. 1975;11:850–865. [PubMed] [Google Scholar]
- 22.Salbe AD, Bjeldanes LF. The effects of dietary brussels sprouts and Schizandra chinensis on the xenobiotic-metabolizing enzymes of the rat small intestine. Food Chem Toxicol. 1985;23:57–65. doi: 10.1016/0278-6915(85)90221-2. [DOI] [PubMed] [Google Scholar]
- 23.Sasaki M, Ostanin D, Elrod JW, Oshima T, Jordan P, Itoh M, Joh T, Minagar A, Alexander JS. TNFα-induced endothelial cell adhesion molecule expression is cytochrome P450 monooxygenase-dependent. Am J Physiol Cell Physiol. 2003;284:C422–C428. doi: 10.1152/ajpcell.00271.2002. [DOI] [PubMed] [Google Scholar]
- 24.Shimizu M, Lasker JM, Tsutsumi M, Lieber CS. Immunohistochemical localization of ethanol-inducible P450 2E1 in the rat alimentary tract. Gastroenterology. 1990;99:1044–1053. doi: 10.1016/0016-5085(90)90625-b. [DOI] [PubMed] [Google Scholar]
- 25.Stohs SJ, Grafstrom RC, Burke MD, Orrenius S. Xenobiotic metabolism and enzyme induction in isolated rat intestinal microsomes. Drug Metab Dispos. 1976;4:517–521. [PubMed] [Google Scholar]
- 26.Traber PG, Chianale J, Florence R, Kim K, Wojcik E, Gumucio JJ. Expression of cytochrome P450b and P450e genes in small intestinal mucosa of rats following treatment with phenobarbital, polyhalogenated biphenyls, and organochlorine pesticides. J Biol Chem. 1988;263:9449–9455. [PubMed] [Google Scholar]
- 27.Traber PG, McDonnell WM, Wang W, Florence R. Expression and regulation of cytochrome P-450 I genes (CYP1A1 and CYP1A2) in the rat alimentary tract. Biochim Biophys Acta. 1992;1171:167–175. doi: 10.1016/0167-4781(92)90117-i. [DOI] [PubMed] [Google Scholar]
- 28.Tukey RH, Hannah RR, Negishi M, Nebert DW, Eisen HJ. The Ah locus: correlation of intranuclear appearance of inducer-receptor complex with induction of cytochrome P1-450 mRNA. Cell. 1982;31:275–284. doi: 10.1016/0092-8674(82)90427-5. [DOI] [PubMed] [Google Scholar]
- 29.Uno S, Dalton TP, Derkenne S, Curran CP, Miller ML, Shertzer HG, Nebert DW. Oral exposure to benzo[a]pyrene in the mouse: detoxication by inducible cytochrome P450 is more important than metabolic activation. Mol Pharmacol. 2004;65:1225–1237. doi: 10.1124/mol.65.5.1225. [DOI] [PubMed] [Google Scholar]
- 30.Uno S, Dalton TP, Dragin N, Curran CP, Derkenne S, Miller ML, Shertzer HG, Gonzalez FJ, Nebert DW. Oral benzo[a]pyrene in Cyp1 knockout mouse lines: CYP1A1 important in detoxication, CYP1B1 metabolism required for immune damage independent of total-body burden and clearance rate. Mol Pharmacol. 2006;69:1103–1114. doi: 10.1124/mol.105.021501. [DOI] [PubMed] [Google Scholar]
- 31.Watkins PB. Drug metabolism by cytochromes P450 in the liver and small bowel. Gastroenterol Clin North Am. 1992;21:511–526. [PubMed] [Google Scholar]
- 32.Wattenberg LW, Leong JL, Strand PJ. Benzpyrene hydroxylase activity in the gastrointestinal tract. Cancer Res. 1962;22:1120–1125. [PubMed] [Google Scholar]
- 33.Winer J, Jung CK, Shackel I, Williams PM. Development and validation of real-time quantitative reverse transcriptase-polymerase chain reaction for monitoring gene expression in cardiac myocytes in vitro. Anal Biochem. 1999;270:41–49. doi: 10.1006/abio.1999.4085. [DOI] [PubMed] [Google Scholar]
- 34.Xu Y, Iwanaga K, Zhou C, Cheesman MJ, Farin F, Thummel KE. Selective induction of intestinal CYP3A23 by 1α,25-dihydroxyvitamin D3 in rats. Biochem Pharmacol. 2006;72:385–392. doi: 10.1016/j.bcp.2006.04.033. [DOI] [PubMed] [Google Scholar]
- 35.Yang SP, Raner GM. Cytochrome P450 expression and activities in human tongue cells and their modulation by green tea extract. Toxicol Appl Pharmacol. 2005;202:140–150. doi: 10.1016/j.taap.2004.06.014. [DOI] [PubMed] [Google Scholar]
- 36.Zhang QY, Dunbar D, Kaminsky LS. Characterization of mouse small intestinal cytochrome P450 expression. Drug Metab Dispos. 2003;31:1346–1351. doi: 10.1124/dmd.31.11.1346. [DOI] [PubMed] [Google Scholar]
- 37.Zhang QY, Wikoff J, Dunbar D, Fasco M, Kaminsky L. Regulation of cytochrome P450 1A1 expression in rat small intestine. Drug Metab Dispos. 1997;25:21–26. [PubMed] [Google Scholar]