Abstract
Using single-molecule DNA nanomanipulation, we show that abortive initiation involves DNA “scrunching”--in which RNA polymerase (RNAP) remains stationary and unwinds and pulls into itself downstream DNA--that scrunching requires RNA synthesis, and that scrunching depends on RNA length. We show further that promoter escape involves scrunching, and that scrunching occurs in most or all instances of promoter escape. Our results support existence of an obligatory stressed intermediate, with ~1 turn of additional DNA unwinding, in escape and are consistent with the proposal that stress in this intermediate provides the driving force to break RNAP-promoter and RNAP-initiation-factor interactions in escape.
Transcription initiation involves a series of reactions (1-3). RNA polymerase (RNAP) binds to promoter DNA to yield an RNAP-promoter closed complex (RPc). RNAP then unwinds ~1 turn of DNA surrounding the transcription start site to yield an RNAP-promoter open complex (RPo). RNAP then enters into abortive cycles of synthesis and release of short RNA products as an RNAP-promoter initial transcribing complex (RPitc) and, upon synthesis of an RNA product ~9-11 nt in length, escapes the promoter and enters into productive synthesis of RNA as an RNAP-DNA elongation complex (RDe).
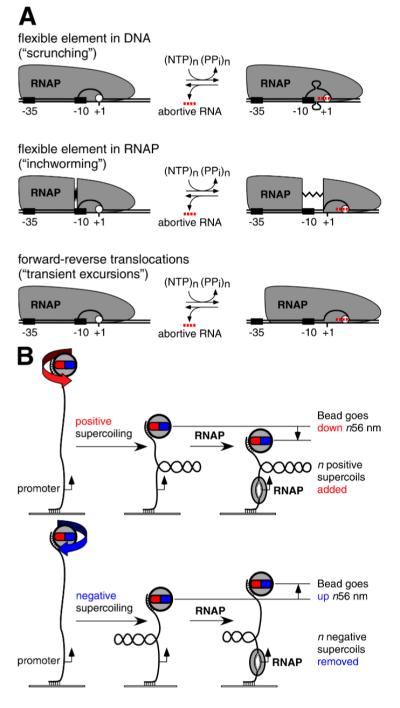
The mechanism by which the RNAP active-center translocates in abortive initiation and promoter escape has remained problematic. The problem has been posed by two seemingly contradictory observations: First, RNA products up to ~8-10 nt in length are synthesized in abortive initiation (4-6); thus the RNAP active center translocates relative to DNA in abortive initiation. Second, DNA-footprinting results indicate that there upstream boundary of the DNA segment protected by RNAP is the same in RPo and in RPitc engaged in abortive synthesis (7-10); thus RNAP appears not to translocate relative to DNA in abortive initiation. To reconcile the observation that the RNAP active center translocates in abortive initiation with the observation that RNAP appears not to translocate in abortive initiation, three models have been proposed: (i) “scrunching,” which invokes contraction of DNA, (ii) “inchworming,” which invokes expansion of RNAP, and (iii) “transient excursions” which invokes transient cycles of forward and reverse RNAP translocations with long intervals between cycles (Fig. 1A; 4, 7, 9-12; see also proposals for structurally unrelated single-subunit RNAP derivatives in 13-19).
Fig. 1. Background and experimental approach.
(A) Models for RNAP-active-center translocation in abortive initiation: (i) The “scrunching” model invokes a flexible element in DNA (4, 7, 11, 12; see also 13-19). In each cycle of abortive initiation, RNAP unwinds and pulls into itself downstream DNA, accommodating the accumulated DNA as single-stranded bulges in the unwound region; upon release of the abortive RNA, RNAP extrudes the internalized DNA. (ii) The “inchworming” model invokes a flexible element in RNAP (9,10). In each cycle of abortive initiation, a module of RNAP containing the active center (white circle) detaches from the remainder of RNAP and translocates downstream; upon release of the abortive RNA, this module of RNAP reverse translocates. (iii) The “transient-excursions” model invokes abortive cycles that are transient--so short in lifetime, and so infrequent in occurrence, that they cannot be detected in a time-averaged, population-averaged approach such as DNA footprinting (7). In each cycle of abortive initiation, RNAP translocates downstream as a unit; upon release of the abortive RNA, RNAP reverse translocates as a unit. (B) Experimental approach (Fig. S1; 20-22). The end-to-end extension of a mechanically stretched, negatively supercoiled (top) or positively supercoiled (bottom), single DNA molecule containing a single promoter is monitored. Unwinding of n turns of DNA by RNAP results in the compensatory loss of n negative supercoils, or gain of n positive supercoils, and a readily detectable, nanometer-scale (n·56 nm), movement of the bead.
In previous work, we have developed a single-molecule-DNA-nanomanipulation approach that detects RNAP-dependent DNA unwinding with ~1 bp resolution and ~1 s temporal resolution, and we have applied this approach to detect and characterize RNAP-dependent promoter unwinding upon formation of RPo (Figs. 1B, S1, 20-22). In this work, we have applied this approach to test the scrunching model for RNAP-active-center translocation in abortive initiation and promoter escape (Fig. 1A; 4, 7, 11, 12). The scrunching model--and only the scrunching model--postulates changes in RNAP-dependent DNA unwinding during abortive initiation and promoter escape. Specifically, the scrunching model postulates that RNAP pulls into itself downstream DNA; for each base pair that RNAP pulls into itself, a base pair must be broken and must be maintained broken, and, correspondingly there must be one base pair of additional DNA unwinding.
Our first set of experiments addressed abortive initiation occurring in complexes engaged in iterative abortive initiation [complexes prepared using subsets of nucleoside triphosphates (NTPs) insufficient to permit promoter escape and productive initiation]. Our primary experimental system was the T5 N25 promoter, a classic model system for analysis of abortive initiation and promoter escape (11; Fig. S2). The initial transcribed sequence of the N25 promoter has no C or G residues in the first 8 nt (Fig. S2); therefore, upon preparation of RPo at the N25 promoter and addition of ATP and UTP, one obtains RPitc engaged in iterative abortive synthesis of RNA products up to 8 nt in length (RPitc,≤8; Fig. S2). We also analyzed the N25A5C promoter, a derivative of the N25 promoter that has an altered initial-transcribed-region sequence (Fig. S3). With the N25A5C promoter, with appropriate NTP subsets, one obtains RPitc engaged in iterative abortive synthesis of products up to 4 nt in length (RPitc,≤4) and RPitc engaged in iterative abortive synthesis of products up to 8 nt in length (RPitc,≤8) (Fig. S3).
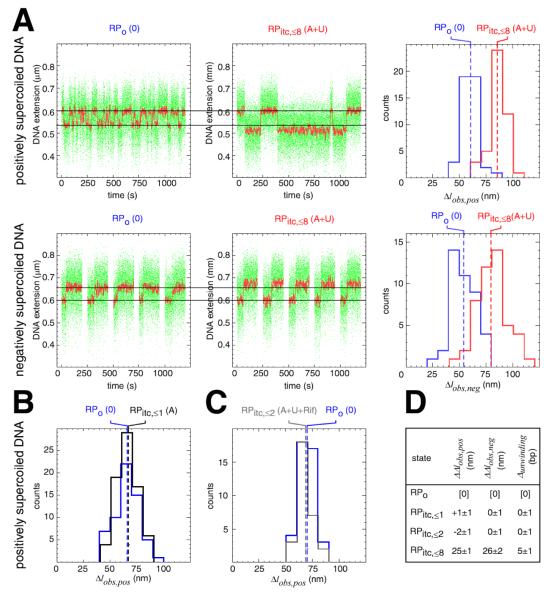
To determine whether scrunching occurs in abortive initiation, we quantified RNAP-dependent DNA unwinding at the N25 promoter in RPo (0 NTPs) and in RPitc,≤8 (ATP+UTP) (Fig. 2A,D). Comparison of the amplitudes of transitions in RPo and in RPitc,≤8 in representative single-molecule time traces indicates that the amplitude of transitions is greater in RPitc,≤8 (Fig 2A, left). Comparison of histograms shows clearly that the amplitude of transitions is greater in RPitc,≤8 (Fig 2A, right). By combining data obtained with positively supercoiled DNA and data obtained with negatively supercoiled DNA, we can establish unequivocally that there is a difference in DNA unwinding in RPo and RPitc,≤8 , and we can extract the extent of the difference in DNA unwinding in RPo and RPitc,≤8 : namely, upon transition from RPo to RPitc,≤8, there is an increase in unwinding of 5±1 bp (Fig. 2D). Consistent with these results, we find that, upon transition from RPo to RPitc,≤8 at the N25 promoter, the downstream boundary of the potassium-permanganate-sensitive promoter region shifts from position +2 to position +8, implying an increase in DNA unwinding of 6 bp (Fig. S4). We conclude that scrunching occurs in abortive initiation.
Fig. 2. Scrunching occurs in abortive initiation.
(A) Single-molecule time traces and transition-amplitude histograms for RPo (0 NTPs) and RPitc,≤8 (ATP+UTP) at the N25 promoter. Data for positively supercoiled DNA are at top; data for negatively supercoiled DNA are at bottom. Green points, raw data (30 frames/s); red points, averaged data (1 s window); dashed lines in histograms, means; Δlobs,pos, transition amplitude with positively supercoiled DNA; Δlobs,neg, transition amplitude with negatively supercoiled DNA.
(B) Transition-amplitude histogram for RPitc,≤1 (from control experiment providing only ATP).
(C) Transition-amplitude histogram for RPitc,≤2 (from control experiment providing ATP, UTP, and rifampicin).
(D) Differences in Δlobs,pos, Δlobs,neg, and unwinding relative to values in RPo (mean ± SE).
To determine whether scrunching requires RNA synthesis, we performed a control experiment in which we provided only the initiating nucleotide, ATP (RPitc,≤1; Figs. 2B,D, S2, S5). In this case, scrunching was not observed (Fig, 2B,D). We also performed a control experiment in which we provided ATP, UTP, and rifampicin--an inhibitor that blocks synthesis of RNA products >2 nt in length (RPitc,≤2; Figs. 2C,D, S2, S5). In this case also, scrunching was not observed (Fig. 2C,D). We conclude that scrunching requires RNA synthesis, and, more particularly, that scrunching requires synthesis of an RNA product >2 nt in length.
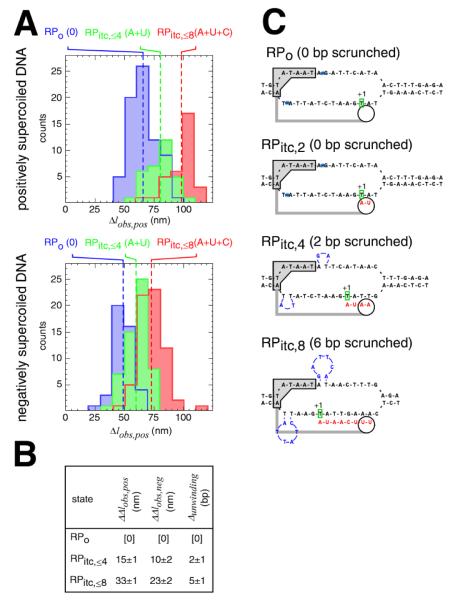
To determine whether the extent of scrunching correlates with RNA length, we quantified RNAP-dependent DNA unwinding at the N25A5C promoter in RPo (no NTPs), RPitc,≤4 (ATP+UTP), and RPitc,≤8 (ATP+UTP+CTP) (Figs. 3A,B, S3, S6). We observed successive, step-wise increases in the amplitudes of transitions (Fig. 3A) and in the corresponding extents of DNA unwinding (Fig. 3B). We observed an increase in DNA unwinding of 2±1 bp upon transition from RPo to RPitc,≤4 (Fig. 3B), and we observed an increase in DNA unwinding of 5±1 bp upon transition from RPo to RPitc,≤8 (Fig. 3B). Within experimental error, the observed increases in unwinding in the preceding experiments and in this experiment agree with the quantitative predictions of the simplest version of the scrunching model, wherein increases in unwinding are predicted to equal N-2, where N is the length of the RNA in nucleotides (Fig. 3C). [In the simplest version of the scrunching model, the RNAP active center is predicted to be able to make an RNA product 2 nt in length without translocation, but to need to translocate, and to scrunch, to make longer RNA products; thus the increase in unwinding is predicted to equal N-2 (Fig. 3C).] We conclude that the extent of scrunching in abortive initiation correlates with RNA length and that it correlates quantitatively as predicted by the simplest model of scrunching.
Fig. 3. The extent of scrunching correlates with the length of the RNA product.
(A) Transition-amplitude histograms for RPo (0 NTPs), RPitc,≤4 (ATP+UTP), and RPitc,≤8 (ATP+UTP+CTP) at the N25A5C promoter. Data for positively supercoiled DNA are at top; data for negatively supercoiled DNA are at bottom.
(B) Differences in Δlobs,pos, Δlobs,neg, and unwinding relative to values in RPo (mean ± SE).
(C) Prediction of scrunching model: number of base pairs scrunched equals N-2, where N is the length of the RNA product. Sequence-specific RNAP-promoter interactions that define the upstream boundary of the unwound region are indicated by a gray box; RNAP structural elements that constrain the spacing between the upstream boundary of the unwound region and the RNAP active center are indicated by a gray bar; the RNAP active center is indicated by a white circle; the RNA product is in red; position +1 of the template DNA strand is in green; scrunched DNA nucleotides are in blue (and are positioned as proposed in the companion paper; 24).
In each of the preceding experiments, complexes engaged in abortive synthesis and release of RNA products >2 nt in length were observed to be present predominantly in the scrunched state; cycles of transitions between the scrunched state and the unscrunched state having the extent of unwinding in RPo were not observed (Figs. 2A, S5, S6). We infer that, at the promoters studied, at the saturating NTP concentrations studied, abortive-product synthesis and scrunching are fast relative to abortive-product release and unscrunching, and also are fast relative to the second-scale temporal resolution of our method. Consistent with this inference, recently published results indicate that, at a consensus promoter, at saturating NTP concentrations, the rate-limiting step in abortive initiation is abortive-product release and RNAP-active-center reverse translocation (23).
Our results for abortive initiation receive unequivocal support from the companion paper, which analyzes abortive initiation using an independent single-molecule method: single-molecule fluorescence resonance energy transfer (in which scrunching is detected as a decrease in distance between the DNA segments upstream and downstream of the unwound region; 24).
Our second set of experiments addressed promoter escape in complexes engaged in productive initiation (complexes prepared in the presence of all four NTPs). For these experiments, we used DNA constructs having the N25 promoter, followed by a 400 bp or 100 bp transcribed region, followed by a terminator (N25-400-tR2 and N25-100-tR2; Fig. S7). These constructs allow us to monitor complete transcription cycles in the presence of all four NTPs--monitoring promoter unwinding, promoter escape, elongation, and termination, in real time. In addition, these constructs, due to the presence of a terminator, automatically recycle the DNA molecule, facilitating collection of large data sets (N>100). (After each transcription cycle, RNAP leaves the DNA molecule, rendering the DNA molecule available for the next transcription cycle.) For these experiments, we also used shorter DNA molecules (2 kb vs. 4 kb; Fig S8; see 22). This resulted in a decrease in noise and an increase in spatial and temporal resolution.
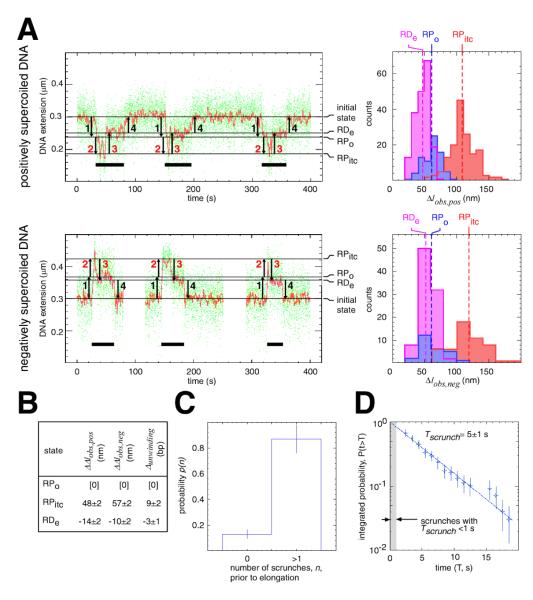
To determine whether scrunching occurs in productive initiation, we collected and analyzed single-molecule time traces in experiments with N25-400-tR2 and N25-100-tR2 in the presence of all four NTPs (Figs. 4, S9). Representative single-molecule time traces exhibit series of events, wherein each individual event corresponds to a complete transcription cycle--from promoter unwinding through termination (Figs. 4A, S9; events underscored in black). The events are remarkably uniform in duration and overall form (Figs. 4A, S9). (Struck by the uniformity of duration and form of the events, we refer to these time traces as “EKG strips of transcription.”) We parse each event into four unwinding and rewinding transitions: a first transition from the initial state to a state having the extent of unwinding in RPo, a second transition to a state having the extent of unwinding in the scrunched RPitc, a third transition to a state having an extent of unwinding comparable, but not identical, to that in the RPo, and a fourth transition returning to the initial state (Figs. 4A, S9, S10). We assign these four transitions to the formation of RPo, the formation of RPitc (with scrunching), the formation of RDe (with reversal of scrunching), and termination. Scrunching occurs in these events (Figs. 4A,B, S9, S10). Scrunching is manifest as the ”overshoot” in unwinding that follows formation of RPo and that precedes formation of RDe. The observed extent of scrunching is 9±2 bp (Fig. 4B), which agrees, to the base pair, with the predicted extent of scrunching under the N-2 rule (Fig. 3C). [Promoter escape at N25 occurs upon synthesis of an RNA product having a length, N, of 11 nt (Fig. S2B).] We conclude that scrunching occurs in promoter escape in productive initiation.
Fig. 4. Scrunching occurs in promoter escape in productive initiation.
(A) Single-molecule time traces and transition-amplitude histograms for complete transcription cycles on N25-400-tR2 in the presence of all four NTPs. Data for positively supercoiled DNA are at top; data for negatively supercoiled DNA are at bottom. Transcription cycles are indicated by horizontal black bars; unwinding and rewinding transitions are indicated by numbered arrows (red numbered arrows for scrunching and reversal of scrunching); and states are indicated by horizontal lines and labelled at the right of the time traces.
(B) Differences in Δlobs,pos, Δlobs,neg, and unwinding relative to values in RPo.
(C) Fraction of transcription cycles exhibiting at least one detectable scrunch (mean ± SEM; N = 100).
(D) Distribution of scrunch lifetimes (measured from midpoint of transition 2 to midpoint of transition 3; N = 100).
Extensive control experiments document the assignment of transitions in the preceding paragraph (Figs. S11-S14). If we perform experiments in the absence of NTPs, yielding RPo, we observe transition 1 only (Fig. S11A). If we perform experiments with an NTP subset that yields RPitc,≤8, we observe transitions 1 and 2 only (Fig. S11B). If we perform experiments with an NTP subset that yields a halted elongation complex, RDe,29, we observe transitions 1, 2, and 3 only (Fig. S11C). If we add back the remaining NTPs to any of the preceding cases, we observe the full process recapitulated, with full cycles of transcription (Fig. S11A-C). If we omit the terminator, we observe transitions 1, 2, and 3 only (Fig. S12). If we vary the length of the transcribed region, we vary the duration of the phase between transition 3 and transition 4--and we vary it according to a relationship suggesting an elongation rate of ~10 nt/s (which equals the expected elongation rate for the NTP concentration and temperature; 25-28) (Figs. S13, S14). Again, we conclude that scrunching occurs in promoter escape in productive initiation.
To determine whether scrunching occurs in few, many, or all, productive initiation events, we compared the number of transcription cycles that exhibit detectable scrunches to the number of transcription cycles that do not (Fig. 4C). Fully 80% of transcription cycles exhibit a detectable scrunch (Fig. 4C). Thus, most transcription cycles involve scrunching. This percentage, however, represents an underestimate, since the temporal resolution of our approach is insufficient to detect fast scrunches (scrunches that have a duration <1 s). From the observed distribution of scrunch lifetimes, we estimate that 20% of scrunches have a duration <1 s (Fig. 4D). Based on the percentage of transcription cycles that exhibit a detectable scrunch (80%) and the estimated percentage of scrunches that are not detected because they have a duration <1 s (20%), it is apparent that ~100% of transcription cycles involve scrunching. We conclude that scrunching occurs in all, or very nearly all, transcription cycles. We conclude further that scrunching may be obligatory for promoter escape in productive initiation.
Our overall conclusions are as follows: Abortive initiation involves scrunching. Promoter escape involves scrunching. Promoter escape may--and we believe does--involve obligatory scrunching. Promoter escape may--and we believe does--involve an obligatory “stressed intermediate,” as originally suggested two decades ago (9; see also 11).
At a typical promoter, promoter escape occurs only after synthesis of an RNA product ~9-11 nt in length (1-11) and thus can be inferred to require scrunching of ~7-9 bp (N-2 where N = ~9-11; see Fig. 3C). Assuming an energetic cost of base-pair breakage of ~2 kcal/mol/bp (29), it can be inferred that, at a typical promoter, a total ~14-18 kcal/mol of base-pair-breakage energy is accumulated in the stressed intermediate. This free energy is high relative to the free energies for RNAP-promoter interaction (~7-9 kcal/mol for sequence-specific component of RNAP-promoter interaction; 1) and RNAP-initiation-factor interaction (~13 kcal/mol for σ70; 30). We believe that our results demonstrate the existence of an obligatory stressed intermediate, and we believe that the energy accumulated in that obligatory stressed intermediate is the energy that drives disruption of interactions between RNAP and promoter DNA, that drives disruption of interactions between RNAP and initiation factors, and, thus, that drives the transition from initiation to elongation.
Supplementary Material
Acknowledgments
We thank S. Borukhov, L. Hsu, and E. Nudler for plasmids and discussion. This work was supported by Cold Spring Harbor, Centre National de la Recherche Scientifique, Fondation pour la Recherche Médicale, Fondation Fourmentin-Guilbert, European Molecular Biology Organization, City of Paris, and Universities of Paris VI and Paris VII grants to T.R.S. and by NIH grant GM41376 and a Howard Hughes Medical Investigatorship to R.H.E.
Abbreviations
- RNAP
RNA polymerase
- RPo
RNAP-promoter open complex
- RPitc
RNAP-promoter initial transcribing complex
- RDe
RNAP-DNA elongation complex
- NTPs
nucleoside triphosphates
Footnotes
Supporting Online Material www.sciencemag.org Materials and Methods Figs. S1-S15
References and Notes
- 1.Record MT, Reznikoff W, Craig M, McQuade K, Schlax P. In: Escherichia coli and Salmonella. Neidhart F, editor. vol. 1. ASM Press; Washington, D.C.: 1996. pp. 792–820. [Google Scholar]
- 2.Young B, Gruber T, Gross C. Cell. 2002;109:417–420. doi: 10.1016/s0092-8674(02)00752-3. [DOI] [PubMed] [Google Scholar]
- 3.Murakami K, Darst S. Curr. Opin. Structl. Biol. 2003;13:31–39. doi: 10.1016/s0959-440x(02)00005-2. [DOI] [PubMed] [Google Scholar]
- 4.Carpousis AJ, Gralla JD. Biochem. 1980;19:3245–3253. doi: 10.1021/bi00555a023. [DOI] [PubMed] [Google Scholar]
- 5.Grachev M, Zaychikov E. FEBS Lett. 1980;115:23–26. doi: 10.1016/0014-5793(80)80718-6. [DOI] [PubMed] [Google Scholar]
- 6.Munson L, Reznikoff W. Biochem. 1981;20:2081–2085. doi: 10.1021/bi00511a003. [DOI] [PubMed] [Google Scholar]
- 7.Carpousis A, Gralla J. J. Mol. Biol. 1985;183:165–177. doi: 10.1016/0022-2836(85)90210-4. [DOI] [PubMed] [Google Scholar]
- 8.Spassky A. J. Mol. Biol. 1986;188:99–103. doi: 10.1016/0022-2836(86)90484-5. [DOI] [PubMed] [Google Scholar]
- 9.Straney D, Crothers D. J. Mol. Biol. 1987;193:267–278. doi: 10.1016/0022-2836(87)90218-x. [DOI] [PubMed] [Google Scholar]
- 10.Krummel B, Chamberlin M. Biochem. 1989;28:7829–7842. doi: 10.1021/bi00445a045. [DOI] [PubMed] [Google Scholar]
- 11.Hsu L. Biochim. Biophys. Acta. 2002;1577:191–207. doi: 10.1016/s0167-4781(02)00452-9. [DOI] [PubMed] [Google Scholar]
- 12.Pal M, Ponticelli A, Luse D. Mol. Cell. 2005;19:101–110. doi: 10.1016/j.molcel.2005.05.024. [DOI] [PubMed] [Google Scholar]
- 13.Cheetham G, Jeruzalmi D, Steitz T. Nature. 1999;399:80–83. doi: 10.1038/19999. [DOI] [PubMed] [Google Scholar]
- 14.Cheetham G, Steitz T. Science. 1999;286:2305–2309. doi: 10.1126/science.286.5448.2305. [DOI] [PubMed] [Google Scholar]
- 15.Brieba L, Sousa R. EMBO J. 2001;20:6826–6835. doi: 10.1093/emboj/20.23.6826. [DOI] [PMC free article] [PubMed] [Google Scholar]
- 16.Jiang M, Rong M, Martin C, McAllister W. J. Mol. Biol. 2001;310:509–522. doi: 10.1006/jmbi.2001.4793. [DOI] [PubMed] [Google Scholar]
- 17.Liu C, Martin C. J. Biol. Chem. 2002;277:2725–2731. doi: 10.1074/jbc.M108856200. [DOI] [PubMed] [Google Scholar]
- 18.Esposito E, Martin C. J. Biol. Chem. 2004;279:44270–44276. doi: 10.1074/jbc.M407688200. [DOI] [PubMed] [Google Scholar]
- 19.Gong P, Esposito E, Martin C. J. Biol. Chem. 2004;279:44277–44285. doi: 10.1074/jbc.M409118200. [DOI] [PubMed] [Google Scholar]
- 20.Revyakin A, Allemand J-F, Croquette V, Ebright RH, Strick TR. Meths. Enzymol. 2003;370:577–598. doi: 10.1016/S0076-6879(03)70049-4. [DOI] [PubMed] [Google Scholar]
- 21.Revyakin A, Ebright RH, Strick TR. Proc. Natl. Acad. Sci. USA. 2004;101:4776–4780. doi: 10.1073/pnas.0307241101. [DOI] [PMC free article] [PubMed] [Google Scholar]
- 22.Revyakin A, Ebright RH, Strick TR. Nature Meths. 2005;2:127–138. doi: 10.1038/nmeth0205-127. [DOI] [PubMed] [Google Scholar]
- 23.Margeat E, et al. Biophys. J. 2006;90:1419–1431. doi: 10.1529/biophysj.105.069252. [DOI] [PMC free article] [PubMed] [Google Scholar]
- 24.Kapanidis A, et al. Science. (in press) [Google Scholar]
- 25.Wang M, et al. Science. 1998;282:902–907. doi: 10.1126/science.282.5390.902. [DOI] [PubMed] [Google Scholar]
- 26.Adelman K, et al. Proc. Natl. Acad. Sci. USA. 2002;99:13538–13543. doi: 10.1073/pnas.212358999. [DOI] [PMC free article] [PubMed] [Google Scholar]
- 27.Abbondanzieri E, Greenleaf W, Shaevitz J, Landick R, Block S. Nature. 2005;438:460–465. doi: 10.1038/nature04268. [DOI] [PMC free article] [PubMed] [Google Scholar]
- 28.Abbondanzieri E, Shaevitz J, Block S. Biophys. J. 2005;89:L61–L63. doi: 10.1529/biophysj.105.074195. [DOI] [PMC free article] [PubMed] [Google Scholar]
- 29.Breslauer K, Frank R, Blocker H, Marky L. Proc. Natl. Acad. Sci. USA. 1986;83:3746–3750. doi: 10.1073/pnas.83.11.3746. [DOI] [PMC free article] [PubMed] [Google Scholar]
- 30.Gill S, Weitzel S, von Hippel P. J. Mol. Biol. 1991;220:307–324. doi: 10.1016/0022-2836(91)90015-x. [DOI] [PubMed] [Google Scholar]
Associated Data
This section collects any data citations, data availability statements, or supplementary materials included in this article.


