Abstract
Endothelial nitric oxide synthase (eNOS) activity is tightly regulated by posttranscriptional modification and its subcellular localization. Here we examined whether insulin modulates nitric oxide (NO) production by regulating eNOS subcellular localization. We used confocal microscopy and immunoblots to examine the time course for 1) subcellular targeting/association of eNOS and caveolin-1 (CAV-1); 2) eNOS Ser1179 phosphorylation; and 3) NO production in cultured bovine aorta endothelial cells. Serum starvation increased eNOS/CAV-1 localization to the perinuclear region. Adding insulin provoked their prompt translocation to and association at the plasma membrane (PM). Specific monoclonal antibodies against either CAV-1 or eNOS coimmunoprecipitated the other from bovine aorta endothelial cell membrane extracts, and insulin increased this interaction. Insulin stimulated NO production transiently despite a persistent eNOS Ser1179 phosphorylation. The decline of NO production correlated temporally to insulin-induced translocation of eNOS and CAV-1 to PM. Knockdown of CAV-1 expression with a specific small interfering RNA duplex resulted in eNOS redistributing to the perinuclear region and nearly doubled insulin-induced NO production. Inhibition of phosphatidylinositol 3-kinase activity with wortmannin not only significantly inhibited insulin-induced translocation of eNOS and CAV-1 to PM but also blocked insulin-induced interaction of CAV-1 with eNOS at PM. Insulin increased incorporation of [3H]palmitic acid into eNOS immunoprecipitates by approximately 140%. Insulin-induced translocation of eNOS and CAV-1 to PM was palmitoylation dependent. Inhibiting eNOS and CAV-1 palmitoylation enhanced the NO production while blocking the translocation of eNOS and CAV-1 to PM induced by insulin. These data show that insulin acutely regulates eNOS and CAV-1 trafficking to PM of vascular endothelial cells where their interaction can regulate eNOS activity.
Insulin induces PI3K activity/palmitoylation-sensitive translocation and association of eNOS and caveolin-1 to the plasma membrane of vascular endothelial cells leading to regulation of nitric oxide production.
The endothelial isoform of nitric oxide synthase (NOS-3 or eNOS) plays a major role in vascular homeostasis through release of nitric oxide (NO). Its activity is tightly regulated by multiple intracellular processes including co- and posttranslational lipid modification, phosphorylation, and protein-protein interaction as well as the classical regulation by calcium-calmodulin (1,2). In cultured vascular endothelial cells, eNOS resides predominantly in association with the Golgi complex (3) and with plasmalemmal caveolae (4,5). It is increasingly appreciated that eNOS can traffic between different intracellular compartments and its subcellular targeting can affect NO production in response to various stimuli (6). Insulin, as well as other growth factors, is known to stimulate eNOS activity. We have shown that insulin’s action to dilate both resistance and terminal arterioles in skeletal muscle in vivo requires eNOS activation (7). We have also shown that at physiological concentrations, insulin phosphorylates eNOS at Ser1179 [corresponding to the serine1177 of human eNOS (8)] and increases its activity in bovine aorta endothelial cells (bAECs) (9). However, whether insulin affects eNOS subcellular targeting and, if so, the functional significance of such an action have not been examined.
Beyond its well-recognized salutary vascular actions, nitric oxide is a highly reactive radical that can be cytotoxic if its production is not tightly regulated (10). Caveolin-1 (CAV-1), a 21-kDa integral membrane protein and the marker protein of caveolae (11), has been identified as an intracellular physiological inhibitor of eNOS activity (12). Whether or not CAV-1 plays a role in insulin-induced NO production homeostasis is not clear.
In this study, we examined whether insulin influenced the subcellular distribution of eNOS in bAECs and whether the interaction between eNOS and CAV-1 might be involved in the regulation of eNOS activity after insulin stimulation.
Results
Insulin induces eNOS and CAV-1 translocation to and colocalization at the plasma membrane (PM)
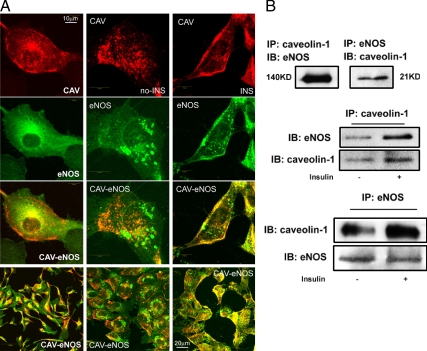
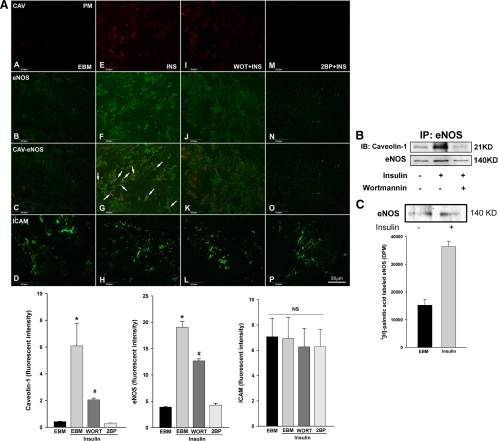
When bAECs were cultured in complete endothelial cell growth medium, eNOS was found predominantly in the perinuclear region and at discrete sites on the PM (Fig. 1A, left column). This is consistent with its Golgi (3) and caveolar (4) localization reported previously. Double labeling revealed overlap of eNOS with CAV-1 in the perinuclear region, and partial overlap in regions on the PM (Fig. 1A, left column). Serum starvation shifted both CAV-1 and eNOS away from the PM (Fig. 1A, middle column), and each appeared scattered in the cytosol, with little colocalization. In addition to an altered distribution, CAV-1 and eNOS each exhibited a coarse pattern of staining with some areas becoming patch-like plaques (Fig. 1A, middle column) consistent with a previous finding that serum deprivation up-regulates the expression of Golgi alkaline ceramidase causing Golgi fragmentation (13). However, within 30 min of adding insulin, both CAV-1 and eNOS translocated to the PM (Fig. 1A, right column). Additionally, we prepared PM sheets in which cells were disrupted by sonication in hypotonic media yielding fields of PM devoid of nuclei (see Fig. 5A, images A–H). Insulin treatment induced a striking increase of both CAV-1 and eNOS staining of PM sheets where they extensively colocalized (Fig. 5A, images A–H; also see Fig. 1A, right column).
Figure 1.
Insulin induces translocation of CAV-1 and eNOS to the PM and increases the interaction of CAV-1 with eNOS in the membrane. A, Double staining for CAV-1 (red) and eNOS (green). Left column, bAECs cultured in the full medium; center column, serum starved in the basal medium; right column, treated with 10 nm insulin after the serum deprivation. B, The aliquots of membrane extracts were immunoprecipitated followed by Western blots for either eNOS or CAV-1. Top panel, Cultured in full medium; middle and bottom panels, ±10 nm insulin after serum deprivation. Data shown are representative of three to five independent experiments. IB, Immunoblot; IP, immunoprecipitation; KD, kilodalton.
Figure 5.
Wortmannin inhibits insulin-induced trafficking and association of CAV-1 and eNOS at the PM whereas inhibition of Golgi-localized acyltransferase abrogates insulin-induced translocation of both CAV-1 and eNOS to the PM. A, After serum-starvation for 16 h, cells were treated with 10 nm insulin for 30 min ± 100 nm wortmannin (WOT) or 100 μm 2-BP. PM sheets were prepared followed by double staining for CAV-1 (red) and eNOS (green) or intercellular adhesion molecule-1 (ICAM) (used as a control) (green). Top panel, Representative confocal images (single optical sections) from three independent experiments: first column, serum-starved in the basal medium (EBM); second column, treated with 10 nm insulin (INS) after the serum deprivation; third column, pretreated with wortmannin (WORT) followed by treatment of 10 nm insulin (arrows point to areas of colocalization); fourth column, pretreated with 2-BP followed by treatment with 10 nm insulin; bottom panels, the quantification of changes in the fluorescence intensity (n = 3). B, bAECs were treated with 10 nm insulin ± 100 nm wortmannin for 30 min after serum deprivation and then lysed, and membrane fractions were extracted. Aliquots of the membrane fraction containing equal amount of protein were immunoprecipitated using a monoclonal antibody against eNOS followed by Western blots detecting CAV-1 or eNOS (after stripping). Blots shown are representative of three independent experiments. C, After serum starvation for 16 h, cells were treated with [3H]palmitate ± 10 nm insulin for 30 min and eNOS immunoprecipitated followed by either Western blotting for eNOS (upper panel) or counted using a scintillation counter (bottom panel). Experiments were repeated once. IP, Immunoprecipitation; KD, kilodalton.
We next examined whether insulin altered the ability of monoclonal antibodies against CAV-1 or eNOS to coimmunoprecipate one another using membrane fractions of bAEC lysates. As shown in Fig. 1B (top panel), antibodies against each protein coimmunoprecipitated the other. In addition, adding insulin to serum-deprived cells increased the amount of eNOS immunoprecipitated by an antibody against CAV-1 from the membrane fraction of bAECs (Fig. 1B, middle panel). Similarly, the amount of CAV-1 brought down by an antibody against eNOS also increased after insulin treatment (Fig. 1B, bottom panel). Because CAV-1 and eNOS appear to separately localize in different compartments in Golgi complex (14), it is likely that this interaction of membrane-associated CAV-1 and eNOS occurs predominantly in the PM rather than in Golgi complex.
Insulin induces a persistent increase in eNOS Ser1179 phosphorylation but only a transient stimulation of NO production
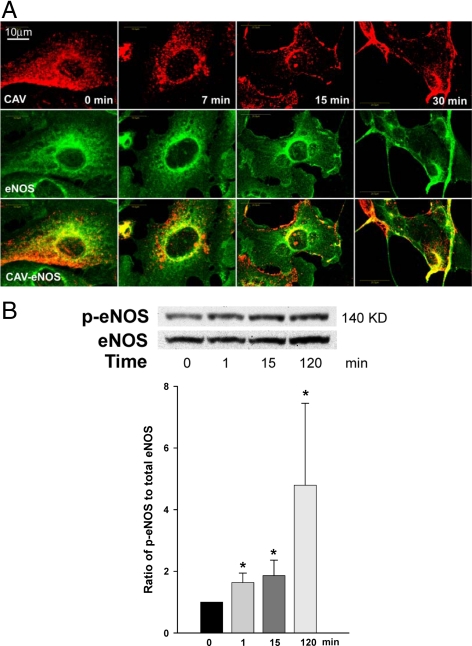
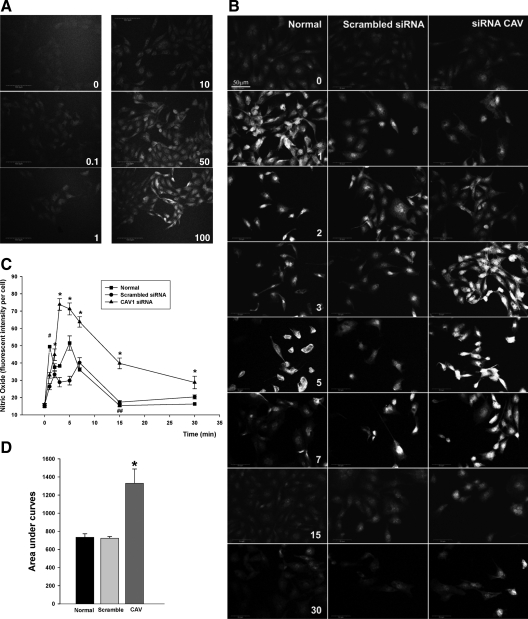
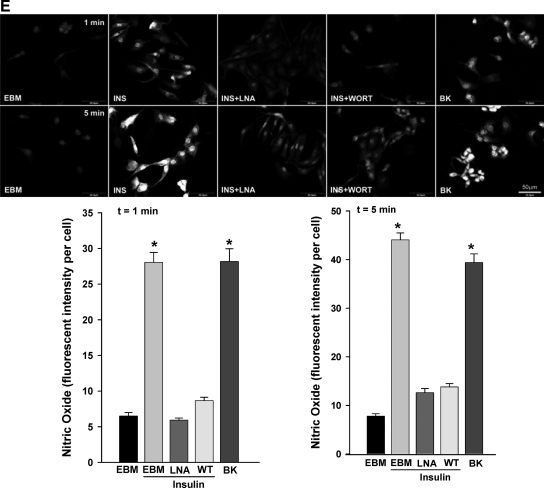
We next compared the time course for insulin-induced translocation of eNOS and CAV-1 to the PM with that for insulin-induced eNOS Ser1179 phosphorylation. Figure 2A shows that CAV-1 and eNOS were initially predominantly cytosolic in serum-starved bAECs. However, by 15 min after insulin addition, each displayed a distinct localization to the PM. Insulin increased the phosphorylation of eNOS at Ser1179 (Fig. 2B) within the first 1 min, and this persisted for at least 2 h. We next addressed the temporal relationships between insulin-induced eNOS and CAV-1 trafficking and NO production in bAECs. Insulin stimulated NO production in a dose-dependent manner (Fig. 3A). Fig. 3, B and C, illustrates the time-course of insulin-stimulated NO production in serum-starved cells. After adding insulin, NO production rapidly increased in a biphasic fashion (first peak appeared at 1 min followed by a quick decline and peaked again at 5 min) and subsequently declined back to the basal by 15 min (Fig. 3B, left column and 3C, normal). A transient time course of insulin-stimulated NO production has previously been reported by others (15). However, the complex character of this has not previously been noted. Pretreatment with either 100 μm N(G)-nitro-l-argine methyl ester (l-NAME) or 100 nm wortmannin almost completely abolished insulin-induced NO production (Fig. 3E).
Figure 2.
A, Dynamic changes in subcellular targeting of CAV-1 and eNOS after insulin stimulation. After being serum deprived for 16 h, cells were treated with 100 nm insulin for 0, 7, 15, and 30 min, respectively. Double staining for CAV-1 (red) and eNOS (green). Representative single optical sections were acquired from same Z step size. B, Time course of eNOS phosphorylation (p-eNOS) at Ser1179 after 100 nm insulin stimulation after serum deprivation. Top panel, Representative blots from four independent experiments; bottom panel, shown is the quantification of changes (n = 4). *, P < 0.05 compared with the value at 0 min. KD, Kilodalton.
Figure 3.
Insulin-stimulated NO production in cultured bAECs. bAECs with or without transfection of either Cav1-siRNA (CAV) or scrambled siRNA duplex were preincubated with 10 μm DAF-2DA for 20 min followed by insulin treatment after the serum deprivation. A, Dose response of NO production to insulin stimulation. Cells were treated with 0, 0.1, 1, 10, 50, and 100 nm insulin, respectively, for 3 min before confocal imaging. B, Representative images from three independent time course experiments of insulin-stimulated NO production. Cells were treated with 100 nm insulin for 0, 1, 2, 3, 5, 6, 7, 15, and 30 min, respectively, before processed for the imaging. Graphs indicate quantitation of insulin-stimulated NO production (C) and the area under curves (D) in time course experiments. A total of 30 cells were counted at each time point for each treatment, and three independent experiments have been performed. E, The effects of l-NAME or wortmannin on the insulin-stimulated NO production after insulin treatment for 1 min and 5 min, respectively. Top panel, Representative images from three independent experiments; bottom panel, quantification of changes (n = 3). EBM, Incubation with the basal medium only; INS, insulin treatment only; INS+LNA, pretreatment with l-NAME for 30 min followed by insulin treatment; INS+WORT, pretreatment with wortmannin for 30 min followed by insulin treatment; BK, bradykinin (1 μm, Calbiochem) treatment only used as a positive control. *, P < 0.05 compared with EBM, INS+LNA, or INS+WORT. Values are means ± se. *, P < 0.05 compared with scrambled siRNA at corresponding time point. #, P < 0.05 compared with 0 or 2 or 3 min value with same treatment and compared with scrambled siRNA at the same time point, and P > 0.05 compared with 5 min value with same treatment. ##, P > 0.05 compared with 0 min value with same treatment or scrambled siRNA at the same time point. WT, Wild type.
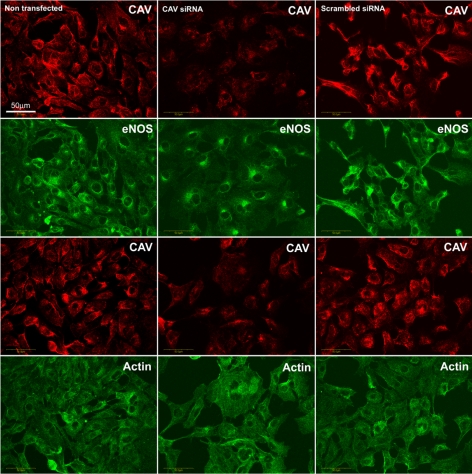
We next assessed whether CAV-1 regulated insulin-stimulated eNOS trafficking and NO production by manipulating the expression of CAV-1 using small interfering RNA (siRNA) directed against CAV-1. Compared with control, transfection of bAECs with 30 nm siRNA duplex against CAV-1 (Cav1-siRNA) significantly reduced CAV-1 expression as measured by Western blotting by an average of 72% (P < 0.05) (supplemental Fig. 1 published as supplemental data on The Endocrine Society’s Journals Online web site at http://mend.endojournals.org). Immunocytochemical staining also demonstrated that transfection of Cav1-siRNA strikingly reduced CAV-1 immunostaining. Interestingly, although the protein expression of both eNOS and β-actin appeared unchanged, eNOS tended to distribute more in the perinuclear (Golgi complex) area and less in the plasmalemma in Cav1-siRNA-transfected cells (Fig. 4) consistent with the previous observation that PM caveolae are a major targeting site of eNOS. Knockdown of CAV-1 was associated with significantly enhanced insulin-stimulated NO production, which peaked at 3 min and remained above both nontransfected and scrambled siRNA controls (Fig. 3B, right column and 3C, Cav1-siRNA). The area under the curve of insulin-stimulated NO production in Cav1-siRNA group was almost twice that of either nontransfected or scrambled-siRNA groups (P < 0.05 for each; Fig. 3D). These results are consistent with CAV-1 acting as a physiological inhibitor of eNOS activity (12) and suggest that it may limit insulin-stimulated NO production.
Figure 4.
siRNA-mediated specific inhibition of CAV-1 expression and redistribution of eNOS. bAECs were transfected with either Cav1-siRNA or control siRNA for 48 h before fixation for double immunocytochemical staining. Confocal images (single optical section) were obtained. CAV-1 (CAV) was revealed by Cy3 (red) and eNOS or β-actin (actin) was revealed by Cy2 (green). Images shown are representative of three independent experiments.
Inhibiting phosphatidylinositol 3-kinase (PI3K) or eNOS/CAV-1 palmitoylation inhibits the translocation of CAV-1 and eNOS to the PM
Because the PI3K-Akt pathway is responsible for insulin-induced eNOS phosphorylation, we examined the effect of wortmannin, which inhibits insulin signaling through PI3K-Akt, on eNOS and CAV-1 translocation and their association on the PM. Immunocytochemically, using PM sheets, we noted that wortmannin significantly inhibited the insulin-stimulated translocation of both CAV-1 and eNOS to the PM and appeared to blunt the insulin-stimulated colocalization of eNOS and CAV-1 at PM (Fig. 5A, images A–L, and bottom panel; also see supplemental Fig. 2). Using coimmunoprecipitation, we found that inhibition of PI3K with wortmannin abolished insulin-stimulated interaction between CAV-1 and eNOS in the PM (Fig. 5B).
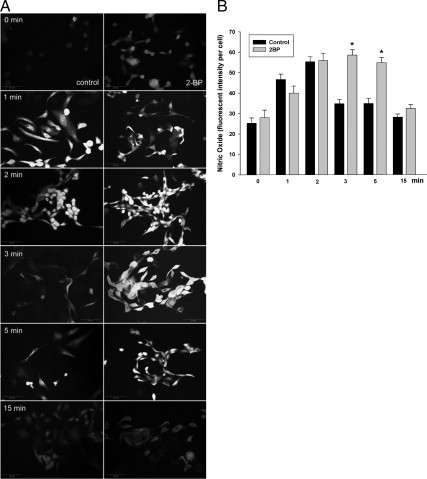
It has been reported that palmitoylation of eNOS and CAV-1 targets them to the plasmalemma caveolae (4,16), and this process may be regulated by the Golgi-localized palmitoylacyltransferase (17). We examined the effects of pretreatment of serum-starved bAECs with 2-bromopalmitate (2-BP) [a specific inhibitor of palmitoylacyltransferases (18)] on insulin-stimulated eNOS/CAV-1 subcellular distribution and NO production. We found that pretreatment of cells with 2-BP for 15 min almost completely abolished insulin-induced translocation of both CAV-1 and eNOS to the PM but did not appear to affect their basal cellular distribution (Fig. 5A, upper panel, images A–H and M–P, and bottom panel; also see supplemental Fig. 2). We also found that insulin treatment increased the incorporation of [3H]palmitic acid into eNOS immunoprecipitates by approximately 140% compared with the control (Fig. 5C), suggesting that insulin may activate the palmitoylacyltransferases (17) to promote the palmitoylation of eNOS. Interestingly, pretreatment of cells with 2-BP significantly enhanced NO production [NO production by ∼70% and ∼60% at 3 and 5 min, respectively, after insulin stimulation (P < 0.05 for each) (Fig. 6, A and B)]. These data suggest that the palmitoylation of CAV-1 and eNOS is required for their insulin-induced subcellular targeting to the PM. It is also consistent with the hypothesis that insulin-induced translocation/association of eNOS and CAV-1 in the caveolae is critical for limiting insulin-stimulated NO production.
Figure 6.
Inhibition of Golgi-localized acyltransferase enhances insulin-stimulated NO production. bAECs were treated with 10 nm insulin ± 100 μm 2-BP for 30 min after the serum deprivation. A, Representative images from three independent time course experiments of insulin-stimulated NO production. B, Graph indicates quantitation of insulin-stimulated NO production. *, P < 0.05 compared with normal control at corresponding time point.
Discussion
The findings reported here suggest that insulin can regulate eNOS activity by mechanisms beyond its well-described effect to increase eNOS serine1179 phosphorylation. This study provides clear evidence for insulin-directed subcellular trafficking of eNOS and CAV-1, and their interaction at the PM can also modulate insulin-stimulated NO production. It is notable that the cytosolic localization of eNOS and CAV-1 increased dramatically with overnight serum starvation. The rapidity with which insulin promoted eNOS and CAV-1 movement to the PM was striking. This translocation was accompanied by a concomitant decline of insulin-stimulated eNOS activity despite a persistent increased eNOS Ser 1179 phosphorylation. Because CAV-1 can associate with and directly inhibit eNOS activity via protein-protein interaction, their colocalization at the PM may be modulating eNOS activity. The increased association of eNOS and CAV-1 in membrane fractions as assessed by coimmunoprecipitation is consistent with the morphological finding of their translocation to the PM. The observation that siRNA knockdown of CAV-1 protein expression dramatically enhanced insulin-stimulated eNOS activity and shifted eNOS away from the PM to the perinuclear area is also consistent with CAV-1 playing a regulatory role in insulin trafficking and in limiting insulin-stimulated eNOS activity.
There appear to be two principal cellular pools of eNOS and CAV-1, a perinuclear (Golgi) pool and a PM pool, in endothelial cells cultured in growth media (3,5). The CAV-1 and eNOS overlap in the perinuclear region, as seen by immunocytochemistry in the present study, need not imply that they are present in the same Golgi compartment (Fig. 1A, middle column) because they redistribute differently when cells are treated with the microtubule-depolymerizing agent nocodazole (14). Thus, the findings in the present study, that after insulin treatment eNOS and CAV-1 coimmunoprecipitate with each other in the membrane fraction (19), suggest a close physical proximity between them in the PM.
The redistribution of eNOS reported here with serum starvation is reminiscent of that recently reported to occur in renal cortical tissue with streptozotocin-induced diabetes. Diabetes induced both eNOS and CAV-1 movement from the PM to the cytosol and decreased NO bioavailability. Streptozotocin-diabetes also interfered with the dimerization of eNOS and diminished CAV-1 expression. These effects were reversed by intensive insulin treatment in vivo (20). We demonstrated in the present study that insulin acted rapidly to translocate both CAV-1 and eNOS from the cytosol to the PM in overnight serum-deprived bAECs and promoted their physical association as shown by the coimmunoprecipitation studies. These findings suggest that serum deprivation (which includes insulin deficiency) changes the cellular distribution of both CAV-1 and eNOS, and insulin acutely reverses this effect. Given that the caveolar targeting of both CAV-1 and eNOS is controlled by their palmitoylation (4,16), their displacement from the PM may arise from inhibition of palmitoylation of newly synthesized eNOS and CAV-1 proteins when serum deprived (21,22).
The regulation of eNOS activity is complex and affected by multiple posttranslational modifications. Interestingly, in present study a biphasic response of NO production to insulin stimulation was observed initially after insulin treatment (Fig. 3C). It has been reported that in addition to the regulation of its phosphorylation, eNOS is also dynamically regulated by S-nitrosylation, which inhibits its activity (23). eNOS is S nitrosylated in the basal state and is rapidly denitrosylated upon insulin stimulation. This agonist-induced eNOS denitrosylation appears to be very transient, and the rapid increase in NO-derived nitrosyl groups induced by insulin stimulation results in eNOS renitrosylation (23). Thus, the initial transient decline of NO production observed within 5 min after insulin treatment in the present study may be attributed to the renitrosylation of eNOS.
A significant finding in the present study relates to the effect of CAV-1 interacting with eNOS to limit the insulin-stimulated increase of NO production. The transient nature of insulin-induced NO production by cultured endothelial cells measured in situ has been noted previously (15). We found that whereas the initial increase of insulin-induced NO production could be attributed to a rapid insulin-induced eNOS Ser1179 phosphorylation, NO production rapidly waned despite persistent eNOS Ser1179 phosphorylation. A similar dissociation between eNOS activation and its phosphorylation at Ser1179 has been reported in the arterial wall of high-fat fed diabetic mice where eNOS protein dimerization (required for activity) was markedly diminished although Ser1179 phosphorylation was preserved (24). We have also recently shown that TNF-α blunts insulin-mediated eNOS activity but not eNOS Ser1179 phosphorylation (25). The finding that insulin-induced CAV-1 and eNOS translocation to the PM appeared to parallel the decline in NO production is consistent with the hypothesis that the interaction of eNOS with CAV-1 on the PM may act to limit insulin-stimulated NO production. Certainly the increase in NO production we observed in response to either siRNA knockdown of CAV-1 or inhibition of palmytoylation of eNOS and CAV-1 would be consistent with such a regulatory mechanism for NO homeostasis.
The mechanism by which insulin stimulates both eNOS and CAV-1 translocation onto the PM is not understood. The PI3K-Akt pathway in endothelial cells has been recognized to mediate insulin-induced eNOS activation. Inhibition of PI3K-Akt pathway using wortmannin certainly inhibited insulin-stimulated NO production (Fig. 3E). Insulin’s signaling via the PI3K-Akt pathway appeared to be necessary for the translocation and interaction of eNOS and CAV-1 on the PM because pretreatment with the PI3K inhibitor wortmannin abrogated the effect of insulin to promote the translocation and association of CAV-1 and eNOS on the PM. The mechanism by which wortmannin inhibits the translocation and association of eNOS and CAV-1 is not clear. However, wortmannin’s inhibitory effect on the association of eNOS with CAV-1 may be attributed, at least in part, to its inhibitory effects on insulin-induced eNOS/CAV-1 translocation to the PM (Fig. 5A). The lipid product of PI3K, PI (3,4,5)P3 has recently been shown to recruit a subset of signaling proteins with pleckstrin homology domains, such as phosphoinositide-dependent kinase 1 and Akt, to the PM. Serum-stimulated Akt translocation from cytosol to the PM is completely blocked by pretreatment with the PI3K inhibitor wortmannin (26). Because Akt is a known eNOS-interacting protein (27,28), abolishing Akt’s recruitment to the PM by wortmannin may, in turn, influence eNOS targeting to the PM and its association with CAV-1 on the PM. Moreover, the eNOS phosphorylation induced by insulin (15) may result in a conformational change to increase its association with CAV-1 on the PM. Thus, inhibition of eNOS phosphorylation by wortmannin may reduce its association with CAV-1 on the PM. These possibilities warrant further studies to clarify them.
Previous study has shown that palmitoylation of both eNOS and CAV-1 is controlled by the Golgi-localized palmitoylacyltransferase (17). This acylation of CAV-1 and eNOS targets them to the PM (4,16). In the present study, we observed that insulin increased the incorporation of [3H]palmitic acid into eNOS immunoprecipitates, suggesting that insulin may activate the Golgi-localized palmitoylacyltransferase to promote eNOS palmitoylation. We also observed that inhibition of palmitoylation of eNOS and CAV-1 blocked their trafficking and association at the PM and also enhanced insulin-stimulated NO production, suggesting that stimulation of eNOS and CAV-1 palmitoylation may be a potential control site for insulin-induced eNOS/CAV-1 trafficking to the PM and regulation of insulin-stimulated eNOS activity.
The regulation of NO production by CAV-1 is quite complex (1,2). It is closely related to the physical interaction of eNOS with CAV-1 and significantly affected not only by the subcellular location of eNOS and CAV-1 but also by the ratio of relevant amounts of CAV-1 to eNOS in the caveolae (29,30). In the present study, we found that knockdown of CAV-1 protein expression by approximately 70% doubled insulin-stimulated NO production. Previous in vivo studies have suggested that this enhanced NO production, related to either CAV-1 deficiency (CAV-1−/− mice) or CAV-1 down-regulation (RNA interference), was associated with increased eNOS activity (31,32).
The activation of eNOS depends on both its subcellular location and agonist stimulation (30,33). In the current study, a more complex pattern of eNOS regulation by eNOS trafficking was observed. Here, serum starvation clearly altered the typical basal cellular distribution of eNOS and CAV-1 at the PM and Golgi. However, acute insulin stimulation increased eNOS Ser1179 phosphorylation and NO production and induced a clear movement of both eNOS and CAV-1 to the PM. This movement was accompanied by a parallel decline of NO production. On the other hand, both knockdown of CAV-1 expression and inhibition of eNOS/CAV-1 palmitoylation increased insulin-stimulated NO production. Together, these findings indicate that the intracellular trafficking of eNOS/CAV1 and the interaction between eNOS and CAV-1 at the PM induced by insulin stimulation play a crucial role in limiting insulin-stimulated NO production.
In summary, our data confirm that insulin induces a persistent phosphorylation of eNOS at Ser1179 but only a transient increase in enzyme activity. We find that insulin also regulates eNOS and CAV-1 trafficking in vascular endothelial cells by promoting their movement to the PM via a PI3K-Akt activity-sensitive and palmitoylation-dependent process. This insulin-induced trafficking and association of eNOS and CAV-1 at the PM may constitute a new mechanism that limits NO production under physiological conditions in response to acute insulin stimulation.
Materials and Methods
Cell culture
bAECs were cultured as previously described (34,35). Cells were incubated in serum-free basal medium for 16 h to enhance their sensitivity to insulin stimulation (9) and then treated with 10 or 100 nm insulin (Eli Lilly & Co., Indianapolis, IN). When added, l-NAME (100 μm) or wortmannin (100 nm) or 2-BP (100 μm) (Sigma Aldrich, Inc., St. Louis, MO) was preincubated for 30 min or 15 min (for 2-BP), respectively, before adding insulin.
siRNA design and transfection
A specific siRNA duplex directed against the target sequence: 5′-CAGAAGGAACACACAGTTT-3′ that corresponds to bases 224-242 from the open reading frame of bovine CAV-1 mRNA and a scrambled siRNA control were purchased from Dharmacon, Inc. (Lafayette, CO). Cells were seeded and transfected when they reached 30 to approximately 50% confluence with siRNA duplex to a final concentration of 30 nm using Oligofectamine (Invitrogen, Carlsbad, CA). Cells were serum-starved 48 h after transfection for 16 h followed by insulin treatment.
Measurement of NO production
Although a number of methods (29,25) can be used to measure NO production, most are limited with regard to assessing a time course for NO production in intact cells. Here we used a bioimaging approach that has already been proven to be specific and reliable in evaluating dynamic changes of NO production in living endothelial cells (15,36,37). After 16 h of serum starvation, bAECs were preincubated for 20 min with 10 μm 4, 5-diaminofluorescein diacetate (DAF-2DA). DAF-2DA loaded cells were treated with insulin for varying times and then fixed for confocal microscopic examination. Fluorescence intensity of individual cells reflecting NO production was quantified using NIH Image J software as previously described (35).
PM sheet preparation
PM sheets were prepared as previously described (38). Briefly, bAECs were cultured on a coverslip in the well of six-well plates and treated as described above. The cells were washed once with ice-cold PBS followed by incubation on ice with 0.5 mg/ml of poly-l-lysine in PBS for 30 sec. The cells were then washed three times with ice-cold hypotonic buffer (23 mm KCl; 10 mm HEPES, pH 7.5; 2 mm MgCl2; 1 mm EEGTA). The swollen cells were then sonicated for 3 sec (550 Fisher sonic dismembrator; Fisher Scientific, Pittsburgh, PA) in ice-cold sonication buffer (70 mm KCl; 30 mm HEPES, pH 7.5; 5 mm MgCl2; 3 mm EGTA; 1 mm dithiothreitol; 0.1 mm phenylmethylsulfonyl fluoride) followed by two washes with the ice-cold sonication buffer and used for immunocytochemical staining (see below).
Palmitate labeling
After bAECs were incubated in serum-free basal medium for 16 h, cells were treated with 300 μCi/ml [3H]palmitic acid (PerkinElmer, Wellesley, MA) in the presence or absence of 10 nm insulin for 30 min. The cells were then processed for immunoprecipitation using a monoclonal primary antibody against eNOS (BD Transduction Laboratories, Inc., Lexington, KY) (see below). The eNOS immunoprecipitates labeled by [3H]palmitate were either used for Western blotting or counted in a LS 6500 scintillation counter (Beckman Instruments, Inc., Fullerton, CA).
Coimmunoprecipitation
To assess the interaction of CAV-1 and eNOS in the membrane, membranous fractions were obtained using Mem-PER Eukaryotic Membrane Protein Extraction Reagent Kit (Pierce Chemical Co., Rockford, IL) (39,40). Immunoprecipitation was performed as described previously (34). Briefly, aliquots of the membrane fraction or the lysates from palmitate labeling experiments normalized for equal protein concentration (containing 300–500 μg protein for each) in 1 ml of lysis buffer were incubated with 25 μl monoclonal primary antibody against either eNOS (BD Transduction Laboratories) or CAV-1 (BD Transduction Laboratories) overnight at 4 C. Protein A/G plus IgG-agarose (Santa Cruz Biotechnology, Inc., Santa Cruz, CA) was then added. The mixture was kept at 4 C for 1 h with gentle rocking and then sedimented at 10,000 × g for 30 sec. After washing six times with lysis buffer, the beads were sedimented, resuspended in 50 μl 2× sample buffer, and boiled for 5 min. The immunoprecipitates were electrophoresed and processed for Western blotting as described below. The specificity of the applied monoclonal primary antibodies was validated by using mouse IgG (Santa Cruz Biotechnology).
Immunoblotting
As described previously (34), equal protein-containing cell lysates were diluted with 2× sample buffer and boiled for 5 min. The loaded samples were then electrophoresed on an 8% or 15% polyacrylamide gel and transferred to nitrocellulose membranes. After being blocked with 5% low-fat milk in Tris-buffered saline plus Tween 20, membranes were incubated with antibody against either eNOS (Cell Signaling Technology, Beverly, MA; 1:1000) or CAV-1 (Santa Cruz Biotechnology; 1:500) followed by incubation with a species-specific secondary antibody coupled to horseradish peroxidase (Amersham Life Sciences, Piscataway, NJ; 1:2000), and the blots were developed using an enhanced chemiluminescence Western blotting kit (Amersham Life Sciences). Some blots were reprobed after stripping with a stripping buffer (Pierce Chemical Co.) for 15 min.
Immunocytochemistry
The double-staining protocols were the same as described previously (34,35). Briefly, the methanol-fixed bAECs in the slide chamber were washed three times in Tris-buffered saline (TBS), permeabilized in TBS containing 0.05% Triton X-100 and 1% horse or goat serum for 30 min at room temperature, and incubated with two different primary antibodies against two different target proteins (double labeling) overnight at 4 C. The following primary antibodies were used: rabbit polyclonal antibody against CAV-1 (Santa Cruz Biotechnology, Inc.; 1:200) or the mouse monoclonal anti-CAV-1 (1:50); rabbit polyclonal (1:100), or mouse monoclonal anti-eNOS (1:100) (all from BD Transduction Laboratories). The cells were washed three times in TBS and then incubated with species-specific secondary antibodies conjugated with a fluorochrome Cy2 or Cy3 (Jackson ImmunoResearch Laboratories, Inc., West Grove, PA) at 1:200 dilutions for 45 min at room temperature. The cells were washed three times in TBS, and then coverslipped with the antifade mounting medium. For the PM sheet preparation, slides were coverslipped with the mounting medium containing 4′,6-diamidino-2-phenylindole for examination of nuclear staining using conventional fluorescent microscope before confocal microscopy.
Imaging
The double immunocytochemical labeling was examined using a two-color Olympus Fluoview BX50 WI confocal microscope (Olympus Corp., Lake Success, NY) equipped with Krypton and Argon lasers as described previously (34,35). Briefly, an x-y-z axis scanning method was employed. To determine the subcellular distribution of eNOS and CAV-1, a series of optical sections with same step size, and same “start Z” and “stop Z” were obtained along the z-axis from each experimental group and saved individually, after which the single optical section with same “Z” step from respective group was presented and used for comparison between groups. To quantify fluorescence intensity of the staining from PM sheets, the images from randomly selected microscopic fields containing stained PM sheets were outlined, and the integrated fluorescence intensities were measured using the Image J software. Digital images were processed identically with Adobe Photoshop (Adobe Systems, San Jose, CA).
Statistical analysis
Data are presented as mean ± sem. Statistical comparisons among different groups were made using one-way ANOVA with Student-Newman-Keuls post hoc testing or two-way ANOVA with Holm-Sidak all pair-wise multiple comparison procedures. Statistical significance is defined as P ≤ 0.05.
Supplementary Material
Footnotes
This work was supported by National Institutes of Health Grants DK057878 and DK073059 (to E.J.B.), the American Diabetes Association (07-CR-34) (to Z.L.), and P30-DK063609 to the University of Virginia Diabetes Endocrinology Research Center.
A part of this work was presented in abstract form at the 66th Annual Meeting of The American Diabetes Association, June 9–13, 2006, Washington, DC.
Disclosure Summary: The authors have nothing to disclose.
First Published Online July 16, 2009
Abbreviations: bAECs, Bovine aorta endothelial cells; 2-BP, 2-bromopalmitate; CAV-1, caveolin-1; DAF-2DA, 4,5-diaminofluorescein diacetate; eNOS, endothelial nitric oxide synthase; l-NAME, N(G)-nitro-l-argine methyl ester; NO, nitric oxide; PI3K, phosphatidylinositol 3-kinase; PM, plasma membrane; siRNA, small interfering RNA; TBS, Tris-buffered saline.
References
- Dudzinski DM, Igarashi J, Greif D, Michel T 2006 The regulation and pharmacology of endothelial nitric oxide synthase. Annu Rev Pharmacol Toxicol 46:235–276 [DOI] [PubMed] [Google Scholar]
- Fulton D, Gratton JP, Sessa WC 2001 Post-translational control of endothelial nitric oxide synthase: why isn’t calcium/calmodulin enough? J Pharmacol Exp Ther 299:818–824 [PubMed] [Google Scholar]
- Sessa WC, García-Cardeña G, Liu J, Keh A, Pollock JS, Bradley J, Thiru S, Braverman IM, Desai KM 1995 The Golgi association of endothelial nitric oxide synthase is necessary for the efficient synthesis of nitric oxide. J Biol Chem 270:17641–17644 [DOI] [PubMed] [Google Scholar]
- Shaul PW, Smart EJ, Robinson LJ, German Z, Yuhanna IS, Ying Y, Anderson RG, Michel T 1996 Acylation targets endothelial nitric-oxide synthase to plasmalemmal caveolae. J Biol Chem 271:6518–6522 [DOI] [PubMed] [Google Scholar]
- García-Cardeña G, Oh P, Liu J, Schnitzer JE, Sessa WC 1996 Targeting of nitric oxide synthase to endothelial cell caveolae via palmitoylation: implications for nitric oxide signaling. Proc Natl Acad Sci USA 93:6448–6453 [DOI] [PMC free article] [PubMed] [Google Scholar]
- Oess S, Icking A, Fulton D, Govers R, Müller-Esterl W 2006 Subcellular targeting and trafficking of nitric oxide synthases. Biochem J 396:401–409 [DOI] [PMC free article] [PubMed] [Google Scholar]
- Vincent MA, Clerk LH, Lindner JR, Klibanov AL, Clark MG, Rattigan S, Barrett EJ 2004 Microvascular recruitment is an early insulin effect that regulates skeletal muscle glucose uptake in vivo. Diabetes 53:1418–1423 [DOI] [PubMed] [Google Scholar]
- Fulton D, Fontana J, Sowa G, Gratton JP, Lin M, Li KX, Michell B, Kemp BE, Rodman D, Sessa WC 2002 Localization of endothelial nitric-oxide synthase phosphorylated on serine 1179 and nitric oxide in Golgi and plasma membrane defines the existence of two pools of active enzyme. J Biol Chem 277:4277–4284 [DOI] [PubMed] [Google Scholar]
- Li G, Barrett EJ, Wang H, Chai W, Liu Z 2005 Insulin at physiological concentrations selectively activates insulin but not insulin-like growth factor I (IGF-I) or insulin/IGF-I hybrid receptors in endothelial cells. Endocrinology 146:4690–4696 [DOI] [PubMed] [Google Scholar]
- Cirino G, Fiorucci S, Sessa WC 2003 Endothelial nitric oxide synthase: the Cinderella of inflammation? Trends Pharmacol Sci 24:91–95 [DOI] [PubMed] [Google Scholar]
- Rothberg KG, Heuser JE, Donzell WC, Ying YS, Glenney JR, Anderson RG 1992 Caveolin, a protein component of caveolae membrane coats. Cell 68:673–682 [DOI] [PubMed] [Google Scholar]
- Michel JB, Feron O, Sacks D, Michel T 1997 Reciprocal regulation of endothelial nitric-oxide synthase by Ca2+-calmodulin and caveolin. J Biol Chem 272:15583–15586 [DOI] [PubMed] [Google Scholar]
- Xu R, Jin J, Hu W, Sun W, Bielawski J, Szulc Z, Taha T, Obeid LM, Mao C 2006 Golgi alkaline ceramidase regulates cell proliferation and survival by controlling levels of sphingosine and S1P. FASEB J 20:1813–1825 [DOI] [PubMed] [Google Scholar]
- Govers R, van der Sluijs P, van Donselaar E, Slot JW, Rabelink TJ 2002 Endothelial nitric oxide synthase and its negative regulator caveolin-1 localize to distinct perinuclear organelles. J Histochem Cytochem 50:779–788 [DOI] [PubMed] [Google Scholar]
- Montagnani M, Chen H, Barr VA, Quon MJ 2001 Insulin-stimulated activation of eNOS is independent of Ca2+ but requires phosphorylation by Akt at Ser(1179). J Biol Chem 276:30392–30398 [DOI] [PubMed] [Google Scholar]
- Uittenbogaard A, Smart EJ 2000 Palmitoylation of caveolin-1 is required for cholesterol binding, chaperone complex formation, and rapid transport of cholesterol to caveolae. J Biol Chem 275:25595–25599 [DOI] [PubMed] [Google Scholar]
- Fernández-Hernando C, Fukata M, Bernatchez PN, Fukata Y, Lin MI, Bredt DS, Sessa WC 2006 Identification of Golgi-localized acyl transferases that palmitoylate and regulate endothelial nitric oxide synthase. J Cell Biol 174:369–377 [DOI] [PMC free article] [PubMed] [Google Scholar]
- Magee T, Seabra MC 2005 Fatty acylation and prenylation of proteins: what’s hot in fat. Curr Opin Cell Biol 17:190–196 [DOI] [PubMed] [Google Scholar]
- García-Cardeña G, Fan R, Stern DF, Liu J, Sessa WC 1996 Endothelial nitric oxide synthase is regulated by tyrosine phosphorylation and interacts with caveolin-1. J Biol Chem 271:27237–27240 [DOI] [PubMed] [Google Scholar]
- Komers R, Schutzer WE, Reed JF, Lindsley JN, Oyama TT, Buck DC, Mader SL, Anderson S 2006 Altered endothelial nitric oxide synthase targeting and conformation and caveolin-1 expression in the diabetic kidney. Diabetes 55:1651–1659 [DOI] [PubMed] [Google Scholar]
- Liu W, Kato M, Itoigawa M, Murakami H, Yajima M, Wu J, Ishikawa N, Nakashima I 2001 Distinct involvement of NF-κB and p38 mitogen-activated protein kinase pathways in serum deprivation-mediated stimulation of inducible nitric oxide synthase and its inhibition by 4-hydroxynonenal. J Cell Biochem 83:271–280 [DOI] [PubMed] [Google Scholar]
- Smart EJ, Ying YS, Conrad PA, Anderson RG 1994 Caveolin moves from caveolae to the Golgi apparatus in response to cholesterol oxidation. J Cell Biol 127:1185–1197 [DOI] [PMC free article] [PubMed] [Google Scholar]
- Erwin PA, Lin AJ, Golan DE, Michel T 2005 Receptor-regulated dynamic S-nitrosylation of endothelial nitric-oxide synthase in vascular endothelial cells. J Biol Chem 280:19888–19894 [DOI] [PubMed] [Google Scholar]
- Molnar J, Yu S, Mzhavia N, Pau C, Chereshnev I, Dansky HM 2005 Diabetes induces endothelial dysfunction but does not increase neointimal formation in high-fat diet fed C57BL/6J mice. Circ Res 96:1178–1184 [DOI] [PubMed] [Google Scholar]
- Li G, Barrett EJ, Barrett MO, Cao W, Liu Z 2007 Tumor necrosis factor-α induces insulin resistance in endothelial cells via a p38 mitogen-activated protein kinase-dependent pathway. Endocrinology 148:3356–3363 [DOI] [PubMed] [Google Scholar]
- Yang X, Ongusaha PP, Miles PD, Havstad JC, Zhang F, So WV, Kudlow JE, Michell RH, Olefsky JM, Field SJ, Evans RM 2008 Phosphoinositide signalling links O-GlcNAc transferase to insulin resistance. Nature 451:964–969 [DOI] [PubMed] [Google Scholar]
- Michell BJ, Griffiths JE, Mitchelhill KI, Rodriguez-Crespo I, Tiganis T, Bozinovski S, de Montellano PR, Kemp BE, Pearson RB 1999 The Akt kinase signals directly to endothelial nitric oxide synthase. Curr Biol 9:845–848 [DOI] [PubMed] [Google Scholar]
- Zhang J, Baines CP, Zong C, Cardwell EM, Wang G, Vondriska TM, Ping P 2005 Functional proteomic analysis of a three-tier PKCε-Akt-eNOS signaling module in cardiac protection. Am J Physiol Heart Circ Physiol 288:H954–H961 [DOI] [PubMed] [Google Scholar]
- Sbaa E, Frérart F, Feron O 2005 The double regulation of endothelial nitric oxide synthase by caveolae and caveolin: a paradox solved through the study of angiogenesis. Trends Cardiovasc Med 15:157–162 [DOI] [PubMed] [Google Scholar]
- Zhang Q, Church JE, Jagnandan D, Catravas JD, Sessa WC, Fulton D 2006 Functional relevance of Golgi- and plasma membrane-localized endothelial NO synthase in reconstituted endothelial cells. Arterioscler Thromb Vasc Biol 26:1015–1021 [DOI] [PubMed] [Google Scholar]
- Drab M, Verkade P, Elger M, Kasper M, Lohn M, Lauterbach B, Menne J, Lindschau C, Mende F, Luft FC, Schedl A, Haller H, Kurzchalia TV 2001 Loss of caveolae, vascular dysfunction, and pulmonary defects in caveolin-1 gene-disrupted mice. Science 293:2449–2452 [DOI] [PubMed] [Google Scholar]
- Razani B, Engelman JA, Wang XB, Schubert W, Zhang XL, Marks CB, Macaluso F, Russell RG, Li M, Pestell RG, Di Vizio D, Hou Jr H, Kneitz B, Lagaud G, Christ GJ, Edelmann W, Lisanti MP 2001 Caveolin-1 null mice are viable but show evidence of hyperproliferative and vascular abnormalities. J Biol Chem 276:38121–38138 [DOI] [PubMed] [Google Scholar]
- Fulton D, Babbitt R, Zoellner S, Fontana J, Acevedo L, McCabe TJ, Iwakiri Y, Sessa WC 2004 Targeting of endothelial nitric-oxide synthase to the cytoplasmic face of the Golgi complex or plasma membrane regulates Akt- versus calcium-dependent mechanisms for nitric oxide release. J Biol Chem 279:30349–30357 [DOI] [PubMed] [Google Scholar]
- Wang H, Liu Z, Li G, Barrett EJ 2006 The vascular endothelial cell mediates insulin transport into skeletal muscle. Am J Physiol Endocrinol Metab 291:E323–E332 [DOI] [PubMed] [Google Scholar]
- Wang H, Wang AX, Liu Z, Barrett EJ 2008 Insulin signaling stimulates insulin transport by bovine aortic endothelial cells. Diabetes 57:540–547 [DOI] [PubMed] [Google Scholar]
- Kim F, Tysseling KA, Rice J, Pham M, Haji L, Gallis BM, Baas AS, Paramsothy P, Giachelli CM, Corson MA, Raines EW 2005 Free fatty acid impairment of nitric oxide production in endothelial cells is mediated by IKKβ. Arterioscler Thromb Vasc Biol 25:989–994 [DOI] [PubMed] [Google Scholar]
- Iwakiri Y, Satoh A, Chatterjee S, Toomre DK, Chalouni CM, Fulton D, Groszmann RJ, Shah VH, Sessa WC 2006 Nitric oxide synthase generates nitric oxide locally to regulate compartmentalized protein S-nitrosylation and protein trafficking. Proc Natl Acad Sci USA 103:19777–19782 [DOI] [PMC free article] [PubMed] [Google Scholar]
- Elmendorf JS, Chen D, Pessin JE 1998 Guanosine 5′-O-(3-thiotriphosphate) (GTPγS) stimulation of GLUT4 translocation is tyrosine kinase-dependent. J Biol Chem 273:13289–13296 [DOI] [PubMed] [Google Scholar]
- Qoronfleh MW, Benton B, Ignacio R, Kaboord B 2003 Selective enrichment of membrane proteins by partition phase separation for proteomic studies. J Biomed Biotechnol 2003:249–255 [DOI] [PMC free article] [PubMed] [Google Scholar]
- Nabokina SM, Reidling JC, Said HM 2005 Differentiation-dependent up-regulation of intestinal thiamin uptake: cellular and molecular mechanisms. J Biol Chem 280:32676–32682 [DOI] [PubMed] [Google Scholar]
Associated Data
This section collects any data citations, data availability statements, or supplementary materials included in this article.


