

Abstract
The feasibility of imaging macrophages labeled with ultrasmall superparamagnetic iron-oxide nanoparticles (USPIO) with fast low-angle positive contrast steady-state free precession (FLAPS) was investigated through theory and in vitro experiment. Human macrophage cells were labeled with USPIO and imaged at 1.5T. The metric “Visibility”, which combines magnitude and spatial extent of positive contrast, was used to evaluate the images. Negative contrast steady-state free precession (SSFP) and gradient-echo (GRE) imaging were also evaluated. Positive contrast was observed for relatively high concentrations of labeled cells for flip angles less than α = 25°. Theoretical and experimental results indicate that positive Visibility was maximized at α = 10° and 15°. Low flip angle SSFP also provided negative contrast comparable to standard SSFP and GRE imaging. Results suggest that USPIO-labeled macrophages are capable of producing the conditions necessary for positive contrast with FLAPS at clinical field strength (1.5T) and resolution (0.8 × 0.8 × 3 mm3).
Keywords: macrophages, USPIO, positive contrast, SSFP
INTRODUCTION
Atherosclerosis, a chronic disease which can lead to acute events including heart attack and stroke, accounts for three fourths of all deaths from cardiovascular disease [1]. There is significant motivation to develop methods to detect and characterize atherosclerosis at the earliest possible stage, most importantly before plaque rupture and thrombus formation. Detecting high-risk disease prior to clinical manifestation requires screening of relatively healthy patients, for which non-invasive methods with minimal side effects are preferable. Cellular MRI of atherosclerosis is an emerging field that has the potential to assess the inflammatory activity of an atherosclerotic lesion, thereby providing functional information which may help to risk-stratify the plaque or patient. The general method relies on the phagocytic capacity of inflammatory cells, including macrophages that colocalize within plaque, for ultrasmall superparamagnetic iron oxide nanoparticles (USPIO).
Previous studies in animals [2-6] and humans [7-9] have used negative contrast gradient echo (GRE) imaging to detect signal voids along the vessel wall caused by intracellular USPIO. A disadvantage of negative contrast imaging is the ambiguity of the signal void. Additionally, the contrast generated by the labeled cells is limited if background signal is low. To overcome the challenges of the current methodology and improve USPIO-labeled plaque detection it may be preferable to generate positive contrast from accumulations of USPIO in the vessel wall. For example, a recent publication by Briley-Saebo et al. applied a gradient echo-based positive contrast technique to detect iron oxide nanoparticles in the vessel wall of atherosclerotic rabbits [10]. They found that the addition of a positive contrast or “white marker” technique increased their confidence that the signal voids observed with negative contrast imaging resulted from the presence of USPIO in the vessel wall, not unrelated imaging artifacts.
The contrast generated on GRE images by intracellular USPIO, whether negative or positive, results from off-resonance effects. Balanced steady-state free precession (SSFP) imaging, which is commonly used in cardiovascular MRI applications, has been shown to produce positive contrast from off-resonance effects of compartmentalized superparamagnetic material at low flip angles, a method referred to as Fast Low-Angle Positive contrast SSFP (FLAPS) [11, 12]. The factors influencing FLAPS, including repetition time (TR), flip angle, field strength, perturber geometry, contrast agent concentration, and T1/T2 properties of the surrounding media, have been described theoretically and experimentally with metallic objects and aqueous solutions of paramagnetic materials [11,12]. In general, positive contrast generated with the FLAPS technique increases with higher field strength, longer TR, larger perturber radius, lower T1/T2, and higher contrast agent concentration [12].
The purpose of the current study was to investigate the potential of FLAPS to image USPIO-labeled macrophages, with the eventual goal of in vivo assessment of inflammatory burden in plaque. For this study the theory described by Dharmakumar et al. (2006) [11] has been applied to a case in which the change in magnetic susceptibility is on the order of endogenously labeled macrophages, and the size of the magnetic perturber on the order of atheromatous lesions. The hypothesis is that USPIO-labeled macrophages under such conditions will generate sufficient positive contrast for detection with FLAPS at clinically relevant field strength and resolution. Theoretical predictions are tested with in vitro experiments. Also, the potential of FLAPS to detect lesions is compared to that of standard negative contrast SSFP and GRE imaging.
THEORY
Simulations were performed to evaluate FLAPS derived positive contrast created by USPIO-labeled macrophages. For these simulations, signal intensity (SI) was approximated as the ratio of transverse magnetization to equilibrium magnetization [13]. SSFP signal intensity demonstrates a well-known banding behavior with respect to resonant offset angle; with the bands centered on null points associated with rapid phase transitions [14]. The basis for positive contrast with FLAPS is that at low flip angles, the signal intensity near a null point is greater than on-resonance signal [11]. In the case of a magnetic pertuber in a static magnetic field, the magnetization bands closest to on-resonance are expected to have the greatest contribution to positive contrast [12]. Therefore, the following simulations focus on the magnetization bands associated with the first null points closest to on-resonance, which for the chosen repetition time (TR) of 5 ms occur at ±100 Hz.
The T1 and T2 were set to those of blood at 1.5T [15]. Blood was the chosen background because previous studies in animals have focused on the projection of the signal void into the vessel lumen [3,5]. Also, T1/T2 of blood is expected to be lower than that of the vessel wall [16], and positive contrast is more pronounced in tissues of low T1/T2 [12].
Contrast curves were generated for several flip angles according to the equation: Contrast(Δf) = SI(Δf) - SI(Δf = 0), where SI(Δf = 0) is on-resonance signal intensity, and Δf is off-resonance frequency. Frequencies with the potential to contribute to positive contrast were defined by the Full-Width at Half Maximum (FWHM) of the lobes of the contrast curves [11].
The FWHM regions were applied to a model of a spherical magnetic perturber to determine the spatial extent of positive contrast generated by labeled macrophages. Dipolar fields surrounding magnetic perturbers have been described for finite spheres and infinite cylinders. The spherical model was appropriate for this application because atherosclerotic plaque is a finite structure. The sphere was small enough (diameter = 4 mm) to be contained within plaque of a human carotid artery [32]. Estimated iron-loading per cell was based on values reported in the literature for in vitro labeling with USPIO (1.4 pg Fe/cell) [17]. The local magnetic dose (LMD) was estimated as LMD = vcΔχB0, where vc is the fraction of labeled cells, and Δχ is the change in magnetic susceptibility. The susceptibility of the iron oxide particles was estimated using the molar susceptibility of iron oxide nanoparticles reported in Weisskoff and Kiihne (1992) [18]. The estimated LMD values for 100%, 66%, and 33% labeled cells were 155, 98, and 47 mG, respectively.
The frequency map surrounding the sphere was simulated based on a two-compartment model. The spatially-dependent change in magnetic field (ΔB) in a plane parallel to the static magnetic field (B0) was defined as:
| (1) |
where a = radius of the sphere, and (r,θ) is position with respect to the center of the sphere. Off-resonant frequency per pixel was derived from the off-resonance field map. In these simulations, positions within the sphere were not evaluated. Also, diffusion and partial volume effects were not considered. Diffusion effects were expected to be minimal, because macro-scale effects of the labeled cells were considered for this application. Partial volume effects could lead to a shift of intravoxel frequency; elimination of these effects was a simplifying assumption.
The upper and lower bounds of the FWHM were used to threshold the off-resonant frequency map surrounding the sphere. Contrast, spatial extent, and Visibility were evaluated for several flip angles and concentrations of labeled cells. Simulated contrast (ContrastSIM) was the average contrast of pixels within the bands. Simulated spatial extent (AreaSIM) was the product of the number of pixels within the bands (nSIM) and the area of each pixel. Finally, simulated Visibility (VISSIM), which incorporates spatial extent as well as magnitude of contrast [13], was calculated as:
| (2) |
Contrast, spatial extent, and Visibility were evaluated for several flip angles (α = 5° - 35°) and concentrations of labeled cells (25% - 100%).
METHODS
USPIO contrast agents
The USPIO used in this study, SH U 555C or Supravist, is a ferucarbotran compound (Bayer Schering Pharma AG, Berlin, Germany). The extended circulation time of USPIO compared to larger iron oxide particles [19] increases the opportunity for macrophages in atherosclerotic lesions to contact and phagocytose the particles. Other USPIO contrast agents that have been used for imaging macrophages in atherosclerosis include Sinerem (Guerbet LLC, Villepinte, France) and Ferumoxytol (Advanced Magnetics Inc, Cambridge, MA, USA) [2,3,5,6,8,9] .
Cell culture, labeling, phantom preparation and analysis
THP-1 cells, a human monocytic cell line derived from acute monocytic leukemia, (American Type Culture Collection, Manassas, VA, USA) were maintained in RPMI-1640 complete medium supplemented with 10% heat-inactivated fetal bovine serum at 37°C and 5% CO2. For differentiation into macrophages, cells were cultured in complete medium supplemented with 100 nM phorbol 12-myristate (Sigma Aldrich Inc, St. Louis, MO, USA) for 3 days [20]. Macrophages were labeled by a 24 hr long incubation in complete medium containing USPIO (50 μg Fe/mL). The incubation concentration was based on the recommended clinical dose [21]. After labeling, cells were washed with warm phosphate-buffered saline to remove extracellular USPIO. Cells were detached, and counted with a Neubauer hemocytometer. Labeling efficiency was determined through histological staining with Perl’s Prussian Blue iron stain (Sigma Aldrich Inc, St. Louis, MO, USA).
Iron content per cell was determined using a Varian VISTA inductively-coupled plasma optic emission spectrometer (ICP-OES) (Varian Inc, Palo Alto, CA, USA). Cells were labeled, counted, and lysed in 1% sodium dodecyl sulfate buffer. The spectrometer detection wavelength was set to 238 nm for iron and calibrated with 3 standards.
Macrophages were fixed with 4% paraformaldehyde for MR imaging. Three initial samples, considered to be a collection of 100% labeled cells, were subsequently combined with different numbers of non-labeled cells to generate two diluted “labeled cell” concentrations with 66% and 33% of labeled cells, while maintaining 12×106 cells per sample. Thus, there were 9 samples of labeled cells: 3 × 100%, 3 × 66%, and 3 × 33%. A tenth sample containing unlabeled cells served as control. Cells were centrifuged in 750-μL Eppendorf plastic test tubes. The geometry of the cell pellet was a short cylinder with diameter and height of 4 mm. The test tubes were submerged in a water bath doped with manganese chloride (0.06 mM) to mimic the T1/T2 of blood at 1.5T.
Frequency mapping and susceptometry
Off-resonance frequency maps for each sample were generated from two echoes of a multi-echo GRE sequence. Off-resonance frequency (Δf) per pixel was calculated as: Δf = (1/2π)*(ϕ2 - ϕ1)/esp, where esp is the echo spacing in seconds, and ϕ1 and ϕ2 are the off-resonance phase accumulations at the first and second echo, respectively, in radians. The range of detectable frequencies was between ±162 Hz for this study.
The methods to calculate the Local Magnetic Dose (LMD) for each sample were similar to those described by Bowen et al (2002) [17], which were based on the Reilly-McConnell-Meisenheimer method [22,23]. The field maps surrounding the samples were evaluated for four orthogonal rays and fit to Eq. 1. A dipolar field pattern was not observed with the control sample; therefore the susceptibility of the test tube was assumed to be negligible.
Imaging protocol
All images were acquired on a 1.5T Sonata scanner (Siemens Medical Solutions, Erlangen, Germany), using a product head coil for signal reception. Sequence parameters for 2D FLAPS imaging were: TR = 5 ms, bandwidth = 610 Hz/pixel, echo time = TR/2, α= 5°-35°, 12 averages, matrix size 256×256, and voxel size = 0.8 × 0.8 × 3 mm3. A multi-echo GRE sequence was used for frequency mapping and imaging weighted by effective transverse relaxation time (T2*). GRE parameters were: TR = 5000 ms, 16 echoes, echo spacing 3.09 ms, acquisition time = 21 min, matrix size 256×256, and voxel size = 0.8 × 0.8 × 3 mm3.
Image analysis
Image analysis was performed using Matlab version 6.5.1 (The Mathworks Inc, Natick, MA, USA) and ImageJ version 1.34s (National Institutes of Health, Bethesda, MD, USA). Contrast-to-noise per pixel (CNRPIXEL) surrounding each sample was calculated as CNRPIXEL = (SIPIXEL - SIBACKGROUND)/σAIR, where SIPIXEL is the signal intensity of the pixel, SIBACKGROUND is the average signal intensity of a region of the water bath, and σAIR is the standard deviation of air.
Pixels with CNRPIXEL greater than 10 were considered to contribute to positive contrast. This conservative threshold is twice the Rose criterion, which is an indication of the ability of the human eye to distinguish between two objects [13]. Overall positive contrast was quantified with the imaging metric Positive Visibility (VISPOS), calculated as:
| (3) |
where CNRPOS is the average CNR and nPOS is the number of pixels contributing to positive contrast.
Negative Visibility (VISNEG) was evaluated in a similar manner, with the threshold for segmenting regions of negative contrast set to CNRPIXEL < -10. Signal loss within each sample, as a percent of control, was also evaluated with circular regions-of-interest (ROI’s) using ImageJ. Effective transverse relaxation time (R2*) was calculated from signal intensity versus echo time for the GRE sequence.
Statistical Analysis
Measurements were compared using one-way ANOVA tests using Origin software (version 7.0, Origin Lab Corp). If significant differences in the means of the groups were found, then a Tukey pair-wise comparison was used to evaluate which groups were different. A p-value less than p = 0.05 was considered significant for all statistical tests. Post-hoc power analysis was performed using G*power software (Dusseldorf University); a power level greater than 0.8 was considered acceptable. For calculating LMD, experimental data was fit to Eq. 1 using linear regression in Matlab.
RESULTS
Simulations
Theoretical results show that it may be possible to detect labeled cells with FLAPS. The contrast curves demonstrate that as flip angle decreases, the magnitude of positive contrast increases, and the FWHM bands become narrower and move further off-resonance (Figure 1.A). These results are also shown in Table 1 with the limits, in Hz, of the FWHM bands for different flip angles. Due to the symmetric behavior of the SSFP signal, results are conveyed as the absolute value of off-resonant frequency. Translated to the spherical model, at low flip angles the bands of positive contrast are narrower and brighter than at high flip angles (Figure 1.B). ContrastSIM is inversely proportional to flip angle, and independent of the concentration of labeled cells, while AreaSIM is directly proportional to flip angle and cell concentration (Figure 2). The optimization of flip angle, considering both magnitude and spatial extent of positive contrast, can be accomplished with VISSIM; VISSIM is maximized at α = 10° and 15° for all cell concentrations (Figure 6). The trade-off between the two flip angles is magnitude of positive contrast (higher for α = 10°), and spatial extent of positive contrast (higher for α = 15°).
FIGURE 1.
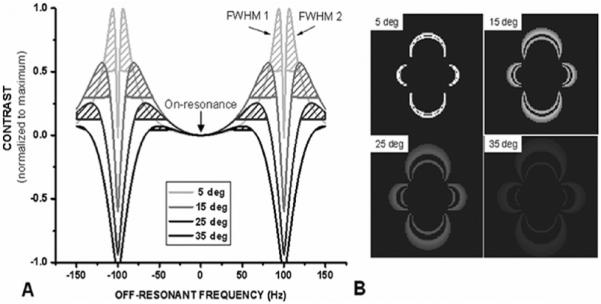
(A) Contrast curves for α = 5°, 15°, 25°, and 35°. Two FWHM regions surround each null point (± 100 Hz); the FWHM closer to on-resonance is designated “FWHM 1”. (B) Simulated positive contrast surrounding a sphere of 100% labeled cells for α = 5°, 15°, 25°, and 35°.
TABLE 1.
Estimate of frequencies (in Hz) with potential for positive contrast (TR=5ms). Average Contrast is given in arbitrary units
| Flip Angle (deg) | Full-Width-Half-Maximum 1 |
Full-Width-Half-Maximum 2 |
Bandwidth (Hz) | Average Contrast | ||
|---|---|---|---|---|---|---|
| Lower Bound | Upper Bound | Lower Bound | Upper Bound | |||
| 5 | 81 | 98 | 102 | 119 | 17 | 0.1367 |
| 15 | 58 | 91 | 109 | 142 | 33 | 0.0818 |
| 25 | 42 | 80 | 120 | 158 | 38 | 0.0369 |
| 35 | 29 | 62 | 138 | 171 | 33 | 0.0108 |
FIGURE 2.
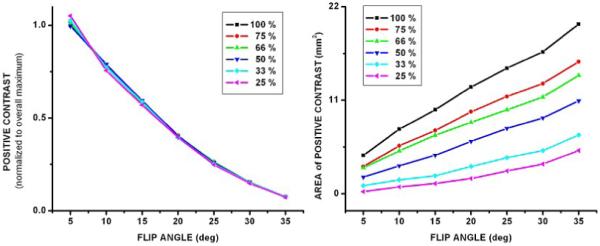
(A) Average magnitude of positive contrast (ContrastSIM) with respect to flip angle for all concentrations of labeled cells. ContrastSIM is inversely proportional to flip angle. (B) Area of positive contrast (AreaSIM) with respect to flip angle for all concentrations of labeled cells. AreaSIM is directly proportional to flip angle and concentration of labeled cells.
FIGURE 6.
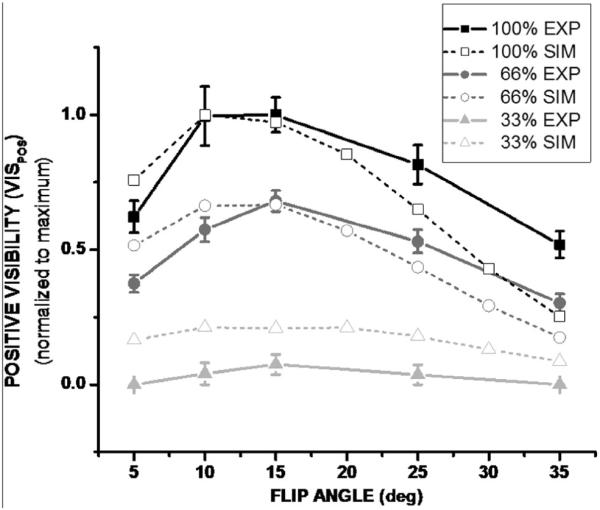
VISPOS versus flip angle for three concentrations of labeled cells. VISPOS is optimal at α = 10° and 15° for all cell concentrations. Results are normalized for comparison with theoretical predictions. Theoretical results are shown with open symbols and dashed lines, while experimental results are shown with closed symbols and solid lines.
Cell labeling verification and quantification
Prussian blue staining and ICP-AES analysis provided confirmation of cell labeling. Light microscope images of stained cells are displayed in Figure 3. Intracellular iron accumulation, as determined by ICP-OES, is significantly greater in labeled cells than control (1.24 ± 0.02 vs. 0.04 ± 0.01 pg Fe/cell, mean ± standard deviation, p < 0.001).
FIGURE 3.
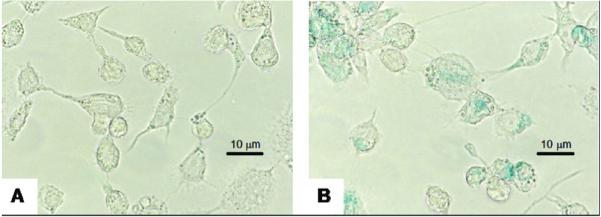
Light microscope images (magnification 800X) of Prussian Blue staining of unlabeled (A) and labeled (B) cells. Iron accumulation is blue.
Figure 4 shows the frequency map for a sample of 100% labeled cells. A dipolar field pattern is observed as predicted with positive frequencies along the direction of B0 and negative frequencies perpendicular to B0. The range of frequencies generated by concentrations of 100% and 66% labeled cells include the first null points of the SSFP signal for TR = 5 ms. The first null points of the SSFP signal are not reached for the 33% concentration of labeled cells. This is because the amount of paramagnetic material is not sufficient to create the change in susceptibility necessary to generate those frequencies. The frequency maps were used to calculate LMD; the experimental LMD values for each of the concentrations of labeled cells are listed in Table 2.
FIGURE 4.
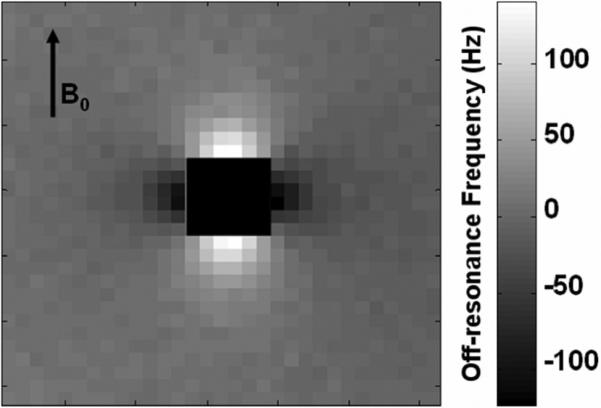
Off-resonance frequency map (Hz) of 100% labeled cells. The center has been eliminated for clarity. Positive frequencies occur along B0, and negative frequencies occur perpendicular to B0.
TABLE 2.
Summary of results of comparison with negative contrast. Values are listed as mean ± standard deviation. There are three possible backgrounds for calculating contrast: “Bath” refers to the water bath, “Positive” refers to the ring of positive contrast, and “Void” refers to the signal void at the center of the sample
| VISNEG |
VISPOS |
||||||||
|---|---|---|---|---|---|---|---|---|---|
| vs. Bath |
vs. Positive |
vs. Bath |
vs. Void |
||||||
| Percent Labeled | LMD (mG) | R2* | GRE te = 3 ms | GRE te = 49 ms | SSFP α = 35° | SSFP α = 15° | SSFP α = 15° | SSFP α = 15° | SSFP α = 15° |
| 100% | 172 ±14 | naa | -188 ±43 | -308 ±20 | -415 ±29 | -204 ±7 | -320 ±22 | 95 ±13 | 263 ±28 |
| 66% | 125 ±11 | 164 ±29 | -213 ±21 | -286 ±26 | -338 ±15 | -177 ±3 | -276 ±12 | 63 ±6 | 175 ±8 |
| 33% | 35 ±23 | 42 ±5 | -102 ±11 | -239 ±17 | -262 ±12 | -140 ±3 | -167 ±43 | 10 ±0.3 | 12 ±21 |
| 0% | na | 7 | -10 | -61 | -137 | -70 | 0 | 0 | 0 |
The shortest TE was not sufficient to measure R2* for the greatest concentration of cells.
Positive Contrast Imaging with FLAPS
Positive contrast is observed as a narrow band of signal enhancement surrounding a signal void for cell concentrations of 66% and 100% for flip angles up to α = 25° (Figure 5). Only a few pixels, if any, demonstrate positive contrast for 33% labeled cells, and no positive contrast is seen for control (0%). Quantitative results are displayed in Figure 6 and Table 2. Positive Visibility (VISPOS) peaks at α = 10° and 15°. In Figure 6, VISPOS is normalized for comparison of experimental results and theoretical predictions. The presence of noise in experimental images necessitated the use of the VISPOS metric for image analysis, which takes into account the human visual detection factor. A different metric was used for the simulation results because of the lack of noise in those images.
FIGURE 5.
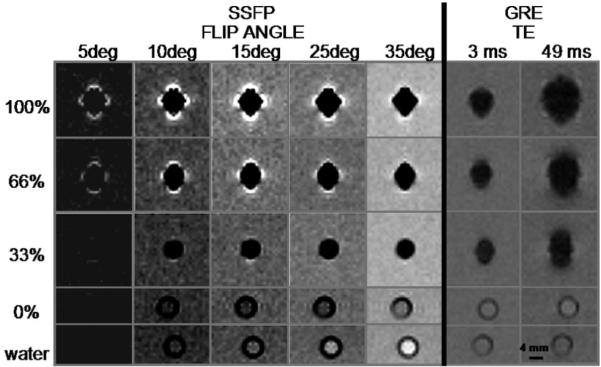
Representative cross-sectional images of clusters of USPIO-labeled macrophages in test tubes. Positive contrast is most notable at α = 10° and 15° for 66% and 100% labeled cells. Signal loss occurs within the tube for concentrations of labeled cells greater than 0%. Each sample contains approximately 12 million cells.
Comparison with Negative Contrast Imaging
Signal loss within voxels containing labeled cells is observed with SSFP and GRE for all concentrations of labeled cells. For SSFP, there is a greater degree of signal loss with relatively high flip angles than with low flip angles. However the difference in signal loss between α = 35° and α = 15° is not significant for any of the concentrations of labeled cells (p > 0.05 for all cases, data not shown).
For GRE imaging, the rate of signal loss with respect to TE is concentration-dependent; corresponding to differences in R2* (Table 2). Although the signal loss within the sample reaches a limit, the spatial extent of negative contrast continues to increase with longer TE, referred to as the blooming effect, which increases VISNEG. Images with a very long TE (49 ms) are shown to illustrate blooming. The TE’s used in previous studies of USPIO-labeled plaque range from 2 - 15 ms.
VISNEG results are shown in Table 2 for SSFP for two flip angles and for GRE for two TE’s. VISNEG is similar between SSFP with low flip angle and GRE with short TE. VISNEG is greatest for SSFP with α = 35°. The signal void with FLAPS is smaller than with high flip-angle SSFP or GRE, but it is more conspicuous because of the dramatic contrast between the signal void and the band of enhancement. This is quantified by the Visibility values that directly compare the signal void and the ring of positive contrast shown in Table 2 (VISPOS vs. Void, and VISNEG vs. Positive, respectively).
DISCUSSION AND CONCLUSIONS
This study has investigated the potential for USPIO-labeled macrophages to generate positive contrast with FLAPS under conditions relevant to atherosclerosis MR imaging at clinical field strength and resolution. Theoretical results suggest that it is possible to detect USPIO-labeled cells with FLAPS, and in vitro experimental results verify the hypothesis that it can be done with practical, clinically-relevant equipment and settings. The relevance and context of the experimental results are discussed hereafter, as well as explanations of findings and limitations of the study.
The intracellular iron content of labeled cells in this experiment is consistent with previously published results for in vitro labeling of macrophages with USPIO [17], and the experimental LMD values were similar to the values estimated from the literature.
Results of positive Visibility (VISPOS), a metric combining area and magnitude of positive contrast, are consistent with theoretical predictions in that VISPOS is maximized at α = 10° and 15°. Discrepancies between theory and experiment at high flip angle and the low cell concentration are due to the threshold used to segment regions of positive contrast for the experiment. For example, at flip angles greater than α = 15°, fewer pixels meet the threshold CNRPIXEL > 10, thus limiting the area of positive contrast. A similar threshold was not applied to theoretical simulations.
Interestingly, at α = 15°, the relative drop in positive Visibility, as a percentage, is equal to the drop in volume fraction labeled cells both theoretically and experimentally. For example, for 66% labeled cells VISPOS was decreased to 66% of maximum (Table 2, VISPOS vs. Bath). The other imaging methods evaluated here, including R2* quantification and negative contrast with GRE and SSFP did not show the same result (Table 2). Absolute quantification of cell number using any method is not feasible when the iron-loading and geometry are unknown. However, these results indicate that relative quantification and monitoring of intracellular iron may be possible based on changes in positive Visibility with FLAPS. It is important to note that quantification using Visibility, as calculated in this study, would depend on the threshold for CNRPIXEL.
The theoretical and experimental results of this study are consistent with previous work with FLAPS [11,12]. Results of those studies showed that positive contrast in blood at 1.5T peaked at α = 20-25° for TR = 10 ms, and α = 15-20° for TR = 6.5 ms. Based on this trend, an optimal flip angle of α = 10-15° for TR = 5 ms is reasonable, especially as it fits with theoretical expectations. The dependence of optimal flip angle on TR is not evaluated in this study. Generally, the results of our experiments followed the predictions of previous work; the magnitude of positive contrast is dependent on flip angle and the concentration paramagnetic material. The additional knowledge gained through this work is the evaluation of positive contrast explicitly in terms of off-resonant frequencies, assessment of the Visibility metric, and application of FLAPS imaging to USPIO-labeled macrophages.
Visibility was a useful metric for this study, and it may be valuable for investigating alternative positive contrast methods [10,24-27]. It is especially helpful when the enhancement pattern of positive contrast is not conducive to circular region-of-interest analysis. Also, Visibility is easily adapted for comparison with negative contrast.
A more conventional metric for negative contrast is signal loss as a percent of control. For SSFP imaging, Lebel et al. [28] predicted that sub-optimal flip angles may result in decreased sensitivity to iron-labeled cells. Results of our experiment show that signal loss within the sample of labeled cells depends on flip angle. However, for the lowest concentration of labeled cells evaluated in this study, signal loss at the optimal flip angle for positive contrast (α = 15°), is not significantly different from signal loss with standard SSFP (α = 35°). Therefore low flip-angle SSFP (FLAPS) may not necessitate a significant sacrifice of sensitivity compared to standard SSFP when considering signal loss within voxels containing labeled cells.
Signal loss within the sample is also observed with T2*-weighted GRE imaging. Although signal loss reaches a plateau as TE increases, the area of the signal void continues to expand, which is consistent with the work of Pintaske et al. [29,30]. The blooming effect at longer TE is somewhat advantageous, because it increases the area of signal change, making it more conspicuous. However in a clinical application it might be challenging to distinguish between a large area of minimally-labeled cells (no blooming) and a small area of highly-labeled cells (with blooming), which would produce the same area of signal void. Those two cases may have the same area of signal void with negative contrast-only imaging. The ambiguity is mitigated with FLAPS because positive contrast only occurs in the region of blooming. Therefore a large area of minimally-labeled cells would not show positive contrast with low flip-angle SSFP, but a signal void would be present equal to the area of the labeled cells. A small region of highly-labeled cells would be identified by a signal void equal to the region, surrounded by an area of positive contrast. The signal void may actually be more conspicuous than with negative contrast-only imaging because it would be highlighted by the ring of positive contrast. The greatest absolute contrast was observed for SSFP with α = 35° (Table 2), but standard negative contrast-only SSFP imaging is subject to the same ambiguity regarding blooming as GRE imaging. The second-greatest absolute contrast was for GRE imaging with TE = 49 ms. That TE is much greater than would commonly be used because it would result in significant image distortion and severe “blooming” effects (Figure 5). It is included here to demonstrate the sequence parameters that would be required to obtain a high Visibility value from negative contrast GRE imaging. Low flip angle SSFP provides relatively high absolute Visibility values when considering both negative and positive contrast (Table 2: SSFP, α = 15°, VISNEG vs. Positive and VISPOS vs. Void). This is because by low flip angle SSFP, or FLAPS, generates both negative and positive contrast from labeled cells. With little sacrifice of general detection of labeled cells, the additional benefits of FLAPS are less ambiguity with respect to blooming and increased conspicuity of the signal void.
The idealized in vitro conditions of this study may limit the in vivo application of the results. Such conditions include uniform background signal, lack of flow [31], fixed orientation perpendicular to B0 [30], and homogeneous distribution of labeled cells. Regarding flow, the results of Markl et al. [31] suggest that off-resonance signal enhancement with low flip angle SSFP is amplified in a velocity-dependent manner. They showed that off-resonance signal enhancement is maximized during peak velocity of pulsatile flow. Therefore in the application of atherosclerosis imaging it may be beneficial to employ pulse-gating and acquire images at peak velocity. Consideration of flow effects would be especially important in semi-quantitative evaluation of USPIO content in plaque.
Pintaske et al. [30] showed that the geometry of the signal void area with GRE imaging surrounding a spherical magnetic perturber is dependent on orientation of the imaging plane with respect to B0. Therefore positive contrast is also expected to be orientation-dependent. This may affect the extent of positive contrast with FLAPS. For example in the carotid artery, the plaque may be to the right or left of the lumen with respect to the direction of B0. In that case the negative frequency shifts would be most likely to contribute to positive contrast in the lumen.
The composition of USPIO-labeled macrophages in plaque is unlikely to be homogeneous. It may be possible to model plaque as a composite of several homogenous regions; however that would reduce the size of each region and thereby reduce the potential for positive contrast. Detection of clusters of cells with radius less than 2 mm at an image resolution of 0.8 × 0.8 × 3 mm3 is expected to be challenging with the level of iron-loading assessed in this study. These limitations are best addressed through in vivo experiments, especially considering that the amount of iron-loading in vivo is unknown.
Finally, it is important to understand that the results apply to the specific conditions evaluated for this study: a TR of 5 ms, a background T1/T2 of 5, a spherical region of radius 2 mm, and iron-loading per cell of 1.24 pg Fe/cell. To understand how altering these factors can affect FLAPS imaging, please refer to the publications by Dharmakumar et al. [11,12].
In conclusion, theoretical and experimental results support the hypothesis that imaging USPIO-labeled macrophages with FLAPS is feasible at clinical field strength and resolution. The lowest concentration of labeled cells (33%) was detected by negative contrast with low flip angle SSFP, and the blooming effect at higher concentrations led to positive contrast with FLAPS. The identification of blooming, and the dramatic contrast between signal enhancement and signal void, are advantages of FLAPS compared to negative contrast methods. Visibility, which combines magnitude and spatial extent of contrast, provides a useful tool for evaluating positive contrast with FLAPS and comparing it to negative contrast techniques. These results could potentially guide the use and interpretation of SSFP in plaque-imaging applications.
ACKNOWLEDGEMENTS
We wish to acknowledge the following funding sources: NIH/NIBIB T32 EB005170, U54 CA199341, and EB-002100. This work was also supported by an award from the American Heart Association. The iron-oxide contrast agent was provided by Bayer Schering Pharma, AG, Berlin, Germany.
Footnotes
Publisher's Disclaimer: This is a PDF file of an unedited manuscript that has been accepted for publication. As a service to our customers we are providing this early version of the manuscript. The manuscript will undergo copyediting, typesetting, and review of the resulting proof before it is published in its final citable form. Please note that during the production process errors may be discovered which could affect the content, and all legal disclaimers that apply to the journal pertain.
REFERENCES
- 1.Rosamond W, Flegal K, Friday G, Furie K, Go A, Greenlund K, Haase N, Ho M, Howard V, Kissela B, Kittner S, Lloyd-Jones D, McDermott M, Meigs J, Moy C, Nichol G, O’Donnell CJ, Roger V, Rumsfeld J, Sorlie P, Steinberger J, Thom T, Wasserthiel-Smoller S, Hong YL, Assoc AH. Heart disease and stroke statistics - 2007 update - A report from the American Heart Association Statistics Committee and Stroke Statistics Subcommittee. Circulation. 2007;115(5):E69–E171. doi: 10.1161/CIRCULATIONAHA.106.179918. [DOI] [PubMed] [Google Scholar]
- 2.Herborn CU, Vogt FM, Lauenstein TC, Dirsch O, Corot C, Robert P, Ruehm SG. Magnetic resonance imaging of experimental atherosclerotic plaque: Comparison of two ultrasmall superparamagnetic particles of iron oxide. Journal of Magnetic Resonance Imaging. 2006;24(2):388–393. doi: 10.1002/jmri.20649. [DOI] [PubMed] [Google Scholar]
- 3.Hyafil F, Laissy JP, Mazighi M, Tchetche D, Louedec L, Adle-Biassette H, Chillon S, Henin D, Jacob MP, Letourneur D, Feldman LJ. Ferumoxtran-10-enhanced MRI of the hypercholesterolemic rabbit aorta - Relationship between signal loss and macrophage infiltration. Arteriosclerosis Thrombosis and Vascular Biology. 2006;26(1):176–181. doi: 10.1161/01.ATV.0000194098.82677.57. [DOI] [PubMed] [Google Scholar]
- 4.Priest AN, Ittrich H, Jahntz CL, Kooijman H, Weber C, Adam G. Investigation of atherosclerotic plaques with MRI at 3 T using ultrasmall superparamagnetic particles of iron oxide. Magnetic resonance imaging. 2006;24(10):1287–1293. doi: 10.1016/j.mri.2006.08.012. [DOI] [PubMed] [Google Scholar]
- 5.Ruehm SG, Corot C, Vogt P, Kolb S, Debatin JF. Magnetic resonance imaging of atherosclerotic plaque with ultrasmall superparamagnetic particles of iron oxide in hyperlipidemic rabbits. Circulation. 2001;103(3):415–422. doi: 10.1161/01.cir.103.3.415. [DOI] [PubMed] [Google Scholar]
- 6.Yancy AD, Olzinski AR, Hu TCC, Lenhard SC, Aravindhan K, Gruver SM, Jacobs PM, Willette RN, Jucker BM. Differential uptake of ferumoxtran-10 and ferumoxytol, ultrasmall superparamagnetic iron oxide contrast agents in rabbit: Critical determinants of atherosclerotic plaque labeling. Journal of Magnetic Resonance Imaging. 2005;21(4):432–442. doi: 10.1002/jmri.20283. [DOI] [PubMed] [Google Scholar]
- 7.Kooi ME, Cappendijk VC, Cleutjens KBJM, Kessels AGH, Kitslaar PJEHM, Borgers M, Frederik PM, Daemen MJAP, van Engelshoven JMA. Accumulation of ultrasmall superparamagnetic particles of iron oxide in human atherosclerotic plaques - Response. Circulation. 2003;108(19):E140–E140. doi: 10.1161/01.CIR.0000068315.98705.CC. [DOI] [PubMed] [Google Scholar]
- 8.Schmitz SA, Taupitz M, Wagner S, Wolf KJ, Beyersdorff D, Hamm B. Magnetic resonance imaging of atherosclerotic plaques using superparamagnetic iron oxide particles. Journal of Magnetic Resonance Imaging. 2001;14(4):355–361. doi: 10.1002/jmri.1194. [DOI] [PubMed] [Google Scholar]
- 9.Trivedi RA, Mallawarachi C, JM UK-I, Graves MJ, Horsley J, Goddard MJ, Brown A, Wang L, Kirkpatrick PJ, Brown J, Gillard JH. Identifying inflamed carotid plaques using in vivo USPIO-enhanced MR imaging to label plaque macrophages. Arteriosclerosis, thrombosis, and vascular biology. 2006;26(7):1601–1606. doi: 10.1161/01.ATV.0000222920.59760.df. [DOI] [PubMed] [Google Scholar]
- 10.Briley-Saebo KC, Mani V, Hyafil F, Cornily JC, Fayad ZA. Fractionated Feridex and positive contrast: In vivo MR imaging of atherosclerosis. Magnetic Resonance in Medicine. 2008;59(4):721–730. doi: 10.1002/mrm.21541. [DOI] [PubMed] [Google Scholar]
- 11.Dharmakumar R, Koktzoglou I, Li D. Generating positive contrast from off-resonant spins with steady-state free precession magnetic resonance imaging: theory and proof-of-principle experiments. Physics in medicine and biology. 2006;51(17):4201–4215. doi: 10.1088/0031-9155/51/17/006. [DOI] [PubMed] [Google Scholar]
- 12.Dharmakumar R, Koktzoglou I, Li D. Factors influencing fast low angle positive contrast steady-state free precession (FLAPS) magnetic resonance imaging. Physics in medicine and biology. 2007;52(11):3261–3273. doi: 10.1088/0031-9155/52/11/021. [DOI] [PubMed] [Google Scholar]
- 13.Haacke EM. Magnetic resonance imaging: physical principles and sequence design. J. Wiley & Sons; New York: 1999. p. xxvii.p. 914. [Google Scholar]
- 14.Dharmakumar R, Wright GA. Understanding steady-state free precession: A geometric perspective. Concepts in Magnetic Resonance Part A. 2005;26A(1):1–10. [Google Scholar]
- 15.Stanisz GJ, Odrobina EE, Pun J, Escaravage M, Graham SJ, Bronskill MJ, Henkelman RM. T-1, T-2 relaxation and magnetization transfer in tissue at 3T. Magnetic Resonance in Medicine. 2005;54(3):507–512. doi: 10.1002/mrm.20605. [DOI] [PubMed] [Google Scholar]
- 16.Rogers WJ, Prichard JW, Hu YL, Olson PR, Benckart DH, Kramer CM, Vido DA, Reichek N. Characterization of signal properties in atherosclerotic plaque components by intravascular MRI. Arteriosclerosis Thrombosis and Vascular Biology. 2000;20(7):1824–1830. doi: 10.1161/01.atv.20.7.1824. [DOI] [PubMed] [Google Scholar]
- 17.Bowen CV, Zhang XW, Saab G, Gareau PJ, Rutt BK. Application of the static dephasing regime theory to superparamagnetic iron-oxide loaded cells. Magnetic Resonance in Medicine. 2002;48(1):52–61. doi: 10.1002/mrm.10192. [DOI] [PubMed] [Google Scholar]
- 18.Weisskoff RM, Kiihne S. Mri Susceptometry - Image-Based Measurement of Absolute Susceptibility of Mr Contrast Agents and Human Blood. Magnetic Resonance in Medicine. 1992;24(2):375–383. doi: 10.1002/mrm.1910240219. [DOI] [PubMed] [Google Scholar]
- 19.Sica GT, Ji H, Ros PR. CT and MR imaging of hepatic metastases. American Journal of Roentgenology. 2000;174(3):691–698. doi: 10.2214/ajr.174.3.1740691. [DOI] [PubMed] [Google Scholar]
- 20.Glesne D, Huberman E. Induction of Differentiation and Cellular Manipulation of Human Myeloid HL-60 Leukemia Cells. In: C J, editor. Cell biology: a laboratory handbook. 3rd ed. Elsevier Academic; Amsterdam; Boston: 2006. [Google Scholar]
- 21.Metz S, Bonaterra G, Rudelius M, Settles M, Rummeny EJ, Daldrup-Link HE. Capacity of human monocytes to phagocytose approved iron oxide MR contrast agents in vitro. European Radiology. 2004;14(10):1851–1858. doi: 10.1007/s00330-004-2405-2. [DOI] [PubMed] [Google Scholar]
- 22.Chu SCK, Xu Y, Balschi JA, Springer CS. Bulk Magnetic-Susceptibility Shifts in Nmr-Studies of Compartmentalized Samples - Use of Paramagnetic Reagents. Magnetic Resonance in Medicine. 1990;13(2):239–262. doi: 10.1002/mrm.1910130207. [DOI] [PubMed] [Google Scholar]
- 23.Reilly CA, Mcconnell HM, Meisenheimer RG. Nuclear Magnetic Resonance Spectra of Annular Samples. Physical Review. 1955;98(1):264–265. [Google Scholar]
- 24.Cunningham CH, Arai T, Yang PC, McConnell MV, Pauly JM, Conolly SM. POsitive contrast magnetic resonance imaging of cells labeled with magnetic nanoparticles. Magnetic Resonance in Medicine. 2005;53(5):999–1005. doi: 10.1002/mrm.20477. [DOI] [PubMed] [Google Scholar]
- 25.Mani V, Briley-Saebo KC, Itskovich VV, Samber DD, Fayad ZA. GRadient echo Acquisition for Superparamagnetic particles with positive contrast (GRASP): Sequence characterization in membrane and glass superparamagnetic iron oxide phantoms at 1.5T and 3T. Magnetic Resonance in Medicine. 2006;55(1):126–135. doi: 10.1002/mrm.20739. [DOI] [PubMed] [Google Scholar]
- 26.Seppenwoolde JH, Viergever MA, Bakker CJG. Passive tracking exploiting local signal conservation: The white marker phenomenon. Magnetic Resonance in Medicine. 2003;50(4):784–790. doi: 10.1002/mrm.10574. [DOI] [PubMed] [Google Scholar]
- 27.Stuber M, Gilson WD, Schar M, Kedziorek DA, Hofmann LV, Shah S, Vonken EJ, Bulte JWM, Kraitchman DL. Positive contrast visualization of iron oxide-labeled stem cells using inversion-recovery with ON-Resonant water suppression (IRON) Magnetic Resonance in Medicine. 2007;58(5):1072–1077. doi: 10.1002/mrm.21399. [DOI] [PubMed] [Google Scholar]
- 28.Lebel RM, Menon RS, Bowen CV. Relaxometry model of strong dipolar perturbers for balanced-SSFP: application to quantification of SPIO loaded cells. Magn Reson Med. 2006;55(3):583–591. doi: 10.1002/mrm.20799. [DOI] [PubMed] [Google Scholar]
- 29.Pintaske J, Bantleon R, Kehlbach R, Claussen CD, Wiskirchen J, Schick F. Effect of concentration of SH U 555A labeled human melanoma cells on MR spin echo and gradient echo signal decay at 0.2, 1.5, and 3T. Magma (New York, NY. 2006;19(2):71–77. doi: 10.1007/s10334-006-0029-z. [DOI] [PubMed] [Google Scholar]
- 30.Pintaske J, Muller-Bierl B, Schick F. Geometry and extension of signal voids in MR images induced by aggregations of magnetically labelled cells. Physics in medicine and biology. 2006;51(18):4707–4718. doi: 10.1088/0031-9155/51/18/016. [DOI] [PubMed] [Google Scholar]
- 31.Markl M, Alley MT, Elkins CJ, Pelc NJ. Flow effects in balanced steady state free precession imaging. Magnetic Resonance in Medicine. 2003;50(5):892–903. doi: 10.1002/mrm.10631. [DOI] [PubMed] [Google Scholar]
- 32.Yuan C, Beach KW, Llewellyn HS, Jr, Hatsukami TS. Measurement of atherosclerotic carotid plaque size in vivo using high resolution magnetic resonance imaging. Circulation. 1998;98:2666–2671. doi: 10.1161/01.cir.98.24.2666. [DOI] [PubMed] [Google Scholar]