Abstract
Aims
As a bioactive filler capable of remineralizing tooth structures, the main disadvantage of as-made amorphous calcium phosphate (am-ACP) are its large agglomerates. The objective of this study was to mill ACP, and compare the adhesive strength to dentin, work to fracture, and failure modes of both groups to glass-filled composites and one commercial compomer after 24 h, 1 week, 1, 3 and 6 months of exposure to simulated saliva solution (SLS). Flat dentin surfaces were acid-etched, primed, and photopolymerized. Composites were applied, photo-cured, and debonded in shear. The resin used in each composite was identical: ethoxylated bisphenol A dimethacrylate, triethylene glycol dimethacrylate, 2-hydroxyethyl methacrylate and methacryloxyethyl phthalate. Fillers consisted of am-ACP and milled ACP (m-ACP), and a strontium-containing glass (Sr-glass) at respective mass fractions of (40, 60, and 75) %.
Findings
90 % of the fracture surfaces in this study showed adhesive failure, with most of these occurring at the dentin/primer interface. 52 % of failures after 24 h immersion occurred at the primer/composite interface. After six months of SLS exposure, 80 % of specimens failed at the dentin/primer interface, with a 42 % overall reduction in bond strength.
Conclusions
Milled ACP composites showed initial mechanical advantages over am-ACP composites and the compomer, and produced a higher incidence of a failure mode consistent with stronger adhesion. Evidence is provided which suggests that milled ACP composites may offer enhanced potential in clinical bonding applications.
Keywords: amorphous calcium phosphate, shear bond strength, work to fracture, polymerization shrinkage stress, failure mode
INTRODUCTION
Amorphous calcium phosphate (ACP), as a bioactive filler in resin composites, responds to changes in the oral environment by releasing calcium and phosphate ions, which can potentially migrate into the tooth structure to form apatite [1–3]. As saliva already contains these ions in high concentrations, ACP composites must be placed at sites of potential demineralization to be truly effective. This may be achieved through its incorporation in orthodontic adhesives, crown and bridge adhesives, pit and fissure sealants, basing materials under amalgam or resin composites, or as part of a restorative resin composite itself. The composites in this study were modeled after the latter class of materials.
The highly agglomerative and non-reinforcing nature of as-made ACP suggests that composites utilizing it as a filler would be at a distinct mechanical disadvantage to similar composites incorporating a milled Sr-glass filler. Through milling ACP, a filler is prepared that, while still agglomerative, lacks the large, porous aggregates found in as-made ACP and has a median diameter an order of magnitude lower. The elimination of these highly porous particulates should improve the ACP filler/polymer interfacial properties, allowing for higher fill levels and improvements in the mechanical and overall handling properties of these bioactive composites.
Both as-made and milled ACP composites were used in this study to examine how ACP particle size and state of agglomeration affects the adhesive properties of the composite to dentin treated with a commercial 2-step adhesive after varying periods of immersion in SLS. These experimental composites, along with the same resin system using an ion-leachable glass filler as a control, were compared to one another and a commercial compomer. It is hypothesized that the improvements offered by milling ACP will increase the uniformity at the adhesive/composite interface, reducing the incorporation of flaws and aiding in the retention of bond strength over long periods of SLS immersion. The work to fracture and failure modality of de-bonded composites were used as additional tools in discerning the more subtle differences in mechanical and fracture behavior between different composite types.
MATERIALS AND METHODS
Synthesis and Characterization of the Fillers
Four treatment groups were used in the commission of this experiment: a commercial light-cure compomer (Dyract, Dentsply Caulk, Milford, DE, USA) and three resin-based composites, which used the same resin system but varied filler type and corresponding load-level to achieve the viscosities required of restorative materials. The three fillers consisted of as-made zirconia-hybridized ACP (am-ACP), milled zirconia-hybridized ACP (m-ACP), and a commercial strontium glass (Sr-glass; Dentsply Caulk, Milford, DE, USA; median particle diameters of 2.64 μm and 0.91 μm for volume and number distributions, respectively).
ACP filler was synthesized following a modified preparation protocol proposed by Eanes et al [3]. Zirconia-ACP precipitated instantaneously at 23 °C upon rapidly mixing equal volumes of a 800 mmol/L Ca(NO3)2 solution, a 536 mmol/L Na2HPO4 solution that contained a molar fraction of 2 % Na4P2O7, and an appropriate volume of a 250 mmol/L ZrOCl2 solution (mole fraction of 10 % ZrOCl2 based on the Ca reactant). The reaction pH varied between 8.6 and 9.0. The suspension was filtered, the solid phase subsequently washed with ice-cold ammoniated water, then acetone, and finally lyophilized. Wet ball-milling (planetary ball mill PM100; Retch, Inc., Newtown, PA, USA) of am-ACP powder was performed as follows: 23 g am-ACP, 550 g high density ZrO2 grinding balls (diameter = 3 mm; Glen Mills Inc., Clifton, NJ, USA) and 150 mL analytical grade isopropanol (J.T. Baker, Phillipsburg, NJ, USA) were sealed in the grinding jar and milled for 3.5 h at 42 rad/s with rotation reversed every 15 min. The wet powder was separated from the grinding balls by sieving and the remaining isopropanol evaporated in vacuum oven (Squaroid Lab-Line vacuum oven, Melrose Park, IL, USA) at 70 °C for 24 h. To avoid exposure to moisture that may lead to the premature conversion of ACP into crystalline apatite, both fillers were kept under vacuum (2.7 kPa) until utilized in composite formulation.
The amorphous state of both as-made and milled ACP powders was verified by powder X-ray diffraction (XRD: Rigaku D/max diffractometer, Rigaku/USA Inc., Danvers, MA, USA) and Fourier-transform infrared spectroscopy (FTIR: Nicolet Magna-IR FTIR System 550 spectrophotometer, Nicolet Instrument Corporation, Madison, WI, USA).
The particle size distribution (PSD) of the fillers was determined using laser obscuration concurrently with a computerized inspection system (CIS-100 Particle Size Analyzer: Ankersmid LTD., Yokneam, Israel). Approximately 3 mg of filler were dispersed in 3 g of resin (see Table 1), and the suspension briefly ground with a mortar and pestle to simulate the effect of hand spatulation. Five repetitive measurements were performed for each filler type.
Table 1.
Monomers and components of photo-initiator system employed in the study.
| Chemical name | Acronym | Type | Mass Fraction, % |
|---|---|---|---|
| ethoxylated bisphenol A dimethacrylate | EBPADMA | Base monomer | 62.8 |
| triethylene glycol dimethacrylate | TEGDMA | Diluent monomer | 23.2 |
| 2-hydroxyethyl methacrylate | HEMA | Surface active monomer | 10.4 |
| methacryloxyethyl phthalate | MEP | Surface active monomer | 2.6 |
| camphorquinone | CQ | Photo-activator | 0.2 |
| ethyl-4-N,N-dimethylaminobenzoate | 4EDMAB | Photo-reductant | 0.8 |
Resin Formulation
The experimental resin was formulated from the following commercially available dental monomers (Esstech, Essington, PA, USA). The chemical names, composition of the resin, and the acronyms for the monomers used throughout this manuscript are provided in Table 1. The photoactivated system was made from mixing EBPADMA, TEGDMA, HEMA and MEP with the photoinitiator system comprising CQ and 4EDMAB. The combined system was left overnight with magnetic stirring to ensure proper mixing. One batch was used for preparing all specimens. For the sake of brevity, this system will hereon be referred to as ‘ETHM resin’.
Preparation of Composite Paste
Particle size analysis and scanning electron microscopy are themselves not enough to compare the usefulness of two fillers. To get the entire picture, one must examine how said fillers interact with a desired resin system, and how the resulting composites perform in the physical, chemical, and mechanical tests relevant to the intended clinical application. In this instance, the composite’s adhesive bond strength to dentin was tested as a means to determine their potential for restorative applications. Initial composite formulations contained m-ACP and Sr-glass at 40 % by mass, but these pastes were judged by Dr. Schumacher (the chief scientist of the Clinical Program at the Paffenbarger Research Center, ADAF) to be too flowable for a restoration. Therefore, filler content was increased until suitably high viscosities were achieved at 60 and 75 % mass fractions, respectively.
Pastes were made by hand-mixing ETHM resin with am-ACP (40 % filler mass fraction), m-ACP (60 % filler mass fraction), or Sr-glass (75 % filler mass fraction). Mixing times varied according to the filler mass fractions used, but followed the same principle: filler and resin were placed in a small beaker and hand-mixed with a spatula until the powder was wetted, then the mixture was transferred to dental slab (flat glass block), where it was further pressed until a uniform consistency was achieved. The homogenized pastes were kept under a moderate vacuum (2.7 kPa) overnight to eliminate the air entrained during mixing.
Shrinkage Stress
A cantilever-beam tensometer (Polymer shrinkage tensometer, American Dental Association Foundation, Chicago, IL, USA) was used to measure the polymerization shrinkage stress development (PSSD) of the am-ACP, m-ACP and Sr-glass composites during the curing process. The bonding surfaces of two 6 mm diameter quartz rods were ground flat using 600 grit wet silicon carbide paper. They were coated several times with a silane agent solution to aid in bonding to the composite and then placed in a 70 °C oven for 40 min to remove bound acetone. The rods were then placed in the collets with the silanized surfaces facing each other, and a spacer used to fix them exactly 2.25 mm from one another. The composite was injected into the PTFE tubing that connected the rods, and a dental curing light was shone upwards through the bottom reference rod for 60 s. Tests were performed at least 3 times to ensure reproducibility.
The shrinkage stresses developed in a composite are governed primarily by resin composition and its mass fraction. Given that the ETHM-based composites in this study have three very different resin mass fractions, it should be acknowledged that the differences in shrinkage stress presented later should not be surprising, nor are they properties unique to the individual fillers. Rather, they are used here to provide a more complete picture from the clinical perspective, where one might be just as concerned with a restorative’s shrinkage behavior as with its bonding characteristics. Additionally, it is hoped the inclusion of shrinkage data will be beneficial to readers less familiar with the subject, who may be unaware of the specific physical, chemical and mechanical effects of varying resin content.
Bonding Protocol
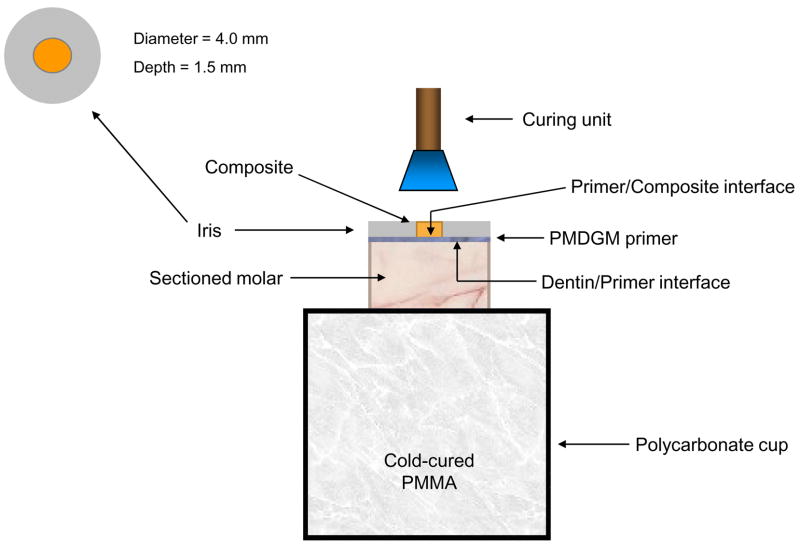
The occlusal surfaces of extracted, caries-free, human molars were removed and their roots embedded in polycarbonate holders with chemical curing poly (methyl methacrylate) tray resin (Bosworth Fastray Powder and Liquid, Bosworth Company, Skokie, IL, USA). The exposed dentin surfaces were ground flat perpendicular to the longitudinal axis of the teeth with 320 grit silicon carbide paper. The dentin was dried, then conditioned for 15 s with a 38 % by mass phosphoric acid gel (Etch-Rite, Pulpdent Corporation, Watertown, MA, USA). The acid was rinsed away with distilled water for 10 s, and a moistened Kim-wipe was used to blot the surface until near dry. A coating of PMGDM/acetone primer (DenTASTIC UNO, Pulpdent Corporation, Watertown, MA, USA) was applied, after which it was air-dried for 10 s to remove the solvent. Following a second primer application and subsequent solvent removal, the primer was cured with visible light for 10 s (Spectrum Curing Light, Dentsply Caulk Limited, Milford, DE USA). A teflon-coated iris (4 mm in diameter and 1.5 mm thick) that defined the bonding area was positioned on the tooth surface with a polycarbonate sleeve, which also weighed down the iris to prevent leakage of uncured composite outside of the bonding area (see Figure 1a). It was then filled by one of the four composites and light-cured for 60 s. The assembly was exposed to air for 5 min to allow residual curing, after which it was immersed in a 37 °C saliva-like solution [4] for one of the following times: 24 h, 1 week, 1 month, 3 months, and 6 months.
Fig. 1.
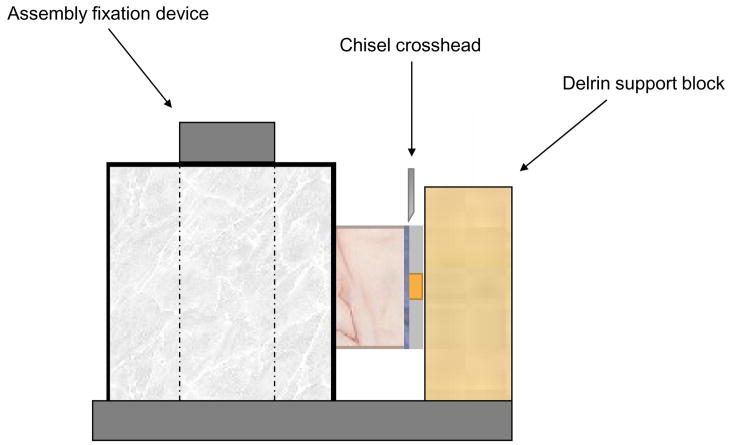
Schematic diagram of bonding protocol (a), and the shear bond strength testing assembly (b).
Shear Bond Strength Measurements
Specimens, in order to ensure debonding in shear mode, were placed in the test apparatus and fixed such that their iris surface was flush against the Teflon support block (Figure 1b). A computer-controlled universal testing machine (Instron 5500R, Instron Corp., Canton, MA, USA) was used to test shear bond strength (SBS) normal to the longitudinal axis of the tooth, at a crosshead speed of 0.5 mm/min. Shear bond strength was calculated according to
| (1) |
where: P = applied load at failure and D = diameter of the cured composite as defined by the inner diameter of the iris. Work to fracture (WTF) was automatically calculated by the Instron software (Merlin Software Series 9) as the area under the load-displacement curve from specimen contact to fracture.
Fracture Surface Characterization
Initial qualitative assessments of specimen fracture surfaces (tooth and iris) were made immediately after testing using a stereomicroscope at various magnifications (Leica StereoZoom 6, Leica Microsystems, Wetzlar, Germany), and any observations regarding the surface condition (i.e. irregularities, general mode of failure) were recorded. Tooth and iris surfaces were then digitally photographed (Leica MZ16 Optical Stereomicroscope, Wetzlar, Germany; QCapture Pro, QImaging Corporation, Surrey, British Columbia, Canada) and imaging software was used to measure the surface areas of different failure modes (ImageJ, National Institutes of Health, Bethesda, MD, USA).
Statistical Analysis
One standard deviation (SD) is given in this paper for comparative purposes as the estimated standard uncertainty of the measurements. Experimental data were analyzed by 2-way analysis of variance (ANOVA; α = 0.05). Significant differences between specific groups were determined by pair-wise multiple comparisons (Holm-Sidak method; unequal variances). These values are not intended for comparison with data obtained in other laboratories under different conditions.
RESULTS
Both the as-made and milled ACP employed in this study showed no discrete XRD peaks; their XRD patterns consisted of two diffuse, broad bands resembling XRD spectra of noncrystalline substances such as glasses and certain polymers. Corresponding FTIR spectra showed only two wide bands typical for phosphate stretching and phosphate bending of noncrystalline calcium phosphate in the region of (1200 to 900) cm−1 and (630 to 500) cm−1, respectively.
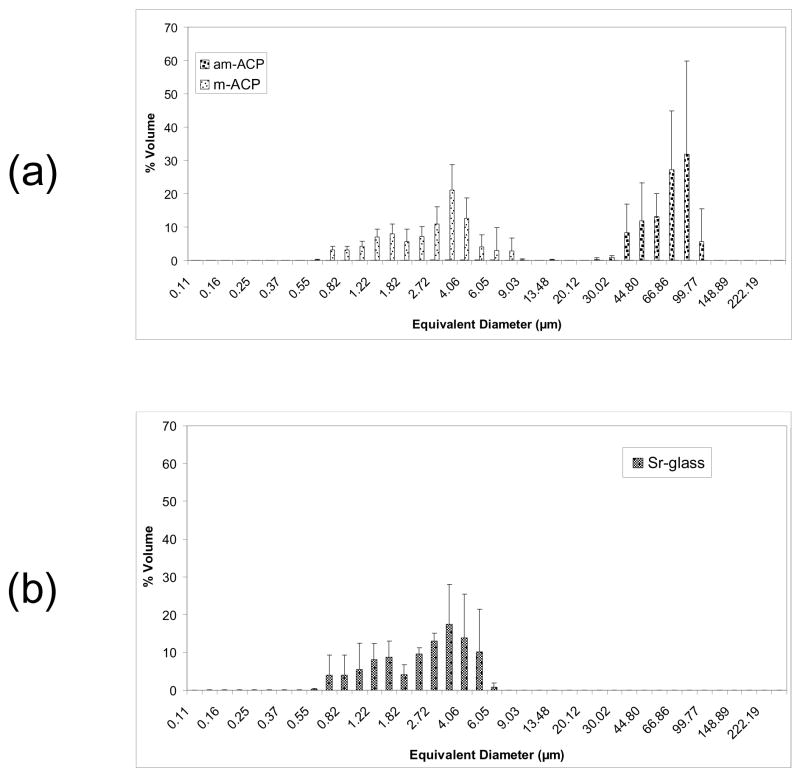
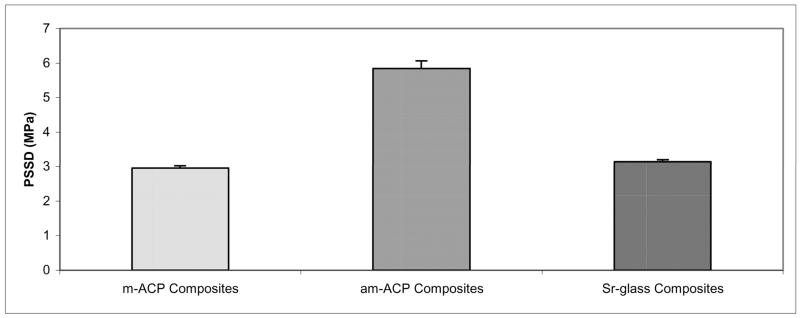
The results of PSD analysis are shown in Figure 2. Volume distributions show the milling process to have caused a shift in median diameter (dm) from (58.23 ± 14.44) μm for am-ACP to (3.10 ± 0.88) μm for m-ACP, a reduction of 95 %. The Sr-glass filler had a dm of (2.64 ± 0.86) μm. The number distributions for am-ACP, m-ACP and Sr-glass (not pictured) show median diameters of (0.85 ± 0.03) μm, (0.78 ± 0.01) μm and (0.91 ± 0.17) μm, respectively. While the number distributions appear relatively similar for each filler, measurements for m-ACP reflect the lack of heterogeneous agglomerates, with a percent error nearly half that of am-ACP and Sr-glass (27.1 % vs. 54.9 % and 50.1 %, respectively). The maximum stresses achieved by am-ACP, m-ACP and Sr-glass composites during PSSD measurements are shown in Figure 3. As-made ACP composites develop significantly higher stresses during curing [(5.85 ± 0.22) MPa] than both m-ACP and Sr-glass composites [(2.92 ± 0.07) MPa and (3.15 ± 0.05) MPa, respectively]. Given that shrinkage stress is governed primarily by resin mass fraction, and m-ACP and Sr-glass composites contain 33 % and 58 % less resin by mass than am-ACP composites, these results are not at all surprising.
Fig. 2.
Volume density particle size distributions of the (a) as-made ACP, milled ACP and (b) Sr-glass used in this study. The standard deviation (SD; indicated by a bar) is taken as a measure of the standard uncertainty.
Fig. 3.
Shrinkage stress developed during polymerization (PSSD) of the composites utilizing the ETHM resin system in this experiment.
In evaluation of the shear bond strength responses, there was marked variation within and across the treatment groups. For the as-made ACP composites, SBS values ranged from 2.4 – 24.8 MPa, and WTF from 1.0 – 55.9 N·mm. For the milled ACP composites, SBS and WTF ranged from 4.3 – 35.0 MPa and from 1.8 – 160.7 N·mm, respectively. For the Sr-glass composites, SBS and WTF ranged from 6.8 – 38.3 MPa and 3.7 – 96.6 N·mm, respectively. For the commercial compomer, SBS and WTF ranged from 7.1 – 36.4 MPa and 5.9 – 69.8 N·mm, respectively. Due to the wide ranges in SBS and WTF, an evaluation of failure mode was performed to determine if correlations existed between the nature of shear failures and the mechanical properties of de-bonded specimens.
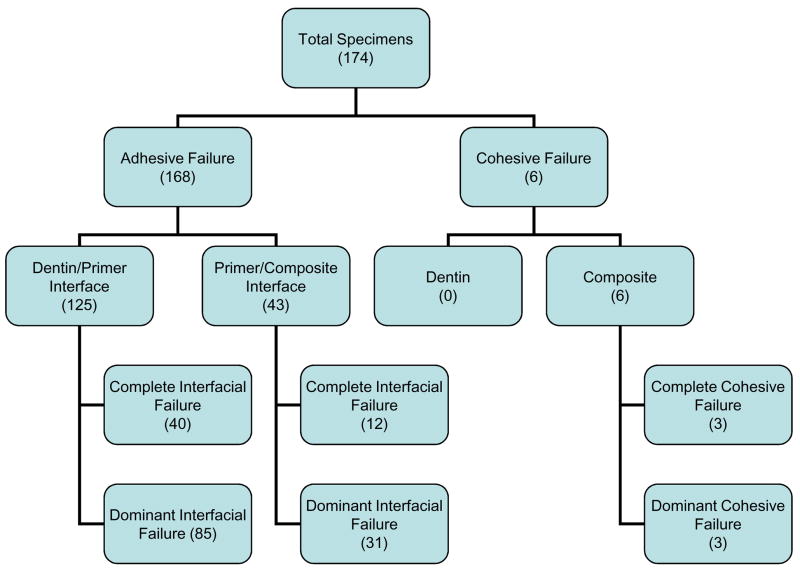
Of the 174 fracture surfaces analyzed in this study, three distinct modes of failure were observed – cohesive failure within the composite and adhesive failures at either the dentin/primer or primer/composite interface (Figure 4). Each of these failure modes was broken down into two subcategories – complete, in which the fracture surface showed only composite or individual adhesive interface, and dominant, in which the fracture surface showed mixed adhesive interfaces and/or composite, with the majority occupied by composite or an adhesive interface. The distinction between complete and dominant was made in order to shed light on differences in mechanical behavior brought about by the transition from complete to mixed interfacial failures.
Fig. 4.
A breakdown of the observed failure modes, with numbers in each box indicating how many specimens fall under that classification.
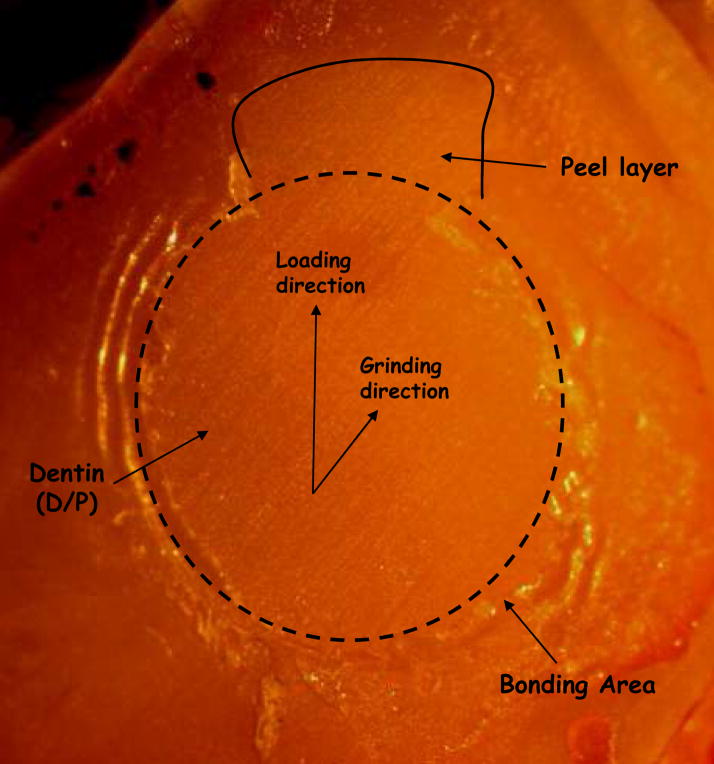
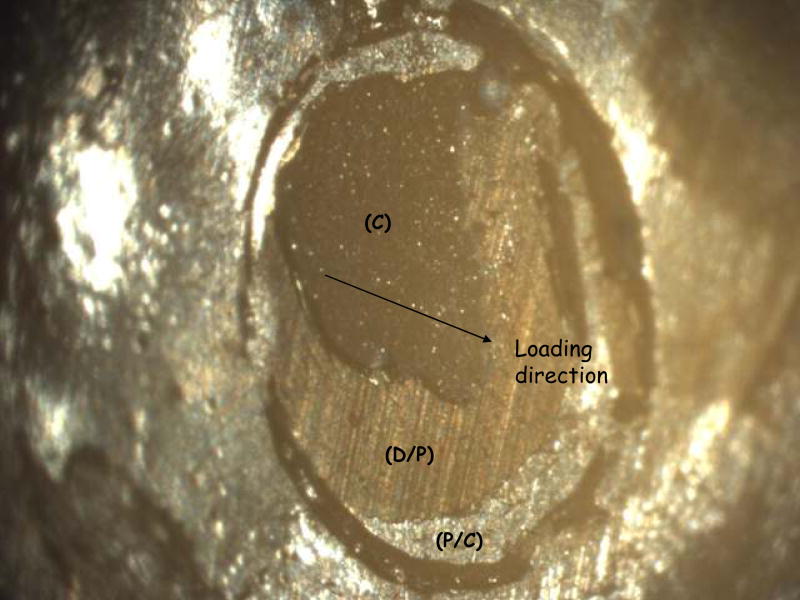
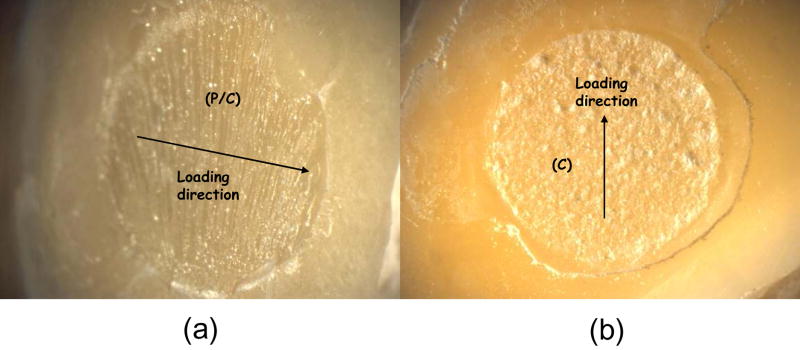
A fracture surface common to both complete and (most) dominant dentin/primer failures is pictured in Figure 5. Regions of visible dentin were denoted as ‘dentin/primer interface’. Dentin is distinguishable by the parallel lines left from the silicon carbide paper used to grind the surface (they are also clearly visible in ‘D/P’ area of Figure 7). In Figure 5, the parallel grinding lines can be seen to continue outside of the dotted circle that delineates the bond area, which will be referred to here as a ‘peel layer’. Figure 6a shows a surface characteristic of the primer/composite failure mode, in which the primer appears on the surface in the form of parallel or fanned striations, which may indicate that the primer itself has failed cohesively. Striations can be distinguished from the grinding lines by their visibly raised surfaces; grinding lines are shallow enough that areas on which they occur appear flat. Figure 6b shows one of the rare examples of a complete cohesive failure, marked by the raised, irregular surface of the composite. Aside from containing all three distinct failure modes, the bond area in Figure 7 shows a flat, uniform primer surface more suggestive of de-lamination at that interface, indicating poor adherence of the composite.
Fig. 5.
Example of an adhesive failure showing primarily dentin/primer (D/P) interface.
Fig. 7.
A specimen showing adhesive failure at both interfaces (D/P, P/C), as well as cohesive (C) failure within the composite.
Fig. 6.
Example of an adhesive failure showing primarily primer/composite (P/C) interface (a), and a failure occurring cohesively (C) within the composite (b).
Dominant failure at the dentin/primer interface was seen to occur most often (49 % of all specimens), with the corresponding complete interfacial failures accounting for an additional 23 % of observed fracture surfaces. Complete failure at the primer/composite interface accounted for less than 7 % of failures, and did not occur at every immersion time. The same is true of complete and dominant cohesive failures within the composite, which accounted for fewer than 4 % of the observed failures. However, it may be worth noting that these cohesive failures occurred only for Sr-glass composites, with the SBS of complete cohesive failures consistently placing in the top 15 % of all treatments at corresponding immersion times. Given the sporadic occurrence of these failure modes (complete primer/composite and both cohesive), they were not included in detailed analyses, but still were used as a means to examine overall trends in failure modes as functions of treatment and immersion time.
Factors: Failure Mode and Treatment
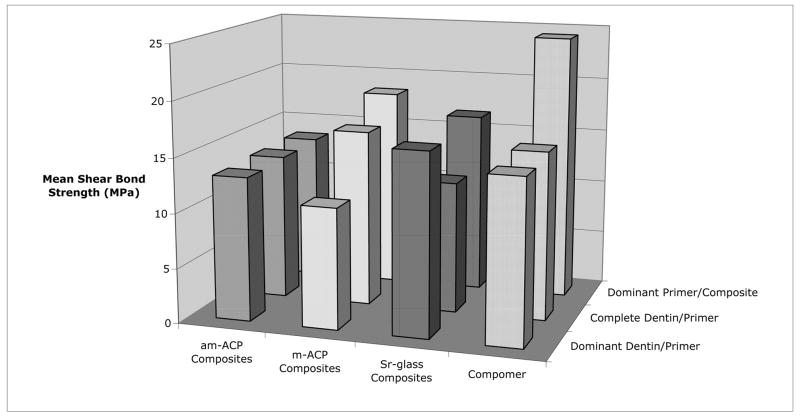
Shear bond strength data, in terms of treatment and failure mode, is listed in Table 2 and plotted in Figure 8. A significant interaction did exist between these two factors. Sr-glass composites were significantly stronger than those containing m-ACP within the dominant dentin/primer failure mode. The compomer was superior to am-ACP composites within the dominant primer/composite failure mode. Within the compomer treatment group, dominant primer/composite failures were significantly stronger than those occurring at the dentin/primer interface. Milled ACP composites showed that dominant primer/composite failures were significantly stronger than those showing dominant dentin/primer failure. Overall comparisons among failure modes showed the dominant primer/composite failures to have a significantly higher SBS than both modes occurring at the dentin/primer interface.
Table 2.
Mean shear bond strength (SBS) data [with standard deviation (SD) and the number of specimens (n)] grouped by treatment and failure mode.
| Treatment | Dominant P/C | Dominant D/P | Complete D/P | ||||||
|---|---|---|---|---|---|---|---|---|---|
| SBS (MPa) | SD | n | SBS (MPa) | SD | n | SBS (MPa) | SD | n | |
| am-ACP | 13.5D | 4.3 | 10 | 13.1 | 4.1 | 14 | 13.3 | 6.7 | 11 |
| m-ACP | 18.4F | 7.9 | 12 | 11.0B | 4.1 | 20 | 16.1 | 11.5 | 5 |
| Sr-glass | 16.6 | 2.1 | 6 | 16.5A | 6.2 | 22 | 12.0 | 3.7 | 14 |
| Compomer | 24.3C | 10.0 | 4 | 14.9E | 5.7 | 29 | 15.4 | 3.7 | 14 |
| Overall | 17.4G | 6.6 | 31 | 14.1H | 5.9 | 85 | 13.8I | 5.9 | 40 |
Significantly greater than B (P=0.002)
Significantly greater than D (P=0.002) and E (P=0.003).
Significantly greater than B (P=0.001).
Significantly greater than H (P=0.00109) and I (P=0.00806).
Fig. 8.
Effect of failure mode on the shear bond strength of the different treatments.
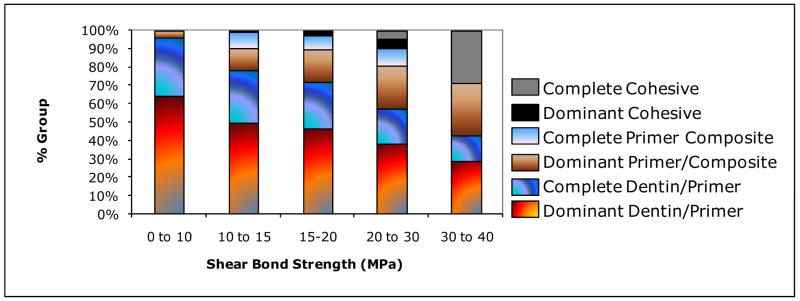
Figure 9 shows a clear shift in failure mode with an increase in the shear bond strength. Failure at the dentin/primer interface (dominant and complete) dominates the weakest bond strengths (0 to 10) MPa. The incidence of this mode steadily declines with increasing SBS and a corresponding increase in dominant primer/composite failures is observed. The few complete primer/composite and dominant cohesive failures observed were evenly distributed between (10 to 30) MPa, while complete cohesive failures were observed in a significant number of specimens breaking over 30 MPa.
Fig. 9.
Breakdown of failure modes grouped according to shear bond strength ranges.
Factors: Treatment and Immersion Time
Though immersion time did have an effect on shear bond strength, it did not interact significantly with the different treatments. Pair-wise multiple comparisons of overall bond strengths at each immersion time show the following significant difference: 24 h > [1 month, 3 months, 6 months]. Introducing treatment as a parameter has the effect of reducing sample sizes and increasing scatter, thereby clouding the results and indicating that significant differences in SBS exist only within the m-ACP treatment group: 24 h > [1 month, 3 months, 6 months].
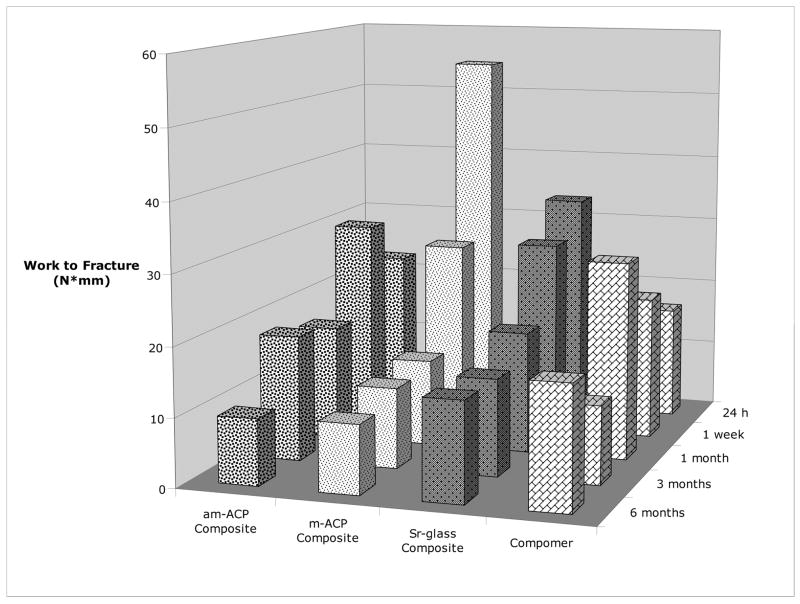
With work to fracture (WTF) as the dependent variable, a significant interaction was seen to exist between treatment and immersion time (Figure 10). Again, m-ACP performed better at 24 h than after 1 month, 3 months, and 6 months of immersion, while also significantly outperforming am-ACP composites and the commercial compomer at 24 h. The trend of increasing WTF over the compomer’s first month of immersion is attributed to the secondary curing process this class of materials undergoes. The uptake of water initiates an acid-base reaction between carboxylic groups and areas of filler.
Fig. 10.
Effect of immersion time on the work to fracture of different treatments.
Factors: Failure Mode and Immersion Time
When separately applying logarithmic fits to both the mean SBS and WTF of each treatment as a function of time (Table 4), a clear division can be seen between the m-ACP/Sr-glass groups and am-ACP/compomer groups. The former group shows much higher correlations than the latter. Both the SBS and WTF show consistently stronger correlations with time when they are averaged according to failure mode. Nevertheless, a 2-way ANOVA showed that failure mode had no more an interaction with immersion time than treatment.
Table 4.
Correlations between mechanical data and immersion time for different factors.
| Factors (Treatment or Failure Mode) | R2 (Logarithmic fit) | |
|---|---|---|
| SBS vs. Time | WTF vs. Time | |
| am-ACP | 0.63 | 0.01 |
| m-ACP | 0.89 | 0.90 |
| Sr-Glass | 0.98 | 0.95 |
| Compomer | 0.51 | 0.52 |
| Dominant D/P | 0.97 | 0.95 |
| Complete D/P | 0.93 | 0.95 |
| Dominant P/C | 0.98 | 0.95 |
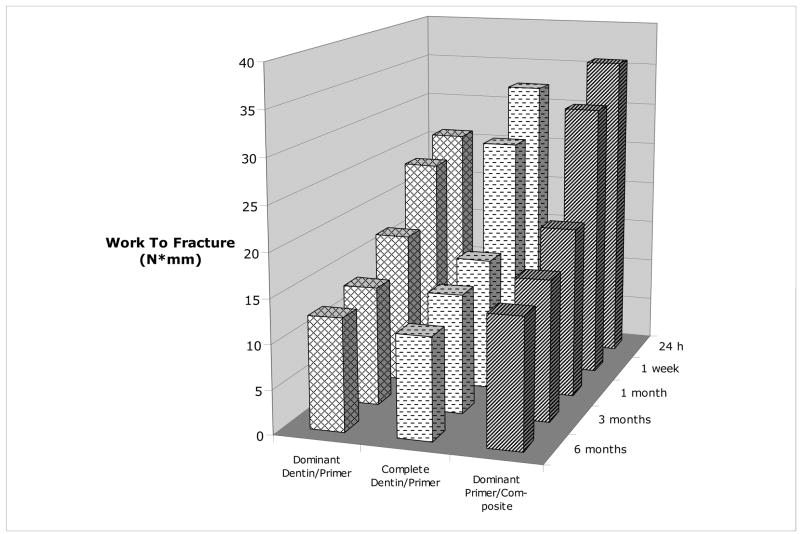
Multiple comparisons among individual failure modes resulted in minimal additional understanding. Among SBS data, significant differences existed only within the dominant primer/composite (24 h > 6 months) and dominant dentin/primer failure modes (1 week > 6 months). Analysis of the WTF (Figure 11) showed the only significant difference to be for the dominant dentin/primer failure mode (1 week > 6 months).
Fig. 11.
Effect of immersion time on the work to fracture of different failure modes.
DISCUSSION
We have previously shown that milling ACP has a significant effect on its physical properties (namely, the elimination of large, porous agglomerates) and an overall positive effect on the physicochemical profile of resin composites incorporating it as a filler [5–8]. In this study, we explore the differences in shear bond strength, work to fracture, and failure mode between milled and as-made ACP composites, a commercial compomer, and a glass-filled composite after varying periods of immersion in a saliva-like solution.
Compared to other methods that calculate particle size from a secondary property such as settling speed (sedimentation technique) or refractive index (laser diffraction technique), particle size analysis by laser obscuration uses the time-of-transition principle to directly measure a particle’s size. As such, there is a much greater freedom in choosing the dispersing medium for the sample. In this case, both am-ACP and m-ACP were dispersed in ETHM resin. Though it was not possible to perform this test using the same resin/filler ratios present in the composite pastes (the opacity and high viscosity would preclude measurement), this should provide a closer approximation of the filler particle size distribution within the resin matrix.
The plot in Figure 2 containing both ACP fillers shows the shift in sample volume and increase in particle size homogeneity the milling process has produced. Of particular importance is the absence of agglomerates ranging from (25 to 100) μm in the m-ACP sample, as the introduction of these agglomerates into a resin matrix can result in poor handling properties, decreased degree of cure, increased water uptake and weak, brittle composites [5–10]. As far as can be seen, the heterogeneity these agglomerates introduce into composites has only one positive effect – the increased release of Ca2+ and PO43− [5]. The diminution of these particles and reduction of their porosity through milling makes the powder easier to wet, allowing fill levels to exceed 60 % by mass and possibly bringing Ca and PO4 release back to the level of am-ACP composites.
Resin-based composites undergo varying degrees of shrinkage when cured, and the ensuing stress is imparted to the tooth either directly or through an adhesive substrate. When superposed with the cyclic stresses subject to the tooth from mastication, this shrinkage stress can significantly alter its fatigue behavior. High shrinkage stresses can also lead to gap formation, permitting the invasion of oral fluids and bacteria [11], in turn leading to postoperative sensitivity, secondary caries, pulpal damage [10–11], and microcracks in the cervical enamel [12–14]. Shrinkage stress therefore plays an integral role in the life of a restored tooth, and should be one of the primary considerations in the selection of a restorative composite for in vivo applications.
One of the primary drawbacks to am-ACP composites is the high shrinkage stress they experience upon curing. Aside from altering the resin composition, the only way to mitigate shrinkage is to increase the amount of filler in the composite. Unfortunately, attaining a mass fraction greater than 40 % with am-ACP requires considerable effort, and yields a flaky paste that would essentially be clinically useless. Milled ACP, on the other hand, can easily achieve fill levels up to 70 % by mass, allowing the creation of composite pastes with a wide variety of handling properties. These qualities extend the applicability of the filler and composites in which it is contained, indicating a rather significant advantage over am-ACP. With a resin mass fraction of only 40 %, the m-ACP composites in this study exhibit handling properties and shrinkage stresses more comparable to Sr-glass composites (see Figure 3). As the non-reinforcing nature of ACP puts its composites at a distinct mechanical disadvantage to most other commercial composites, these similarities to a glass-filled composite are seen as welcome improvements.
Adhesive failures occurred in almost 97 % of all specimens, with 72 % occurring at the dentin/primer interface alone. Failures at the primer/composite interface were less common (25 %), while cohesive failures within the composite were very rare (3 %). Bond failure sites are microscopic in nature, and often require the magnification of a scanning electron microscope for identification. The photographs used to analyze failures in this study depict fracture surfaces at 20 times their normal size, and as such are used only to provide descriptions of obvious modes of bond failure. It should also be noted that no cohesive dentinal failures were observed in this study. Given that the cohesive fracturing of dentin is rarely observed clinically and is not necessarily an indication of superior bond strength [15–16], this fact should reflect favorably upon the chisel-on-iris manner of loading presented herein.
Behind the ‘dominant dentin/primer’ failure mode, peel layers (like the one pictured in Figure 5) were the second most commonly noted mechanism, occurring in 34 % of all specimens and only in conjunction with adhesive failures. Ninety percent of all peel layers occurred within the dentin/primer interface failures, accounting for roughly 42 % and 45 % of the ‘dominant’ and ‘complete’ groups, respectively. When considered as a failure mode of their own, specimens with a peel layer had an average SBS of 11.8 MPa, 14 % lower than the weakest failure mode (complete dentin/primer, 13.8 MPa). It is not an uncommon practice for some researchers to recalculate SBS with the peel layer included as part of the bond area. Whether the intent here is to diminish the strength of competing composites, or to deflate the already-weak strengths of some of their own specimens and label them as outliers, is uncertain. That practice seems subjective. Without a more detailed fractographic analysis, it is unclear whether failure initiated in the peel layer or if it was simply the result of delamination as the specimen failed. Therefore, the bond area in this case was not redefined, and SBS not recalculated.
The m-ACP composites exhibited higher work to fracture (WTF) over am-ACP and copolymer groups when tested at the 24h immersion time. However, the overall trends in SBS and WTF over time suggest behavior more akin to that of the glass-filled composites than of am-ACP composites. Analysis showed significant differences to exist between the overall SBS of the three primary failure modes: dominant primer/composite > [dominant and complete dentin/primer]. Of the four treatment groups, m-ACP composites showed the highest overall incidence (as well as after 24 hours, 1 week and 6 months immersion) of the dominant primer/composite failures (31 %), and the lowest incidence overall of complete dentin/primer interfacial failures (13 %). Therefore, composites with m-ACP produced a higher incidence of the failure mode consistent with stronger adhesion, and exhibited a response to SLS immersion more akin to glass-filled composites than to those containing am-ACP.
Reinforcing fillers achieve a physical bond to the polymer matrix. As such, they aid in stress transfer and strengthen composites to which they are added. Bonding between filler and resin may be achieved through a surface porosity in the filler (i.e. mechanically interlocking), or through the use of a coupling agent, which covalently bonds to both the filler particles and resin matrix. Given the inability of ACP to do either, it weakens the structure of composites into which it is incorporated. Thus, increasing the filler load level would be expected to cause a corresponding drop in mechanical properties. However, the results of this study were not supportive of this, as the majority of failures were observed at the interface between the primer and dentin substrate, and very rarely within the composite itself (indeed, never for milled ACP composites). Both as-made and milled ACP composites fell well within the range of reported SBS values for some commercial restoratives (10–35 MPa) [17,18]. Therefore, due to other additional advantages gained through milling, there appears to be significant potential for milled ACP composites to serve as a remineralizing restorative material [1,2].
Testing the shear bond strength of strong adhesives commonly produces cohesive failures in dentin [15,19], a failure mode not commonly observed in clinical settings. Clearly, this speaks to some disconnect between the test methods and the clinical situations they are intended to mimic. It follows, then, that an entirely new test be developed or the existing methods altered to maximize their clinical relevance. Paramount to achieving this goal are both the modification of bond area geometry to emulate the curved cavity shapes and complex stress distributions encountered clinically, and the alteration of test mechanics to represent the sub-critical cyclic loading that bonding systems and restorations are subject to in vivo.
The first approach has been somewhat addressed with the development of the microtensile method, which is usually performed in one of two manners: the trimming (or hourglass) or nontrimming technique. As suggested by the name, this method tests bonded surface areas that are quite small (approximately 1 mm2). This generally yields 5–8 specimens (or slabs) per tooth, allowing one to examine the variation in bond strength across contiguous portions of dentin or enamel. With the hourglass technique, an entire surface of the tooth is bonded and sectioned into individual specimens, and the adhesive interface then trimmed into an hourglass shape. Since the bonded surface area is determined after bonding and not before, this technique allows the testing of teeth prepared almost exactly as they are clinically. With the nontrimming technique, each of the 5–8 slabs is further sectioned (vertically), and the adhesive interface is (prepare to be surprised) not trimmed. Aside from yielding even more specimens per tooth, this technique apparently concentrates less stress on the adhesive bonds, as it has been able to measure the bond strengths of materials that produce relatively low strengths (as low as 5 MPa) [19–22].
These advantages, however, are not without their tradeoffs. Both microtensile techniques require considerably more labor than conventional shear tests, and the smaller bond areas incorporate fewer flaws than would be encountered on the clinical scale. Although this manner of testing does result in a much lower incidence of dentin failures (a fact acknowledged to be its primary advantage [19]), it does so at the cost of clinically relevant mechanics. The hourglass shape of microtensile specimens is specifically designed to ensure maximum stress development at the bonded interface, and the use of high-speed handpieces in trimming can cause premature failure of the bond (a problem not nearly as prevalent with nontrimmed specimens). Given these facts, it does not seem at all surprising that most of the resulting failure modes are adhesive in nature. It seems, though, that in designing a test to be clinically relevant, one should be just as, if not more, concerned with the means as one is with the end. For this reason, a fatigue-based or combined fatigue and modified bond geometry approach are recommended for future studies.
CONCLUSIONS
Using a 20 % increased fill level in m-ACP composites provided initial improvements in work to fracture over a commercial compomer and am-ACP composites, while offering a 50 % reduced shrinkage stress over the latter. Composites with m-ACP produced a higher incidence of the failure mode consistent with stronger adhesion, and exhibited a trend of mechanical response to SLS immersion more akin to glass-filled composites than to those containing am-ACP. This continues to provide evidence of the mechanical improvements one may achieve simply by milling ACP, and show milled ACP composites as offering potential in clinical bonding applications.
The high degree of scatter inherent to the shear bond test method is a problem that continues to require attention. The biological variability of the human species and anisotropic nature of the tooth itself both present significant obstacles, and though widespread standardization (loading mechanism, crosshead speed, etc.) may achieve some progress in this direction, altering the test method in the interest of clinical relevance might prove more beneficial in the long run. Modifying the shear bond strength test method to include the sub-critical cyclic loading restorations encounter in vivo is recommended for future studies.
Table 3.
| Table 3a. Mean shear bond strength (SBS) data and standard deviations (SD) grouped by treatment and immersion time. | ||||||||||
|---|---|---|---|---|---|---|---|---|---|---|
| Treatment | 24 hours | 1 week | 1 month | 3 months | 6 months | |||||
| SBS (MPa) | SD | SBS (MPa) | SD | SBS (MPa) | SD | SBS (MPa) | SD | SBS (MPa) | SD | |
| am-ACP | 16.2 | 5.1 | 16.3 | 3.2 | 13.5 | 5.9 | 14.8 | 6.1 | 10.9 | 2.0 |
| m-ACP | 22.7A | 9.8 | 15.0C | 8.8 | 12.7B | 6.1 | 12.2B | 5.0 | 11.0B,D | 2.4 |
| Sr-glass | 22.1 | 10.8 | 18.3 | 7.5 | 16.2 | 5.7 | 13.6 | 4.2 | 13.7 | 3.5 |
| Compomer | 19.0 | 4.0 | 16.3 | 5.3 | 19.6 | 9.4 | 12.9 | 3.7 | 13.1 | 4.2 |
| Table 3b. Mean work to fracture (WTF) data and standard deviations (SD) grouped by treatment and immersion time. | ||||||||||
|---|---|---|---|---|---|---|---|---|---|---|
| Treatment | 24 hours | 1 week | 1 month | 3 months | 6 months | |||||
| WTF (N*mm) | SD | WTF (N*mm) | SD | WTF (N*mm) | SD | WTF (N*mm) | SD | WTF (N*mm) | SD | |
| am-ACP | 25.8C | 14.4 | 29.8 | 15.8 | 16.6 | 12.5 | 18.2 | 12.5 | 9.6 | 3.3 |
| m-ACP | 54.5A | 57.6 | 27.4 | 35.6 | 12.6B | 9.8 | 11.7B | 9.6 | 10.0B | 4.5 |
| Sr-glass | 33.3 | 26.5 | 28.3 | 24.1 | 17.7 | 13.0 | 14.1 | 8.3 | 14.4 | 5.4 |
| Compomer | 16.6D | 14.5 | 20.9 | 12.5 | 28.9 | 22.6 | 11.3 | 4.9 | 17.8 | 18.0 |
| Table 3c. Treatment group and failure mode sample sizes. | ||||||
|---|---|---|---|---|---|---|
| Treatment | 24 hours | 1 week | 1 month | 3 months | 6 months | Overall |
| am-ACP | 5 | 5 | 11 | 10 | 10 | 41 |
| m-ACP | 6 | 6 | 8 | 9 | 10 | 39 |
| Sr-glass | 5 | 11 | 12 | 10 | 10 | 48 |
| Compomer | 6 | 11 | 10 | 10 | 10 | 47 |
| Dominant P/C | 4 | 8 | 5 | 6 | 8 | 31 |
| Complete P/C | 8 | 0 | 3 | 1 | 0 | 12 |
| Dominant D/P | 1 | 22 | 14 | 20 | 28 | 85 |
| Complete D/P | 7 | 3 | 14 | 12 | 4 | 40 |
| Dom. Cohesive | 1 | 0 | 2 | 0 | 0 | 3 |
| Comp. Cohesive | 2 | 0 | 1 | 0 | 0 | 3 |
Significantly greater than each value in group B (P<0.005).
Significantly greater than D (P=0.00331).
Significantly greater than each value in group B (P<0.0001), C (P<0.004) and D (P<0.0001).
Table 5.
| Table 5a. Shear bond strength (SBS) data and standard deviations (SD) grouped by failure mode and immersion time. | ||||||||||
|---|---|---|---|---|---|---|---|---|---|---|
| Failure Mode | 24 hours | 1 week | 1 month | 3 months | 6 months | |||||
| SBS (MPa) |
SD | SBS (MPa) |
SD | SBS (MPa) |
SD | SBS (MPa) |
SD | SBS (MPa) |
SD | |
| Dominant P/C | 22.1A | 6.7 | 18.1 | 8.4 | 16.7 | 7.7 | 15.0 | 4.0 | 13.8B | 2.1 |
| Complete P/C | 16.5 | 5.1 | - | - | 15.6 | 3.2 | 15.9 | - | - | - |
| Dominant D/P | 21.7 | - | 16.6C | 6.0 | 15.0 | 8.0 | 13.6 | 4.8 | 11.8D | 3.6 |
| Complete D/P | 17.6 | 8.9 | 13.9 | 4.0 | 13.4 | 5.5 | 12.0 | 6.0 | 11.8 | 1.2 |
| Dom. Cohesive | 17.5 | - | - | - | 21.4 | 7.4 | - | - | - | - |
| Comp. Cohesive | 33.5 | 1.2 | - | - | 24.0 | - | - | - | - | - |
| Table 5b. Work to fracture (WTF) data and standard deviations (SD) grouped by failure mode and immersion time. | ||||||||||
|---|---|---|---|---|---|---|---|---|---|---|
| Failure Mode | 24 hours | 1 week | 1 month | 3 months | 6 months | |||||
| WTF (N*mm) |
SD | WTF (N*mm) |
SD | WTF (N*mm) |
SD | WTF (N*mm) |
SD | WTF (N*mm) |
SD | |
| Dominant P/C | 35.7 | 22.4 | 31.4 | 30.8 | 19.4 | 20.7 | 15.9 | 8.8 | 14.6 | 3.7 |
| Complete P/C | 21.6 | 15.8 | - | - | 17.9 | 8.4 | 14.9 | - | - | - |
| Dominant D/P | 25.8 | - | 23.8A | 18.0 | 17.2 | 17.0 | 13.5 | 9.4 | 12.7B | 11.8 |
| Complete D/P | 32.3 | 57.2 | 26.9 | 25.8 | 15.0 | 10.1 | 13.5 | 11.8 | 11.6 | 1.6 |
| Dom. Cohesive | 18.0 | - | - | - | 32.9 | 18.6 | - | - | - | - |
| Comp. Cohesive | 61.6 | 2.5 | - | - | 37.1 | - | - | - | - | - |
Significantly greater than B (P=0.00133).
Significantly greater than D (P=0.00382).
Significantly greater than B (P=0.0114).
Acknowledgments
Support for this research was provided from the grant R01 DE13169-09 from the National Institute of Dental and Craniofacial Research to Dr. Skrtic. We gratefully acknowledge generous contribution of monomers from Esstech, Essington, PA, USA.
Footnotes
“Official contribution of the National Institute of Standards and Technology; not subject to copyright in the United States”
Publisher's Disclaimer: Disclaimer: Certain commercial materials and equipment are identified in this work for adequate definition of the experimental procedures. In no instance does such identification imply recommendation or endorsement by the American Dental Association or the National Institute of Standards and Technology, or that the material and the equipment identified is necessarily the best available for the purpose.
References
- 1.Skrtic D, Hailer AW, Takagi S, Antonucci JM, Eanes ED. Quantitative assessment of the efficacy of amorphous calcium phosphate/methacrylate composites in remineralizing caries-like lesions artificially produced in bovine enamel. J Dent Res. 1996;75(9):1679–1686. doi: 10.1177/00220345960750091001. [DOI] [PubMed] [Google Scholar]
- 2.Skrtic D, Antonucci JM, Eanes ED. Amorphous calcium phosphate-based bioactive polymeric composites for mineralized tissue regeneration. J Res Natl Inst Stands Technol. 2003;108:167–182. doi: 10.6028/jres.108.017. [DOI] [PMC free article] [PubMed] [Google Scholar]
- 3.Eanes ED, Gillessen IH, Posner AS. Intermediate states in the precipitation of hydroxyapatite. Nature. 1965;208:365–367. doi: 10.1038/208365a0. [DOI] [PubMed] [Google Scholar]
- 4.Ten Cate JM, Duijsters PPE. Alternating demineralization and remineralization of artificial enamel lesions. J Caries Res. 1982;16:201–210. doi: 10.1159/000260599. [DOI] [PubMed] [Google Scholar]
- 5.Lee SY, Regnault WF, Antonucci JM, Skrtic D. Effect of particle size of an amorphous calcium phosphate filler on the mechanical strength and ion release of polymeric composites. J Biomed Mater Res B: Appl Biomater. 2007;80B:11–17. doi: 10.1002/jbm.b.30561. [DOI] [PMC free article] [PubMed] [Google Scholar]
- 6.Antonucci JM, Skrtic D. Polymers for Dental and Orthopedic Applications. Taylor and Francis Group, LLC; 2007. pp. 217–242. [Google Scholar]
- 7.O’Donnell JNR, Skrtic D, Antonucci JM. Amorphous calcium phosphate composites with improved mechanical properties. J Bioact Compat Polym. 2006;21(3):169–184. doi: 10.1177/0883911506064476. [DOI] [PMC free article] [PubMed] [Google Scholar]
- 8.O’Donnell JNR, Skrtic D, Antonucci JM. Illuminating the role of agglomerates on critical physicochemical properties of amorphous calcium phosphate composites. J Comp Mater. doi: 10.1177/0021998308094797. In press. [DOI] [PMC free article] [PubMed] [Google Scholar]
- 9.O’Donnell JNR, Antonucci JM, Skrtic D. Vinyl conversion, water sorption, and ion release from ACP composites. 35th Annual AADR Meeting; Orlando. March 8–11, 2006. [Google Scholar]
- 10.Koran P, Kurschner R. Effect of sequential versus continuous irradiation of a light-cured resin composite on shrinkage, viscosity, adhesion, and degree of polymerization. Am J Dent. 1998;11:17–22. [PubMed] [Google Scholar]
- 11.Eick JD, Welch FH. Polymerization shrinkage of posterior composite resins and its possible influence on postoperative sensitivity. Quintessence Int. 1986;17:103–111. [PubMed] [Google Scholar]
- 12.Garberoglio R, Coli P, Brannstrom M. Contraction gaps in Class II restorations with self-cured and light-cured resin composites. Am J Dent. 1995;8:303–307. [PubMed] [Google Scholar]
- 13.Sakaguchi RL, Versluis A, Douglas WH. Analysis of strain gage method for measurement of post-gel shrinkage in resin composites. J Dent Mater. 1997;13:233–239. doi: 10.1016/S0109-5641(97)80034-6. [DOI] [PubMed] [Google Scholar]
- 14.Bowen RL, Nemoto K, Rapson JE. Adhesive bonding of various materials to hard tooth tissues: Forces developing in composite materials during hardening. J Amer Dent Assoc. 1983;106:475–477. doi: 10.14219/jada.archive.1983.0078. [DOI] [PubMed] [Google Scholar]
- 15.Versluis A, Tantbirojn D, Douglas WH. Why do shear bond tests pull out dentin? J Dent Res. 1997;76(6):1298–1307. doi: 10.1177/00220345970760061001. [DOI] [PubMed] [Google Scholar]
- 16.Pashley DH, Carvalho RM, Sano H, Nakajima M, Yoshiyama M, Shono Y, Fernandes CA, Tay F. The microtensile bond test: A review. J Adhes Dent. 1999;1:299–309. [PubMed] [Google Scholar]
- 17.Sturdevant CM, Roberson TM, Heyman HO, Sturdevant JR. The Art and Science of Operative Dentistry. St. Louis; Mosby: 1995. [Google Scholar]
- 18.Craig RG. Restorative Dental Materials. St. Louis; Mosby: 1993. [Google Scholar]
- 19.Pashley DH, Sano H, Ciucchi B, Yoshiyama M, Carvalho RM. Adhesion testing of dentin bonding agents: A review. J Dent Mater. 1995;11:117–125. doi: 10.1016/0109-5641(95)80046-8. [DOI] [PubMed] [Google Scholar]
- 20.Bouillaguet S, Ciucchi B, Jacoby T, Wataha JC, Pashley D. Bonding characteristics to dentin walls of Class II cavities, in vitro. Dent Mater. 2001;17:316–321. doi: 10.1016/s0109-5641(00)00089-0. [DOI] [PubMed] [Google Scholar]
- 21.Ferrari M, Goracci C, Sadek F, Cardoso PEC. Microtensile bond strength tests: scanning electron microscopy evaluation of sample integrity before testing. Eur J Oral Sci. 2002;110:385–391. doi: 10.1034/j.1600-0722.2002.21317.x. [DOI] [PubMed] [Google Scholar]
- 22.Manhart J, Chen HY, Mehl A, Weber K, Hickel R. Marginal quality and microleakage of adhesive Class V restorations. J Dent. 2001;29:123–130. doi: 10.1016/s0300-5712(00)00066-x. [DOI] [PubMed] [Google Scholar]


