

Abstract
The 22q11 deletion syndrome (DS) results in the loss of approximately 30 gene copies and is associated with possible physical anomalies, varied learning disabilities, and a specific cluster of neurocognitive deficits, including primary impairment in working memory, executive visual attention, and sensorimotor processing. Retrospective studies have suggested that children with 22q11DS are at 25 times greater risk of developing schizophrenia, thus specification of early brain network vulnerabilities among children with 22q11DS is critical. Previously, we reported that children with 22q11DS as compared with sibling controls had selective deficits in visual executive attention, and subsequently found lowered prepulse inhibition (PPI) in these same children. Visual executive attention and PPI recruit the same brain pathways linking prefrontal cortex to basal ganglia structures. To test the specificity of brain pathway vulnerability among children with 22q11DS, we examined visual executive attention and PPI paradigm data collected during the same test session from 21 children with 22q11DS and 25 sibling controls. We predicted lower %PPI and less efficient executive attention scores, and a significant inverse correlation between measures. %PPI in children with 22q11DS as compared with sibling controls was 20% lower, and visual executive attention efficiency scores 40% worse. As predicted, %PPI was inversely correlated only with executive attention efficiency scores. The implications of these findings with regard to brain pathway vulnerability in children with 22q11DS are considered. These results suggest that children with 22q11DS have early functional abnormality in pathways linking the prefrontal cortex and basal ganglia.
Keywords: prefrontal cortex, basal ganglia, attention, schizophrenia, gene deletion, child development disorders
The 22q11 Deletion Syndrome (22q11DS) results from a meiotic deletion of genetic material at the q11.2 site on chromosome 22, occurring in one of every 6000 births,1 and in over 90% of cases is de novo.2 Congenital anomalies occur in some but not all children and might include heart defects, immunologic deficits, craniofacial dysmorphologies, velopharyngeal defects such as overt or submucous cleft palate, or inflammation-related pain syndromes of widely varying severity.3 Prior to the identification of a single underlying deletion, different clinical labels were used to describe a child’s primary physical anomaly. These included Conotruncal Anomaly Face Syndrome (heart defect with facial dysmorphologies), Velo-Cardio-Facial-Syndrome (VCFS, velopharyngeal, heart, and facial anomalies), and DiGeorge Syndrome (immunologic insufficiency). Interest in the 22q11DS is rapidly increasing because adult retrospective studies have suggested that 25% of children with 22q11DS go on to develop schizophrenia in late adolescence or early adulthood.4,5 These findings dramatically increase the significance of fully characterizing their neurocognitive status during pre-symptomatic childhood years, both for the purposes of targeted intervention, and also for understanding the associations between genetic factors, early brain function, and later psychiatric outcome.
Interestingly, the neurocognitive profile of children with 22q11DS appears far more consistent than their physical phenotype. Neuropsychological test results suggested that the primary deficits among children with 22q11DS were likely to include attention, executive function,6-8 and motor behavior,7 three functional domains that are linked in the brain. Performance of children with 22q11DS on tasks that tapped more specific brain pathways within these relatively broad functional regions have helped to substantiate these initial findings.
Prepulse inhibition (PPI) paradigms provide a means to quantify prefrontal influences on subcortical and brainstem processing. If a startle-eliciting stimulus is preceded by a relatively low-intensity short-lead stimulus, the amplitude of the startle eye blink is inhibited and the latency is reduced.9 The acoustic startle circuit in humans serially links the auditory nerve, ventral cochlear nucleus (VCN), nucleus reticularis pontis caudalis (NRPC), and spinal motor neuron,10 and it has been suggested that the prepulse stimulus activates the VCN and NRPC. One or both of these activate the pendunculopontine nucleus in the pontine tegmentum, and pendunculopontine nucleus innervation inhibits further NRPC response.11 The result is reduced startle. Importantly however, this relatively simple primary startle/inhibition circuit is actively modulated by ‘top-down’ influences, including a cascade of projections from forebrain limbic cortex into the striatum, striatal projections into pallidum, and pallidal inputs into the pontine tegmentum.12
The development of PPI in infants and children appears to parallel the developmental stages of brain inhibitory mechanisms.13 PPI in children has been shown to approach adult levels (50–75%) by approximately age 8, and by this time gender differences observed in adults are also apparent, with PPI values in males 25–30% higher than those in females.14,15 Lowered PPI has been shown in children with disorders characterized by a failure of brain inhibitory mechanisms including Tourette’s syndrome,16 post-traumatic stress disorder,17 fragile X syndrome,18 and among males with nocturnal enuresis and co-morbid ADHD.19 Lowered PPI has also been found in adults whose psychiatric syndromes are characterized by poor selective-inhibitory control of attention, including obsessive compulsive disorder,20,21 panic disorder,22 social phobia,23 Asperger’s syndrome,24 Huntington’s disease,25 bipolar mania,26 and schizophrenia.27 Thus lowered PPI appears to occur among individuals who are subject to unfiltered and irrelevant sensory, cognitive and/or motor perceptions.19,28 Recently, as compared with 23 sibling controls, PPI among 25 children with 22q11DS was 20% less; secondary analyses suggested that this decrement did not reflect developmental delay.29
The Attention Network Test (ANT) assesses the efficiency of three relatively segregated brain networks responsible for fundamental aspects of visual attention, including Alerting, Orienting, and Executive functions. ANT index scores represent response time differences in cued and uncued conditions and indicate the amount of cue benefit derived. Higher index scores generally indicate less efficient processing in uncued conditions. Neuroanatomical models of the three segregated network pathways that underlie Alerting, Orienting, and Executive responses have been substantiated by decades of animal and human research.30-34 Much more so than Alerting and Orienting, Executive attention depends on pathways leading from limbic anterior cingulate cortex to subcortical structures. A comparison of the ANT index scores from 32 children with the 22q11DS and 20 control siblings aged 5.0–11.5 showed that children with 22q11DS had less efficient scores on only a measure of Executive attention, and no differences on Orienting or Alerting.8 The finding was supported by significantly greater errors and more missed trials on only the incongruent (Executive) flanker trial condition, and a significant correlation between Executive Network scores and accuracy, among only the children with 22q11DS.
These results provided initial evidence of possible specific brain pathway vulnerabilities in children with 22q11DS. When considered separately, however, PPI or ANT performance scores might be directly or indirectly attributable to a wide variety of brain influences. A perhaps stronger evidence of particular pathway dysfunction would be provided by examining the correlations in children’s ANT and PPI performances. In this approach, performances on two behaviorally nonredundant tasks (PPI and ANT Executive Attention) believed to be driven by the same underlying brain pathways are considered. Correlations between measures might suggest whether specific pathways override differences in performance demands, and which qualitatively different task characteristics might be influenced by similar underlying mechanisms. The absence of correlations between measures that are believed to depend on similar pathways might provide the basis for new hypotheses regarding previously unexplored influences, and could challenge our current conceptualization of these tasks. Comparing correlations between groups with and without a specific neuro-cognitive syndrome might provide clues regarding whether or how particular brain systems respond to an identified ‘stressor.’
We examined the relationship between PPI and ANT index scores collected during the same testing session among children with 22q11DS and sibling controls. We hypothesized that children with 22q11DS would have significantly lower PPI and significantly higher Executive index means as compared with sibling controls. We further hypothesized that PPI and Executive index scores would be inversely correlated.
Materials and methods
Participants
We present data from 46 children ranging in age from 6. 0 to 15.1, who successfully completed both PPI and ANT paradigms during the same testing session. The sample included 21 children with the 22q11DS, whose deletions were confirmed prior to study enrollment via florescence in situ hybridization, and 25 sibling controls who were without history of learning disability, neuropsychological impairment, neurologic or psychiatric disorder.
The 46 children included in the final sample were culled from a total of 57 children who had completed both paradigms during the same test session. None of the control siblings (n = 25) were found to be nonresponders on the PPI paradigm; however, three children with the 22q11DS (two females, one male) were PPI paradigm nonresponders (no blink detected for >33% pulse trials) and two children with 22q11DS (one male, one female) interrupted the procedure before completion. Of the remaining 52 children, six with 22q11DS had ANT accuracy below 75% on one or more of the 12 paradigm conditions (four females, two males, ages 6.1–8.3), invalidating one or more of their efficiency index scores (see Data Evaluation below). None of their data were included. Accuracy for all of the normal controls was acceptable (≥75% on all 12 ANT conditions).
All control siblings (25/25) and 16/21 (76%) of children with 22q11DS were without history of chronic otitis, other transient ear infection, fluid in the ears, ear tubes or any ear-related difficulties, and had tested normal on all hearing tests previously administered. The five children with 22q11DS included in this sample who had a history of otitis had no occurrence of infection, fluid in the ears, ear-related problems or tubal ligation after age 5, and were determined to be of normal hearing ability for 3 or more consecutive years prior to this testing (i.e., children included in this sample under 8 years of age had no history of otitis).
To determine children’s diagnostic status at the time of testing, parents completed the Child Symptom Inventory (CSI-4), a diagnostic screening instrument with demonstrated reliability, discriminant validity, and 4-year temporal stability for identifying children with behaviors that may be associated with DSM-IV diagnoses.35 Parents of children found positive on this screen were then administered the NIMH Diagnostic Interview of Children, Version IV36 to ascertain whether full diagnostic criteria for DSM-IV diagnoses were met. No control siblings and three of 21 22q11DS children met the criteria for DSM-IV disorders, including Attention Deficit Hyperactivity Disorder2 and Generalized Anxiety Disorder1 (Table 1). All children included in this sample were medication-free at the time of testing. Only one female in this sample was pubertal at the time of testing.
Table 1.
Social and clinical demographics of children with 22q11DS (n = 21)
| Parent education (SES)a | |
| 12–16 years | 76% (32/42)b |
| > 16 years | 24% (10/42) |
| Caucasian families | 95% (20/21) |
| 22q11DS FISHc positive | 100% (21) |
| Mean age of detection (SD) | 3.0 years (±2.4) |
| Current DSM-IV diagnosis | 14% (3/21) |
| ADHD | (2) |
| GAD | (1) |
Hollingingshead Index of Social Position.59
Denominator indicates 2 parents per child.
Fluorescence in situ hybridization assay.
Apparatus and stimuli
San Diego Instruments Startle Reflex system (SDI, Serial N, Model N) was used for PPI data acquisition. Eyeblink data were collected using the photoelectric cell (PEC) method in which a light-emitting diode is positioned at the level of the subject’s eyelid. Lid closure reflects an LED ray back to an adjacent photocell pickup. As millivolt output increases with movement initiation and decreases with blink completion, a waveform is produced. The comparability of this method to the electromyographic (EMG) method was previously demonstrated and discussed.29,37 Auditory stimuli for the PPI paradigm were presented binaurally through Sony MDR-V6 headphones nested over the LED headband. A back-ground white noise of 50 db (A scale) was present before, in between, and after all trial stimuli presentations. Eye blink was elicited with a 50 ms white noise sound burst at 104 dB. Lead interval was fixed at 100 ms38 for all prepulse trials, with a 70 dB39 white noise pre-stimulus of 40 ms duration, followed 60 ms later by a 104 dB white noise pulse of 50 ms duration. The software was programmed to deliver one session of 12 min duration beginning with a 60-s white-noise-only acclimation period, followed by 36 individual stimulus trials, 18 pulse, and 18 prepulse trials. Trial type and inter-trial intervals ranging from 12 to 22 s were randomly distributed in a split-half design to ensure equal representation in each half.
The child ANT paradigm40 was created with the E-Prime commercial application program and was loaded onto an IBM compatible laptop computer running Windows 95. Responses were made on a symmetrical 5 V Microsoft Basic Mouse 3.0 PS/2. The stimuli were bright yellow fish with black arrow-like gills pointing in the direction that the fish was facing and shown against a blue background. Single fish were placed at a visual angle of 0.55° and the contours of adjacent fish were separated by a visual angle of 0.06°. Central fish plus four flanker fish consisted of a total of 3.08° visual angles. The stimuli were presented either 1.06° above, 1.06° below, or at the point of central fixation. One session of the ANT consisted of 24 practice trials and 144 test trials, and required approximately 20 min to complete. Test trials were divided into three blocks, each consisting of 48 randomly distributed trials, four each of 12 possible conditions (three cue conditions × four flanker conditions). One trial of the ANT consisted of the presentation of five consecutive screens within approximately 4 s: screen 1, central cross (400 ms); screen 2, cue or no cue condition (100 ms); screen 3, central fixation cross (400 ms); screen 4, target (required RT <1700 ms); screen 5, central fixation cross (3500 ms minus response time of screen 4). Children were allowed 1.7 s to respond, after which the nonresponse was recorded as a missing trial. A correct response resulted in auditory (‘woohoo!’) and visual feedback (bubbles coming from fish’s mouth) lasting approximately 3 s. The child ANT has been shown to reliably discriminate alerting, orienting, and executive visual attention in school-age children.41
Procedure
All PPI and ANT sessions were completed before 1300 h to control for circadian effects. Parents and children in the study were first informed of study tests and procedures 1 month prior to testing via mailed consent forms. Just prior to the start of testing, procedures and apparatus were described and consent obtained. For children, this occurred with the parents present during the informed consent/child assent procedure. For PPI, children were seated in a cushioned armchair approximately 4′ from a 20′′ television monitor and told they would be watching silent cartoons throughout the procedure. PEC recording required fitting a padded headband, onto which was affixed (via 1 cm wire) a 10 cm rectangular LED/photoelectric cell. The apparatus was handed to the participant to examine, modeled by the experimenter, and then fitted on the participant. The (10 cm) LED was positioned parallel to the upper right eyelid at a distance of approximately and approximately 20° off the eye center. The headband apparatus required approximately 30 s to fit and adjust. Positioning of the PEC at the level of the eyelid required an additional 1–2 min, during which voluntary and involuntary eyeblinks were monitored on the system’s internal oscilloscope. The presentation of cartoons during PPI has been shown to reduce movement and engage children’s interest.14,15 The experimenter sat behind the participant positioned to monitor both the participant and the apparatus throughout the session.
For the ANT paradigm, participants were seated approximately 60 cm from the display screen and were instructed to indicate the direction of the central fish by pressing either the left or the right mouse button. The experimenter demonstrated how to hold the mouse and children were instructed to leave their hands in the same position for the duration of each block. The experimenter sat with each child through the practice trials to ensure that the child understood the instructions. After the practice trials, the experimenter sat out of the child’s peripheral vision. Deviations in hand position were corrected as needed during the test sessions.
Data analysis
All databases were created, maintained, and analyzed with Statview/PC Version 5 and SAS Version 6.0. PPI variables from pulse (P) and prepulse (PP) trials used in preliminary data evaluation included amplitude in millivolts at trial start (StartP, StartPP); maximum amplitude of the peak in millivolts (MaxP, MaxPP), and time of the peak in milliseconds (TimeP, TimePP). PPI variables used in the primary analyses included percent amplitude decrement calculated with (100−((MaxPP/MaxP) × 100) = %PPI), and percent latency reduction calculated with (100−((TimePP/TimeP) × 100) = %LTR).
The internal validity of the ANT paradigm for this population was previously reported.8 ANT variables used for the main analyses included Alerting index score (ALERT), Orienting index score (ORIENT), Executive index score (EXECUTIVE), mean accuracy (Accuracy), and mean response time (RT). In addition, mean accuracy scores associated with each index were calculated for use as control variables in ANOVA tests of differences between groups. The mean of median response times was used for network calculations: (Alerting Network score = no-cue RT−double cue RT); (Orienting Network score = center cue RT−correct location cue RT); (Executive Network score = incongruent RT−congru-congruent RT).
F-tests for equality of variances42 were used to compare variable distribution properties for each group. Unpaired t-tests were used to assess PPI performance comparability between children with 22q11DS and sibling controls. ANOVA models were used to examine group and gender differences for PPI and mean time of peak for prepulse trials, and to examine group differences on ANT index scores, with accuracy co-varied. Regression analysis was used to examine the strength of correlations among variables.
Data evaluation
Data evaluation was identical to procedures previously reported.8,29. All trials for all PPI sessions were individually examined. First trials were ‘pulse only’ and were eliminated to control for ‘first-time’ effects. Trials with elevated (>500) or rising millivolt levels within 0–20 ms following stimulus presentation indicated spontaneous eye activity unrelated to startle stimuli, and were excluded as ‘noise’ trials. With noise trials excluded, all sessions were reviewed to determine responder status. ‘Nonresponder’ was defined as one with fewer than 33% blink responses to pulse trials (6/18) and these sessions were excluded from further analysis. Paired t-tests were used to examine the comparability of sessions conducted on consecutive mornings. No differences on any of the variables analyzed were found. In a majority of cases, day 2 data included fewer noise trials, and tester’s observational reports of child behavior on day 2 reflected decreases in wariness, and increased comfort level and quietude. Data from day 2 sessions were used (one session per child). None of the control siblings (n = 25) were found to be nonresponders on the PPI paradigm, three children with the 22q11DS (two females, one male) were PPI paradigm nonresponders (no blink detected for >33% (six) pulse trials), and two children with 22q11DS (one male, one female) interrupted the procedure before completion.
Preliminary to the main analyses, PPI performance comparability was examined between groups for ‘noise’ (excluded) and ‘no peak’ trials, and for trial performance variables. Pulse (P) and prepulse (PP) noise trial counts did not differ between groups (22q11DS and sibling P noise trial means (SDs) = 4.38 (2.85) and 3.00 (1.98), respectively, t(44) = 1.93; 22q11DS and sibling PP noise trial means (SDs) = 3.00 (2.61) and 3.28 (2.81), respectively, t(44) = 0.35). Number of P trials that did not elicit a blink response did not differ significantly between groups (22q11DS and sibling no-response pulse trial means (SDs) = 1.86 (1.96) and 1.12 (1.72), respectively, t(44) = 1.36). StartP and StartPP, MaxP, and TimeP were also compared between groups. No group differences were found for millivolt level at the start of pulse and prepulse trials, peak millivolt level for pulse trials, or time of the peak on pulse trials (22q11DS and sibling StartP means (SDs) = 185.57 (77.41) and 202.47 (78.34), respectively, t(44) = 0.73); (22q11DS and sibling StartPP mean = 187.38 (57.00) and 186.99 (73.80), respectively, t(44) = 0.02); (22q11DS and sibling MaxP means (SDs) 2902.86 (1344.20) and 3302.62 (1432.98), respectively, t(44) = 0.97); (22q11DS and sibling TimeP means (SDs) = 102.25 (9.73) and 99.88 (6.07), respectively, t(44) = 1.0). F-tests of variance ratios between groups were calculated for each of these primary variables. Only variance of TimeP differed significantly between groups (var ratio (24/20) = 0.39, P = 0.03). Log(base10) transformation of TimeP resolved the difference and the log-transformed variable was used in all subsequent analyses. Only for the purposes of calculating %LTR, TimePP was also log transformed. Descriptive statistics and variance comparisons for %PPI and %LTR are given in Table 2. Variance between groups did not differ for either change measure.
Table 2.
Means, standard deviations, and variance ratio F-test
| Mean (SD) | Var ratio/Fnum/den df | P | |
|---|---|---|---|
| %PPI | |||
| 22qa | 22.97 (29.66) | 0.7424/20 | 0.48 |
| Sibsb | 42.75 (25.48) | ||
| %LTRc | |||
| 22q | −0.51 (3.36) | 0.5424/20 | 0.16 |
| Sibs | 0.80 (2.47) | ||
| Alerting | |||
| 22q | 79.23 (38.22) | 1.123/19 | 0.82 |
| Sibs | 62.04 (40.20) | ||
| Orienting | |||
| 22q | 52.70 (34.13) | 1.5 19/17 | 0.40 |
| Sibs | 69.04 (41.74) | ||
| Executive | |||
| 22q | 107.84 (98.20) | 0.1724/19 | <0.001 |
| Sibs | 66.63 (40.38) | ||
| Accuracy | |||
| 22q | 0.95 (0.043) | 0.7624/20 | 0.53 |
| Sibs | 0.97 (0.038) | ||
| RT | |||
| 22q | 689.16 (152.58) | 0.9924/20 | 0.98 |
| Sibs | 677.75 (151.91) |
n = 21.
n = 25.
% Latency reduction calculated with logged values.
All ANT sessions were reviewed for completeness and accuracy. Sessions in which responses were detected for fewer than 75% of trials in any of the 12 ANT conditions, or in which accuracy was less than 75% for any of the 12 ANT conditions, were excluded from analysis. Excluding children on the basis of accuracy also excluded all children with unacceptably high number of missing trial responses (ie, no child with a high missing rate performed with acceptable accuracy). Of the 52 children who were PPI responders, six with 22q11DS (four females, two males, ages 6.1–8.3) had ANT accuracy below 75% on one or more of the 12 paradigm conditions, invalidating one or more of their efficiency index scores. None of their data were included. Accuracy for all of the normal controls was acceptable (≥75% on all 12 ANT conditions).
Review of the ANT data revealed several negative value index scores, which indicated that, for a few children, the cue that was supposed to benefit them actually slowed their performance. These were considered to be noninformative measures of ‘benefit’ and negative value index scores were set to missing for the following cases: ALERT, one female sibling control, age 6.3 and one male child with 22q11DS, age 7.2; ORIENT, one male sibling control, age 8.9, four female sibling controls, ages 6.0–11.4, two male children with 22q11DS, ages 12.8 and 15.1, one female child with 22q11DS, age 8.1; EXECUTIVE, one male child with 22q11DS, age 13.6. With negative values converted to ‘missing,’ index scores represented the amount of RT improvement conferred by an informative visual cue as compared with a less informative cue condition (ie, double cue vs no cue; spatial cue vs center cue; congruent vs incongruent condition).
Variance differences between groups were examined for all ANT variables (Table 2). Variance differed significantly between groups for only EXECUTIVE, and was resolved with a log(base10) transformation (var ratio (19/24) = 1.04, P = 0.93). In all subsequent analyses, logged values for EXECUTIVE were used.
Results
A total of 46 children were included in these analyses, 21 with the 22q11DS (10 males, mean age 10. 55±2.8 and 11 females, mean age 10.34±2.4) and 25 sibling controls (11 males, mean age 10.29±1.7 and 14 females, mean age 8.9±2.2). Group mean age did not differ (mean difference = 0.92, t46 = 1.34, P = 0.20). Table 1 shows social and clinical demographic characteristics of the 22qq11DS children. Each child contributed one PPI session of acceptable response level and one ANT session of acceptable accuracy. Variables used in comparative analyses included %PPI, %LTR, ALERT, ORIENT, EXECUTIVE, Accuracy and RT (Table 2).
Primary analyses
We first examined startle magnitude (MaxP) and latency (TimeP) for pulse trials alone by group and gender. ANOVA results suggested no main effects and no interactions (22q11DS and control sibling MaxP means (SDs) = 2902.86 (1344.20) and 3302.62 (1432.90); 22q11DS and control sibling TimeP means (SDs) = 102.25 (9.73) and 99.88 (6.07)). We then compared affected children and unaffected siblings on %PPI and %LTR, controlling for gender. %PPI for children with 22q11DS was significantly less than that of sibling controls (22q11DS and control sibling %PPI means = 22.97 and 42.75%, respectively, mean diff = 19.78%, F1,42 = 6.52, P = 0.014). No effect of gender was apparent. The difference among males was notably larger, however, with %PPI mean for male sibling controls within the range of adult levels (50.60%) and %PPI for 22q11DS males markedly less (18.60%). %PPI means for sibling control and females with 22q11DS differed less (36.58 and 26.93%, respectively) (Figure 1).
Figure 1.
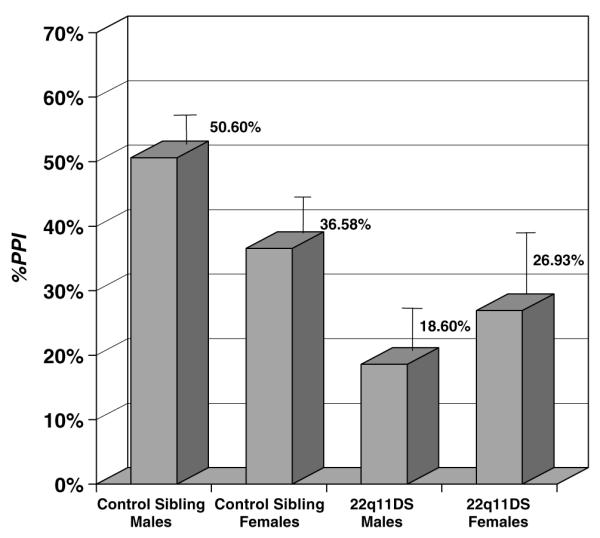
Comparison of %PPI in children with 22q11DS and sibling controls. Error bars = standard error of the mean.
ANOVAS were also used to compare groups on ANT index scores. Mean accuracy values for the flanker and cue condition trials used in each index score were calculated and included as a covariate in each model. ANOVA comparisons for ALERT and ORIENT suggested no significant differences between groups, and no accuracy effects (22q11DS and control sibling ALERT means (SDs) = 79.25 (38.22) and 62.04 (40.20); 22q11DS and control sibling ORIENT means (SDs) = 52.70 (34.13) and 69.04 (41.74)). For children with 22q11DS, however, EXECUTIVE was significantly higher than that of control siblings (log values for 22q11 and sibling control means = 1.87 (0.40) and 1.70 (0.41), mean diff = 0.17, F1,41 = 11.6, P = 0.002). This model also revealed a significant interaction effect for group × accuracy (F1,41 = 11.1, P = 0.002).
From our 46 participants, we attempted to predict EXECUTIVE from %PPI using simple linear regression analysis. An inverse correlation was hypothesized. The slope of the regression line was significantly less than zero, indicating that EXECUTIVE tended to increase as %PPI decreased to (slope = −0.005; 95% CI = −0.009 to −0.001; t44 = −2.36; P = 0.023; Y = 1.938–0.005X ; r = −0.338) (note: small equation values result from logged scores and are not related to effect size). Pearson’s product—moment correlations were examined for each group and compared for differences. The difference in correlations between groups was not statistically significant; however, the correlation was notably larger among children with the deletion (22q11DS r = −0.418; sibling controls r = −0.178).
Secondary analyses
In order to inform the primary results, and perhaps generate additional hypotheses, we examined additional differences and correlations in secondary analyses. Outcomes for these were not hypothesized. Owing to its implications for interpreting the %PPI difference between groups, %LTR was examined. Latency reduction did not differ significantly by diagnostic group; however, an effect of gender was found, with females showing significantly less latency reduction than males (females and males %LTR log-derived means (SDs) = −0.784 (1.62) and 1.38 (3.71), mean log diff = 2.16, F1,42 = 7.53, P = 0.009). To explore the possible association between %LTR and %PPI among girls, a simple regression was used. No association was found (r = 0.074, t22 = 0.36).
For comparative purposes, we also considered the correlations between %PPI and %LTR, and the remaining ANT variables (Table 3). As the table suggests, %PPI does not appear to be associated with any of the other ANT index measures. The association between %LTR and Executive among only 22q11DS children did not reach statistical significance (P = 0.054), but may be important to explore in future studies with larger sample sizes. The association between %LTR and RT may provide an important clue regarding the inhibitory mechanisms in children with 22q11DS (discussed below).
Table 3.
Exploratory correlations for PPI and LTR with attention network paradigm variables
| %LTR | Alert | Orient | Accuracy | RT | |
|---|---|---|---|---|---|
| %PPIa | 0.216 | −0.191 | −0.111 | 0.238 | −0.286 |
| 22qb | −0.003 | −0.130 | −0.219 | 0.157 | −0.276 |
| Sibsc | 0.358 | −0.116 | −0.169 | 0.247 | −0.307 |
| Alert | Orient | Executived | Accuracy | RT | |
|---|---|---|---|---|---|
| %LTRa,d | 0.020 | 0.019 | 0.218 | −0.019 | 0.087 |
| 22qb | 0.195 | 0.234 | 0.376 | −0.369 | 0.455* |
| Sibsc | −0.034 | −0.220 | 0.172 | 0.349 | −0.306 |
P<0.05.
n = 46.
n = 21.
n = 25.
log (base10) values used.
Discussion
In previous analyses, we suggested that neurocognitive impairment in children with 22q11DS might be attributable to the combined neurochemical effect of at least two of the missing genes in the deleted region.29 The PRODH gene encodes proline dehydrogenase, which is key in the production of glutamate; glutamate in turn directly influences GABA production and release. The COMT gene encodes catechol-O-methyltransferase, which catabolizes excess brain dopamine. Thus, lowered ‘dose’ of both genes may contribute to chronic neurochemical imbalance in brain pathways primarily dependent on glutamate, GABA, and dopamine. Startle inhibition following a prepulse (PPI) is initiated in the pontine tegmentum, and is then modulated by a top-down cascade of neurochemical events in glutamatergic, GABAergic, and dopaminergic pathways projecting from anterior cingulate, within and between the caudate nucleus, ventral pallidum, ventral tegmentum, and substantia nigra.28 With regard to the ANT Executive attention index, past studies have repeatedly shown heightened activation in the anterior cingulate region of the limbic cortex during the presentation of conflicting stimuli43 and during tasks with conflicting cues (Stroop task).44-46 Anterior cingulate cortex is also dependent on innervation from limbic loop pathways linking prefrontal and subcortical regions, and primarily dependent on glutamate, GABA, and dopamine.47 Thus %PPI and Executive attention index scores are both measures of behavioral change conferred by activation of limbic loop pathways primarily dependent on glutamate, GABA, and dopamine. If %PPI and ANT Executive attention index scores are subserved by the same basal ganglia loop pathway dependent on glutamate/GABA/DA, performance scores from these paradigms obtained within a single test session should differ significantly from sibling controls, and also should be correlated.
We examined simultaneously collected PPI and ANT paradigm data from 46 children, including 21 with 22q11DS and 25 sibling controls. %PPI was lower and Executive attention index scores higher (less efficient) among children with 22q11DS as compared with sibling controls. This confirmed previous findings based on performance scores from different test sessions. In addition, an inverse correlation between %PPI and Executive attention index scores was found, and suggested that as %PPI decreased Executive attention index scores increased. Although not significantly different from sibling controls, the inverse correlation between measures was notably greater among 22q11DS children. Perhaps lower sensorimotor gating and less efficient executive visual attention among children with 22q11DS stems from a common source, for example, disruption of inhibitory mechanisms influencing both behavioral domains tested. In this case, the lack of correlation among sibling controls might indicate that when inhibitory mechanisms are developing normally, performance on these behavioral tests is free to vary, and perhaps primarily influenced by individual differences in pathway function. Of course this is speculative, and requires exploration in studies specifically designed to examine issues such as these.
While structures and associated pathways in the other two ANT attention networks overlap those of the primary startle circuit, the brain phenomena reflected in associated ANT index scores are not primarily modulated by limbic loop pathways, and this might partly explain their lack of association with %PPI. Perhaps most importantly, the Alerting and Orienting networks differ substantially from those believed to underlie startle modulation in response to a prepulse with regard to their chemoarchitecture. The locus coeruleus (LC) nuclei, located in the tegmentum region of the midbrain above the pons, fundamentally influence the Alerting network, and are the brain’s most substantial noradrenergic center. Neurons in these nuclei project widely, forward to the thalamus, hippocampus, and cortex, including the anterior cingulate; laterally to other areas in the midbrain and the cerebellum; and downward to the pons, medulla, and spinal cord. In most of these areas, axons from the LC mix with noradrenergic fibers originating elsewhere in the brain. However, noradrenergic innervation of the neocortex originates exclusively from the LC.47 While the Alerting network includes nuclei that participate in the primary startle/startle inhibition circuit, the ANT Alerting index quantifies the benefit of a simple vs no cue condition, without the demand for resolution of conflicting visual stimuli, and thus a minimum of limbic loop influence. The Orienting network has been consistently associated with activity in posterior parietal lobe;48-50 lateral pulvinar nucleus in the posterior thalamus;50,51 and superior colliculus.50,52,53 The superior colliculi are innervated primarily by a bundle of cholinergic (acetylcholine) neurons that originate in the brainstem and form an ascending fiber system.54 Additional noradrenergic neurons that originate in the locus coeruleus also project to the superior colliculus. The orienting network is dominated by the cholinergic system with GABA regulating only local activation in both the thalamus and superior colliculi.47
In secondary analyses, %PPI and %LTR were not correlated. The exploratory analyses revealed a significant secondary correlation between %LTR and overall response time on the ANT. In adult samples, startle inhibition in response to a prepulse is accompanied by latency reduction. That is, on prepulse trials, eyeblink peak is earlier as well as lower, and %LTR is believed to reflect primary sensory processing of auditory stimuli. Children with 22q11DS have a high incidence of hearing related difficulties and, for this reason, children in this study were carefully screened. Nonetheless, a correlation between %PPI and %LTR might suggest that lower %PPI in children with 22q11DS simply reflected a primary sensory deficit that blocked the perception of, and thus response to, prepulse stimuli. In this sample, children with 22q11DS did not differ from sibling controls with regard to %LTR, suggesting that lowered %PPI in this sample of children with 22q11DS was not likely to be attributable to a primary sensory deficit.
Interestingly however, our females had significantly less %LTR than males. An additional correlation was run to examine whether %PPI and %LTR might be correlated in only females. No correlation was found. While %PPI occurs very reliably among adults at short-lead interval durations ranging from 30 to 500 ms,38 latency effects in response to a prepulse are far more sensitive to short-lead interval durations (ie 120 vs 250 ms). This is especially true in children.14,15 (The paradigm used in this study included a 100 ms short-lead interval duration.) In fact, the neural pathways that influence latency have proven to be somewhat elusive and the brain mechanisms that participate in the response latency effect have been investigated far less frequently than those associated with startle modulation. If girls (or children with 22q11DS) had a primary sensory disturbance, we might have expected to see significant group effects on MaxP, but there were none. Also, there were no differences between groups or genders on the number of prepulse trials responded to, and no significant correlation between %PPI and %LTR (just to be sure, we ran an additional regression using %PPI and %LTR in only girls, and it was near zero). We propose that a lack of latency reduction in girls of this age may indicate a true gender difference in the development of the latency reduction effect of prepulse stimuli on startle responses. This requires further examination in a study specifically designed to explore short-lead interval effects on %LTR in girls and boys of this age range.
We note one other finding from the secondary analyses. Among children with 22q11DS, the slower the RT on the ANT, the greater the latency reduction effect. That is, among children with 22q11DS, greater latency reduction occurred in children who were better able to slow thumb-press responding, while children who pressed faster had less latency reduction. This correlation requires re-examination in a study that hypothesizes this outcome. Whether this correlation—in the absence of an association between %PPI and %LTR in children with 22q11DS—reflects a common deviant inhibitory mechanism influencing ‘executive’ responses to both visual and auditory stimuli warrants further exploration.
Limitations
When using the ANT among children with attentional differences, despite the simplicity of the task, we found that neither accuracy nor index validity could be assumed. Since accuracy approaching chance levels invalidates performance index scores, accuracy rates had to be examined for each child and some children’s scores were dropped due to poor accuracy. This reduced the overall sample size. Moreover, absolute index score values had to be preliminarily evaluated. Index scores were originally devised to measure cueing benefit. Thus, a negative value index score indicated that a ‘beneficial’ cue actually slowed performance, suggesting that, for a particular child, the task was not a valid measure of benefit. Especially for Orienting, several children’s scores were negative and for this reason, set to ‘missing.’ The occurrence of negative orienting scores among these children needs to be examined more closely. Additionally, children with the 22q11DS have deficits in inhibitory control. Even among children with acceptable (eg, ≥75%) accuracy, response times could be faster simply because of lower inhibitory control, as reflected in lower accuracy. Accuracy had to be included in the statistical model or true group differences would have been obscured.
With regard to the PPI paradigm, children were not hearing tested immediately prior to the procedure. This remains a potential confound despite the application of strict historical criteria. It was necessary to use the photoelectric cell method for recording eyeblink rather than EMG29 in these children. While comparability estimates between these measures for %PPI are high, they do not record the same motor phenomena. It would be valuable to repeat these analyses using data from unaffected children who tolerate the EMG method and who also complete the ANT paradigm. Mean ages of groups did not differ; however, the age range of this sample was broad. Lower standard deviations and larger effect sizes might be expected among groups of children with a smaller range of ages. This sample is predominantly Caucasian and the relevance of these findings to other ethnic or racial populations should not be assumed.
Acknowledgements
We thank the children in this study for their hard work, ongoing participation, and invaluable feedback regarding our procedures, and of course, their parents, for their generous commitment to our work. Samantha Monk continues to provide excellent and invaluable assistance with data tracking, data entry, and study administration. We would also like to thank Maude Blundell, MS, for her important contribution to the early recruitment phase of the study, and Kawame Anyane-Yeboa, MD, for his participant referrals. This research was supported by a grant from the Child Health and Human Development Branch of the National Institutes of Health (K08-HD040321, to CS) and also by a General Clinical Research Center grant (M01-RR00102) from the National Center for Research Resources, National Institutes of Health.
References
- 1.Botto LD, May K, Fernhoff PM, Correa A, Coleman K, Rasmussen SA, et al. A population-based study of the 22q11.2 deletion: phenotype, incidence, and contribution to major birth defects in the population. Pediatrics. 2003;112(Part 1):101–107. doi: 10.1542/peds.112.1.101. [DOI] [PubMed] [Google Scholar]
- 2.Morrow B, Goldberg R, Carlson C, Gupta R Das, Sirotkin H, Collins J, et al. Molecular definition of the 22q11 deletions in velo-cardio-facial syndrome. Am J Hum Genet. 1995;56:1391–1403. [PMC free article] [PubMed] [Google Scholar]
- 3.Ryan AK, Goodship JA, Wilson DI, Philip N, Levy A, Seidel H, et al. Spectrum of clinical features associated with interstitial chromosome 22q11 deletions: a European collaborative study. J Med Genet. 1997;34:798–804. doi: 10.1136/jmg.34.10.798. (see comment) [DOI] [PMC free article] [PubMed] [Google Scholar]
- 4.Pulver AE, Nestadt G, Goldberg R, Shprintzen RJ, Lamacz M, Wolyniec PS, et al. Psychotic illness in patients diagnosed with velo-cardio-facial syndrome and their relatives. J Nerv Ment Dis. 1994;182:476–478. doi: 10.1097/00005053-199408000-00010. [DOI] [PubMed] [Google Scholar]
- 5.Murphy KC, Jones LA, Owen MJ. High rates of schizophrenia in adults with velo-cardio-facial syndrome. Arch Gen Psychiatry. 1999;56:940–945. doi: 10.1001/archpsyc.56.10.940. [DOI] [PubMed] [Google Scholar]
- 6.Woodin M, Wang PP, Aleman D, McDonald-McGinn D, Zackai E, Moss E. Neuropsychological profile of children and adolescents with the 22q11.2 microdeletion. Genet Med. 2001;3:34–39. doi: 10.1097/00125817-200101000-00008. [DOI] [PubMed] [Google Scholar]
- 7.Sobin C, Kiley-Brabeck K, Khuri J, Taylor L, Karayiorgou M. Neuropsychological characteristics of children with the 22q11 deletion syndrome: a descriptive analysis. Child Neuropsychol. doi: 10.1080/09297040590911167. in press. [DOI] [PMC free article] [PubMed] [Google Scholar]
- 8.Sobin C, Kiley-Brabeck K, Daniels S, Blundell M, Anyane-Yeboa K, Karayiorgou M. Networks of attention in children with the 22q11 deletion syndrome. Dev Neuropsychol. 2004;26:611–626. doi: 10.1207/s15326942dn2602_5. [DOI] [PMC free article] [PubMed] [Google Scholar]
- 9.Graham FK. Presidential Address, 1974. The more or less startling effects of weak prestimulation. Psychophysiology. 1975;12:238–248. doi: 10.1111/j.1469-8986.1975.tb01284.x. [DOI] [PubMed] [Google Scholar]
- 10.Koch M, Kungel M, Herbert H. Cholinergic neurons in the pedunculopontine tegmental nucleus are involved in the mediation of prepulse inhibition of the acoustic startle response in the rat. Exp Brain Res. 1993;97:71–82. doi: 10.1007/BF00228818. [DOI] [PubMed] [Google Scholar]
- 11.Koch M, Lingenhohl K, Pilz PK. Loss of the acoustic startle response following neurotoxic lesions of the caudal pontine reticular formation: possible role of giant neurons. Neuroscience. 1992;49:617–625. doi: 10.1016/0306-4522(92)90231-p. [DOI] [PubMed] [Google Scholar]
- 12.Swerdlow NR, Geyer MA. Neurophysiology and neuropharmacology of short lead interval startle modification. In: Dawson ME, Schell AM, Bohmelt AH, editors. Startle Modification. Cambridge University Press; New York: 1999. pp. 114–133. [Google Scholar]
- 13.Ornitz EM. Developmental aspects of neurophysiology. In: Lewis M, editor. Child and Adolescent Psychiatry: A Comprehensive Textbook. 3rd edn Williams and Wilkens; Baltimore: 2002. pp. 87–92. [Google Scholar]
- 14.Ornitz EM, Guthrie D, Sadeghpour M, Sugiyama T. Maturation of prestimulation-induced startle modulation in girls. Psychophysiology. 1991;28:11–20. doi: 10.1111/j.1469-8986.1991.tb03381.x. [DOI] [PubMed] [Google Scholar]
- 15.Ornitz EM, Guthrie D, Kaplan AR, Lane SJ, Norman RJ. Maturation of startle modulation. Psychophysiology. 1986;23:624–634. doi: 10.1111/j.1469-8986.1986.tb00681.x. [DOI] [PubMed] [Google Scholar]
- 16.Castellanos FX, Fine EJ, Kaysen D, Marsh WL, Rapoport JL, Hallett M. Sensorimotor gating in boys with Tourette’s syndrome and ADHD: preliminary results. Biol Psychiatry. 1996;39:33–41. doi: 10.1016/0006-3223(95)00101-8. [DOI] [PubMed] [Google Scholar]
- 17.Ornitz EM, Pynoos RS. Startle modulation in children with posttraumatic stress disorder. Am J Psychiatry. 1989;146:866–870. doi: 10.1176/ajp.146.7.866. (see comment) [DOI] [PubMed] [Google Scholar]
- 18.Frankland P, Wang Y, Rosner B, Shimizu T, Balleine B, Dykens EM, et al. Sensorimotor gating abnormalities in young males with fragile X syndrome and Fmr1-knockout mice. Mol Psychiatry. 2004 doi: 10.1038/sj.mp.4001432. adv pub online. [DOI] [PubMed] [Google Scholar]
- 19.Ornitz EM, Hanna GL, de Traversay J. Prestimulation-induced startle modulation in attention-deficit hyperactivity disorder and nocturnal enuresis. Psychophysiology. 1992;29:437–451. doi: 10.1111/j.1469-8986.1992.tb01717.x. [DOI] [PubMed] [Google Scholar]
- 20.Schall U, Schon A, Zerbin D, Eggers C, Oades RD. Event-related potentials during an auditory discrimination with prepulse inhibition in patients with schizophrenia, obsessive—compulsive disorder and healthy subjects. Int J Neurosci. 1996;84:15–33. doi: 10.3109/00207459608987247. [DOI] [PubMed] [Google Scholar]
- 21.Swerdlow NR, Benbow CH, Zisook S, Geyer MA, Braff DL. A preliminary assessment of sensorimotor gating in patients with obsessive compulsive disorder. Biol Psychiatry. 1993;33:298–301. doi: 10.1016/0006-3223(93)90300-3. [DOI] [PubMed] [Google Scholar]
- 22.Ludewig S, Ludewig K, Geyer MA, Hell D, Vollenweider FX. Prepulse inhibition deficits in patients with panic disorder. Depress Anxiety. 2002;15:55–60. doi: 10.1002/da.10026. [DOI] [PubMed] [Google Scholar]
- 23.Larsen DK, Norton GR, Walker JR, Stein M. Analysis of startle responses in patients with panic disorder and social phobia. Cogn Behav Ther. 2002;31:156–169. [Google Scholar]
- 24.McAlonan GM, Daly E, Kumari V, Critchley HD, van Amelsvoort T, Suckling J, et al. Brain anatomy and sensorimotor gating in Asperger’s syndrome. Brain. 2002;125(Part 7):1594–1606. doi: 10.1093/brain/awf150. [DOI] [PubMed] [Google Scholar]
- 25.Swerdlow NR, Paulsen J, Braff DL, Butters N, Geyer MA, Swenson MR. Impaired prepulse inhibition of acoustic and tactile startle response in patients with Huntington’s disease. J Neurol Neurosurg Psychiatry. 1995;58:192–200. doi: 10.1136/jnnp.58.2.192. [DOI] [PMC free article] [PubMed] [Google Scholar]
- 26.Perry W, Minassian A, Feifel D, Braff DL. Sensorimotor gating deficits in bipolar disorder patients with acute psychotic mania. Biol Psychiatry. 2001;50:418–424. doi: 10.1016/s0006-3223(01)01184-2. [DOI] [PubMed] [Google Scholar]
- 27.Braff DL, Geyer MA, Light GA, Sprock J, Perry W, Cadenhead KS, et al. Impact of prepulse characteristics on the detection of sensorimotor gating deficits in schizophrenia. Schizophr Res. 2001;49:171–178. doi: 10.1016/s0920-9964(00)00139-0. [DOI] [PubMed] [Google Scholar]
- 28.Swerdlow NR, Caine SB, Geyer MA. Regionally selective effects of intracerebral dopamine infusion on sensorimotor gating of the startle reflex in rats. Psychopharmacology (Berl) 1992;108:189–195. doi: 10.1007/BF02245306. [DOI] [PubMed] [Google Scholar]
- 29.Sobin C, Kiley-Brabeck K, Karayiorgou M. Lowered prepulse inhibition in children with the 22q11 deletion syndrome. Am J Psychiatry. doi: 10.1176/appi.ajp.162.6.1090. in press. [DOI] [PMC free article] [PubMed] [Google Scholar]
- 30.Posner MI, Boies SJ. Components of attention. Psychol Rev. 1971;78:391–408. [Google Scholar]
- 31.Mesulam MM. A cortical network for directed attention and unilateral neglect. Ann Neurol. 1981;10:309–325. doi: 10.1002/ana.410100402. [DOI] [PubMed] [Google Scholar]
- 32.Mesulam MM. Large-scale neurocognitive networks and distributed processing for attention, language, and memory. Ann Neurol. 1990;28:597–613. doi: 10.1002/ana.410280502. [DOI] [PubMed] [Google Scholar]
- 33.Posner MI, Imhoff A, Friedrich FJ, Cohen A. Isolating attentional systems: a cognitive-anatomical analysis. Psychobiology. 1987;15:107–121. [Google Scholar]
- 34.Posner MI, Petersen SE, Fox PT, Raichle ME. Localization of cognitive operations in the human brain. Science. 1988;240:1627–1631. doi: 10.1126/science.3289116. [DOI] [PubMed] [Google Scholar]
- 35.Sprafkin J, Gadow KD, Salisbury H, Schneider J, Loney J. Further evidence of reliability and validity of the Child Symptom Inventory-4: parent checklist in clinically referred boys. J Clin Child Adolesc Psychol. 2002;31:513–524. doi: 10.1207/S15374424JCCP3104_10. [DOI] [PubMed] [Google Scholar]
- 36.Shaffer D, Fisher P, Lucas CP, Dulcan MK, Schwab-Stone ME. NIMH Diagnostic Interview Schedule for Children Version IV (NIMH DISC-IV): description, differences from previous versions, and reliability of some common diagnoses. J Am Acad Child Adolesc Psychiatry. 2000;39:28–38. doi: 10.1097/00004583-200001000-00014. [DOI] [PubMed] [Google Scholar]
- 37.Flaten MA. Startle reflex facilitation as a function of classical eyeblink conditioning in humans. Psychophysiology. 1993;30:581–588. doi: 10.1111/j.1469-8986.1993.tb02084.x. [DOI] [PubMed] [Google Scholar]
- 38.Graham FK, Putnam LE, Leavitt LA. Lead-stimulation effects of human cardiac orienting and blink reflexes. J Exp Psychol Hum Percept Perform. 1975;104:175–182. [PubMed] [Google Scholar]
- 39.Blumenthal TD. Inhibition of the human startle response is affected by both prepulse intensity and eliciting stimulus intensity. Biol Psychol. 1996;44:85–104. doi: 10.1016/0301-0511(96)05214-3. [DOI] [PubMed] [Google Scholar]
- 40.Fan J, McCandliss BD, Sommer T, Raz A, Posner MI. Testing the efficiency and independence of attentional networks. J Cogn Neurosci. 2002;14:340–347. doi: 10.1162/089892902317361886. [DOI] [PubMed] [Google Scholar]
- 41.Rueda MR, Fan J, Halparin J, Gruber D, Lercari LP, Mc Candliss BD, et al. Development of attention during childhood. Neuropsychologia. 2004;42:1029–1040. doi: 10.1016/j.neuropsychologia.2003.12.012. [DOI] [PubMed] [Google Scholar]
- 42.Daniel W. Biostatistics: A Foundation for Analysis in the Health Sciences. John Wiley & Sons; New York: 1991. [Google Scholar]
- 43.Posner MI, Dehaene S. Attentional networks. Trends Neurosci. 1994;17:75–79. doi: 10.1016/0166-2236(94)90078-7. [DOI] [PubMed] [Google Scholar]
- 44.Bench CJ, Frith CD, Grasby PM, Friston KJ, Paulesu E, Frackowiak RS, et al. Investigations of the functional anatomy of attention using the Stroop test. Neuropsychologia. 1993;31(9):907–922. doi: 10.1016/0028-3932(93)90147-r. [DOI] [PubMed] [Google Scholar]
- 45.Corbetta M, Miezin FM, Dobmeyer S, Shulman GL, Petersen SE. Selective and divded attention during visual discrimination of shape, color, and speed: functional anatomy by positron emission tomography. J Neurosci. 1991;11:2383–2492. doi: 10.1523/JNEUROSCI.11-08-02383.1991. [DOI] [PMC free article] [PubMed] [Google Scholar]
- 46.Pardo JV, Pardo PJ, Janer KW, Raichle ME. The anterior cingulate cortex mediates processing selection in the Stroop attentional conflict paradigm. Proc Natl Acad Sci USA. 1990;87:256–259. doi: 10.1073/pnas.87.1.256. [DOI] [PMC free article] [PubMed] [Google Scholar]
- 47.Martin JH. The visual system. In: Martin JH, editor. Neuroanatomy. Appleton and Lange; Norwalk: 1989. pp. 135–163. [Google Scholar]
- 48.Mountcastle VB. Brain mechanisms for directed attention. J R Soc Med. 1978;71:14–28. doi: 10.1177/014107687807100105. [DOI] [PMC free article] [PubMed] [Google Scholar]
- 49.Wurtz RH, Goldberg ME, Robinson DL. Behavioral modulation of visual responses in monkeys. Progr Psychobiol Physiol Psychol. 1980;9:42–83. [Google Scholar]
- 50.Petersen SE, Robinson DL, Morris JD. Contributions of the pulvinar to visual spatial attention. Neuropsychol Rev. 1987;25:97–105. doi: 10.1016/0028-3932(87)90046-7. [DOI] [PubMed] [Google Scholar]
- 51.LeBerge D, Buchsbaum MS. Attention filtering and the pulvinar: evidence from PET scan measures; Program of the 29th Annual Meeting Psychonometric Society.1988. p. 4. [Google Scholar]
- 52.Corbetta M, Akbudak E, Conturo TE, Snyder AZ, Ollinger JM, Drury HA, et al. A common network for functional areas for attention and eye movements. Neuron. 1998;21:761–773. doi: 10.1016/s0896-6273(00)80593-0. [DOI] [PubMed] [Google Scholar]
- 53.Kastner S, Pinks MA, De Weerd P, Desimone R, Ungerleider LG. Increased activity in human visual cortex during directed attention in the absence of visual stimulation. Neuron. 1999;22:751–761. doi: 10.1016/s0896-6273(00)80734-5. [DOI] [PubMed] [Google Scholar]
- 54.Shute CCD, Lewis PR. The ascending cholinergic reticular system: neocortical, olfactory and subcortical projections. Brain. 1967;90:497–520. doi: 10.1093/brain/90.3.497. [DOI] [PubMed] [Google Scholar]