Abstract
The enzyme cytochrome c peroxidase from Pseudomonas aeruginosa and its catalytic mechanism was investigated using protein film voltammetry. Monolayers of the diheme bacterial enzyme were immobilized on both pyrolytic graphite edge and alkanethiol modified Au electrodes. The redox couple associated with the low potential heme could be detected on both electrode surfaces at a reduction potential of −234 mV vs SHE. The midpoint potential displays a distinct pH dependence at acidic pH values, indicative of proton-coupled electron transfer. The non-turnover signal of the LP heme can be transformed into sigmoidal waves upon the addition of substrate. The midpoint potential of the turnover signals were used to calculate Michaelis-Menten kinetics with a Km = 25 μM. Catalysis was inhibited with addition of cyanide (Ki = 50 μM). These kinetic parameters are in good agreement with previously reported solution-based studies, indicated that the activity of the enzyme is unaffected by the immobilization on the electrode surface. The reduction potential of the catalytic wave clearly shows that rate-limiting species during electrocatalysis differs from those previously reported for peroxidases, indicating that PFV may be used in the future to distinguish the requirement for reductive activation in bacterial cytochrome c peroxidases.
Bacterial cytochrome c peroxidases (BCcPs1) are responsible for catalyzing the two electron reduction of hydrogen peroxide to water, a key function within the cellular detoxification pathway of reactive oxygen species in microbes (1). Bacterial peroxidases distinguish themselves from members of the well known plant and fungal peroxidase superfamily (e.g. horseradish peroxidase, yeast cytochrome c peroxidase), as they are dimeric proteins, with each monomer divided into two domains, which both contain a covalently bound c-type cytochrome and a Ca2+ ion bound between the two domains (2–6).
Early spectroscopic studies demonstrated that the two hemes were non-equivalent, each with a specific role within the enzyme (7; 8). In the fully oxidized form the high-potential (HP) heme is found to have His/Met axial ligation. The HP is presumed to act as an electron transfer center, accepting electrons from an exogenous electron donor and shuttling them to the second, low-potential (LP) heme. In the enzyme from Pseudomonas aeruginosa (Psa) the LP heme is bis-His ligated in the fully oxidized as isolated state, yet binds substrate in the course of catalysis.
The majority of bacterial peroxidase are inactive in the fully oxidized state due to the saturation of the LP heme coordination environment, depicted in Figure 1 for the Psa CcP. Reduction of the HP heme causes a chemical shift of the peptide backbone, designated the L-loop, which removes the distal axial histidine on LP heme (2–4; 6; 9). In addition to the removal of the axial histidine two important active site residues are affected by the change in HP heme oxidation state. Glutamic acid 114 has been proposed to act as an acid-base catalyst required for cleavage of the peroxide bond (2; 6). In the oxidized form Glu114 is oriented away from the peroxide binding site, as shown in Figure 1. After reduction this catalytically important residue rotates into the heme binding pocket. A similar shift is observed with Gln104, which is proposed to stabilize the heterolytic cleavage of the peroxide bond. The now penta-coordinated, high-spin peroxidatic heme can bind peroxide and enter the catalytic cycle. This pre-reduction of the HP heme is a requirement for activity for the majority of studied bacterial peroxidases, shown in Table 1.
Figure 1.
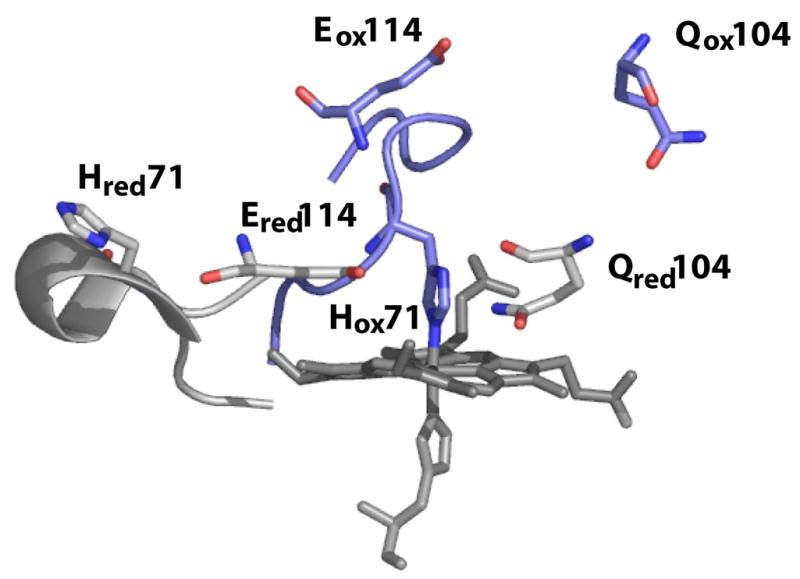
Active site structure in both the as-isolated oxidized state (blue) and the semi-reduced active state (gray). The change in oxidation state has significant effects on residues responsible for substrate binding (His-71) and peroxide bond cleavage (Gln-104 and Glu-114). (Figure of the oxidized and semi-reduced forms was prepared with Protein Data Bank files 1eb7.pdb and 2hvd.pdb, respectively).
Table 1.
Comparison of activity requirements for bacterial cytochrome c peroxidases.
One of the most notable exceptions is the enzyme from Nitrosomonas europaea. The crystal structure shows that in the diferric state the LP heme is already in the “open” penta-coordinated form (6). Crystal structures of the well studied diheme bacterial peroxidases from Paracoccus pantotrophus (9), Pseudomonas nautica (3), and most recently Psa (9) have revealed a series of loop movements initiated by reduction of the HP heme that eventually remove the distal histidine ligand of the LP.
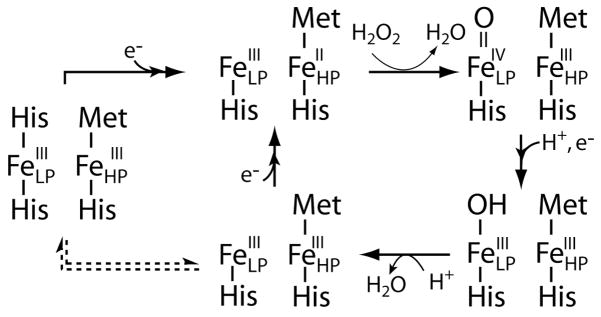
In the Pseudomonas and Paracoccus enzymes, once the HP heme is reduced and the LP heme possesses an open coordination site, the enzyme is proposed to enter the catalytic cycle shown in Figure 2 (top leftmost arrow). Heterolytic cleavage of the O-O bond causes the generation of a compound I-like intermediate, where one oxidizing equivalent is stored in the LP heme as an FeIV=O. Unlike the monoheme peroxidases which generate either a stable cation radical located on the porphyrin ring or an active site residue (10; 11), the second oxidizing equivalent for the bacterial peroxidases is found on the HP heme. An electron is then transferred from a donor through the HP heme and the LP heme is reduced to the ferric state. The transfer of this electron and two protons results in the generation of the second molecule of H2O. Thus, at least two diferric states can exist in the catalytic cycle: one is generated during turnover with a penta-coordinate LP heme, and the other is the as-isolated, inactive form. The timing of the inactivation of the LP heme (Figure 2, dotted arrows), versus the donation of a second reducing equivalent to the enzyme to the half-reduced state is still an open question in bacterial CcP biochemistry.
Figure 2.
Proposed scheme of activation of resting state Psa CcP, and the catalytic cycle for the reduction of hydrogen peroxide to two molecules of water. Proposed step associated with inactivation is shown in the dotted arrows.
We have utilized direct electrochemistry to investigate the redox chemistry and catalytic activity of cytochrome c peroxidase from Pseudomonas aeruginosa, one of the first bacterial diheme peroxidase to be studied. Early solution-based optical spectropotentiometric titration experiments showed a large reduction potential difference between the two hemes of +320 mV and −330 mV for the HP and LP hemes, respectively (10). The evidence for non-equivalence of the hemes lead to the proposed catalytic mechanism shown in Figure 2, but it is unclear as to the rate-limiting step involved in catalysis. Electrochemistry has been shown to be a useful technique to investigate the catalytic mechanism in cytochrome c peroxidases (12–14). Protein film voltammetry (PFV) allows for direct investigation of the redox active center as well as the catalytic chemistry during catalysis. The catalytic cycle of Psa CcP shows several proton-coupled steps in addition to simple electron transfer from the HP. At this point there have been no biochemical studies into the coupling of these steps within the catalytic mechanism. We describe here the electrochemical investigation of recombinant Psa cytochrome c peroxidase expressed in Escherichia coli. Using protein film voltammetry under both non-turnover and catalytic modes to elucidate the extent of coupled electron transfer we can better understand the mechanism of peroxide reduction by this prototypical bacterial diheme peroxidase.
MATERIALS AND METHODS
Protein Expression and Purification
Recombinant Pseudomonas aeruginosa cytochrome c peroxidase was expressed in E. coli JM109(DE3) with pETCCP co-expressed with pEC86, as previously reported (15). Enzyme was harvested from whole cells using osmotic shock and initially purified by ammonium sulfate precipitation (30–55%). The cell pellet is resuspended and then dialyzed in 10 mM Tris pH 8.5, 2 mM CaCl2 to remove ammonium sulfate. Psa CcP was then further purified by DEAE-Sepharose followed by S-100 size exclusion chromatography. Purity of the final enzyme was verified using SDS-PAGE and electronic absorption spectroscopy with a 408/280 nm ratio of 4.8 typically.
UV/Vis Spectroscopy
Optical spectra of purified Psa CcP were collected on a Varian Cary 50 UV-Vis spectrophotometer. Half-reduced samples were prepared using 20mM sodium ascorbate. Protein/ascorbate solutions were allowed to incubate for 1 hr at room temperature before being analyzed.
Electrochemistry
Protein film voltammetry experiments were all carried out using a PGSTAT 12 AutoLab (Ecochemie) potentiostat, equipped with FRA and ECD modules. A three-electrode configuration was used with a water-jacketed glass cell. All experiments were done at 1°C with temperature maintained using a refrigerated circulator. A platinum wire counter electrode was used along with a saturated Calomel reference electrode. Potentials were reported vs hydrogen electrode (SHE) and corrected by +242 mV. A cell solution of 5mM MES, HEPES, TAPS, and CHES with 0.1 M NaCl (and optional 2 to 10 mM Ca2+) allowed for a broad pH range to be investigated. Working electrode was rotated with a EG&G electrode rotator as described below.
Protein films were generated on both pyrolytic graphite edge (PGE) and alkanethiol-modified Au electrodes. PGE electrodes were polished with 1 μm alumina. The alumina was removed by sonication and the electrode rinsed with clean water. Au electrodes were polished with 1 μm alumina, followed by 0.3 μm and 0.05 μm alumina. The electrodes were then electrochemically cleaned in 0.1 M H2SO4 by cycling over a range of 0.2 to 1.35 V (vs. SCE). Electrochemically polished Au electrodes were then modified by soaking overnight in 2 mM 1-octanethiol in ethanol. Excess alkane thiol was removed by rinsing with ethanol and then distilled H2O. Protein films were grown on both electrode materials by soaking overnight in a protein solution ≥ 40 μM CcP with 10 mM Ca2+. Excess protein was removed from the working electrode by rinsing with distilled water.
Non-turnover electrochemical signals were generated on the bench top with the electrochemical cell housed in a Faraday cage to minimize noise. Argon was bubbled through the cell solution to remove oxygen. Catalytic electrochemical analyses were all performed in an MBraun Labmaster glovebox to exclude the presence of oxygen; all catalytic experiments were performed upon PGE-based electrodes due to adventitious H2O2 reduction on gold electrodes. Data were collected with the GPES software package (Ecochemie). Non-turnover signals were analyzed by subtraction of baseline electrochemical response of the electrode surface from the raw data using the SOAS package, courtesy of Dr. Christophe Léger. A similar treatment was used for analysis of limiting current values and catalytic midpoint potentials of the turnover signals. A linear baseline was subtracted from the cathodic scan of raw data.
RESULTS
Protein Purification
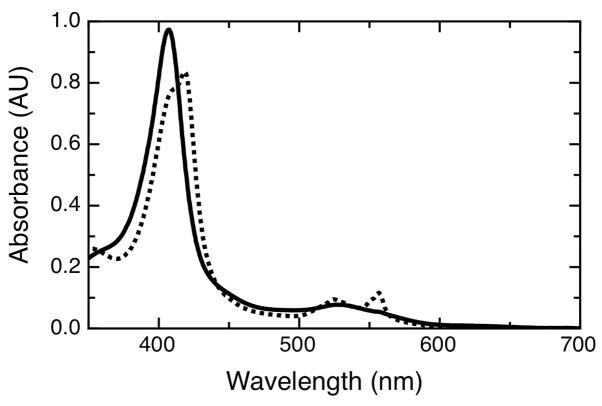
Recombinant cytochrome c peroxidase from Pseudomonas aeruginosa was prepared according to literature methods (9; 15). Optical spectra of the purified enzyme were taken to ensure proper heme incorporation. Figure 3 shows the air-oxidized and ascorbate-reduced forms of Psa CcP achieved by redoxpoising, which are similar to previously reported spectra. As-isolated enzyme was purified in the diferric form exclusively. Treatment with 20 mM ascorbate results in the reduction of the HP heme to the ferrous form, while the LP heme remains in the Fe3+ state, corresponding to the Soret shoulder displayed in the half-reduced form demonstrates the presence of both the HP and LP heme in the ferrous and ferric form, respectively. (Reduction with dithionite results in fully reduced, diferrous protein, in accord with previous studies (22)).
Figure 3.
Optical spectra of Psa CcP for the oxidized (solid) and half-reduced (dash) forms of the enzyme. Oxidized Psa CcP (4 μM) was diluted in 20 mM Hepes, 50 mM NaCl, pH 7.5. The half-reduced state was achieved by incubation in the presence of 20 mM ascorbate with 10 mM CaCl2 for 1 hour at room temperature.
Direct Electrochemistry
We have carried out a series of electrochemical experiments to further characterize the diheme peroxidase from Pseudomonas aeruginosa. Psa CcP was investigated with PFV on both 1-octanethiol modified gold and PGE electrodes, over a wide pH range. Films generated on both electrode materials display stable, electroactive voltammograms at pH 7, as shown in Figure 4. Subtraction of the non-farradaic component of the voltammograms apparently reveals a single quasireversible feature with midpoint potential (Em) = −234 mV vs SHE at pH 7, regardless of electrode material. This represents the equilibrium between the FeII/III states of the peroxidatic heme. At this time, PFV has not revealed features at higher potential that would indicate the HP heme; thus, the HP center may be electronically isolated in the PFV experiment (see below). While the linear scan-rate dependence of the peak height indicates that observed feature is adsorbed at the electrode interface, the responsible redox couple appears to be 1-electron in nature, as the a peak-width-at-half-height (δ) is 100 mV, consistent with of a 1-electron process. Regardless of the material used in the PFV studies, the midpoint potential for the LP heme determined using PFV is approximately 100 mV higher in potential than previously reported using optical spectroscopy (10). Figure 4 also illustrates that at slower scan-rates (100 mV/s vs. 2 V/s) a second feature is clearly observed (Figure 4B) at higher potential, that is undetected at faster scan rates.
Figure 4.
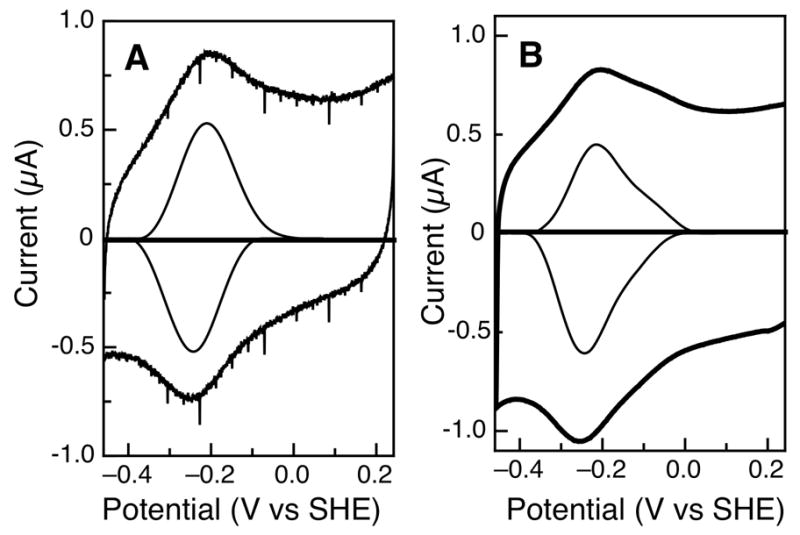
Raw and baseline-subtracted data for Psa CcP at pH 7, on different electrode surfaces. (A) Protein film on a 1-octanethiol-modified gold electrode, scan rate is 2 V/s. (B) Analogous protein film studied at a pyrolytic graphite edge electrode, scan rate is 100 mV/s.
pH Dependence
While preliminary analyses of the non-turnover voltammetry of Psa CcP suggested a single redox couple was present, unforeseen changes were observed as pH was altered through the course of subsequent PFV experiments. Protein films of the Psa CcP were found to be stable over a wide-range of pH values, allowing for analyses from pH 3 to 10. The effect of pH on the midpoint potential of the Psa CcP LP heme is shown in Figure 5, spanning a pH range of 7 (solid line) to 4 (dotted line). By using the maximum current in the cathodic and anodic half-scans, it was observed that in the course of altering the pH, a shift in potential was observed, but more importantly, the data show a second feature becoming greatly prominent at lower values of pH. The baseline-subtracted data (Figure 5, inset) clearly indicates that at pH 7, a single redox couple (I) is dominant, but at more acidic pH values, a second couple (II) is clearly discernible at a more positive value of potential. Couple II has a midpoint potential of −76 mV vs. SHE at pH 6. As the pH becomes more acidic the midpoint potentials of both couples (I and II) shift, but the current area of each signal changes reciprocally. Couple II becomes significantly more prominent at acidic pH values, while at the same time, couple I diminishes, suggesting a change in the population of the respective electroactive species. The lower inset of Figure 5 illustrates this behavior: cathodic peak currents of I (closed circles) and II (open triangles) show an inverse relationship as a function of pH, such that as the current of I decreases, current of II increases. This type of behavior suggests that at acidic pH a chemical change is altering the midpoint potential of the LP heme, shifting the population of couple I into couple II. The baseline-subtracted voltammograms show that over the investigated pH range Psa CcP gives stable, reversible signals as LP heme shifts towards signal II, and no systematic shift in the appearance of both species seemed to occur as a function of time, electrode material, or which buffers were used in the variable pH experiments. At the 100 mV/s scan rate used in these experiments the peak separation is 40 mV at pH 7, where the LP heme demonstrates essentially signal I only; the peak separation is the same at pH 4, where signal II dominates the voltammogram. It is known that changes or loss of axial ligation can affect redox potential (16). Therefore it is possible that lowering the pH causes movement of the L-loop, removing the distal histidine ligand, leaving a penta-coordinate heme. This pH induced structural change has been suggested to occur for the fully-oxidized Psa enzyme (31). Therefore couple I could represent the closed, hexa-coordinated low-potential heme, while couple II is the open, penta-coordinated form of the low-potential heme, which are linked by a dotted arrow in Figure 2.
Figure 5.
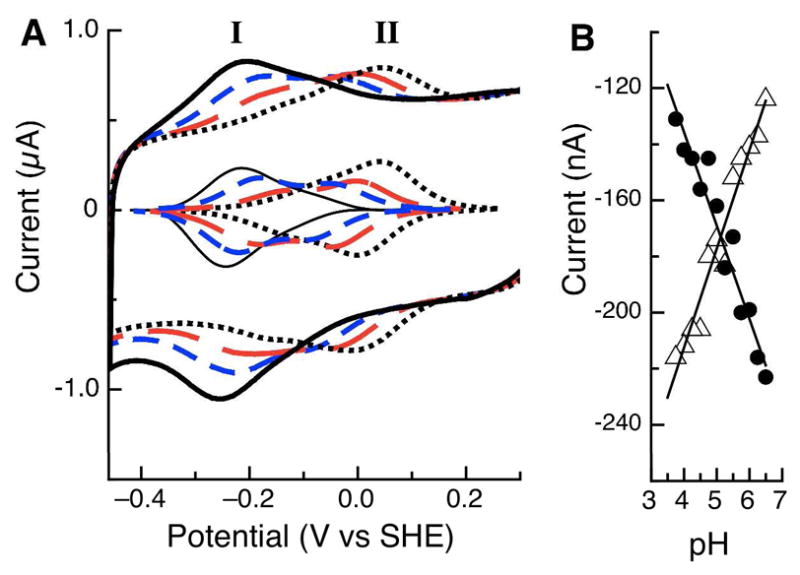
(A) Raw and baseline-subtracted data for Psa CcP studied at PGE electrodes, as a function of pH. pH values of 7 (black), 6 (blue), 5 (red) and 4 (dotted black) are shown. (B) Maximum values of the peak current for the cathodic half-scan for features I (λ) and II (Δ), as a function of pH.
In addition to the relative populations of I and II, the pH also perturbs the reduction potential of each species. Figure 6 uses couple I as an example, and illustrates the impact of pH on the midpoint potential: a linear pH dependence is seen between pH 3 to 6, with a slope of −29 mV/pH decade. The Psa CcP pH dependence is less than slope associated with a 1e− : 1H+ process (−54 mV/pH decade at 0 °C), suggesting that additional proton-coupled events are at work at pH values lower than 6, yet still coupled to a single electron transfer. Couple II displays a similar linear pH dependence over this pH range, giving a slope of −34 mV/pH decade (data not shown). At this time it is only clear that a single pKa dominates the data shown in Figure 6. Over the range of pH values from 8 to 10 the midpoint potential becomes pH independent, and the data over the entire pH range can be fit to equation 1, a model is typical of protonation in the reduce form (17). Here the electron:proton ratio is taken to be one-half, simplifying the additional ionization events at acidic values of pH. We obtained Ealk = −237 mV and pKred = 6.99.
Figure 6.
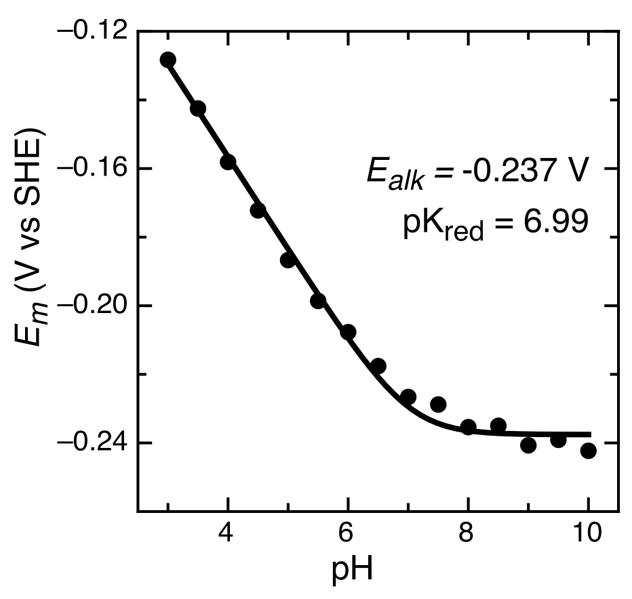
pH dependence of the average peak maximum for Psa CcP on 1-octanethiol modified gold electrodes. Data are fit to the model of a single ionization associated with the reduced state, given in Equation 1.
| (1) |
Notably, similar behavior is observed for II, though II only displays a linear pH dependence until it merges with I, after which it appears to be pH independent.
Ligand Binding
To elucidate whether the higher potential feature at acidic pH values represents a state where the LP heme may have lost the distal histidine ligand, we probed the effect of known heme coordinating ligands to the voltammetry, by adding bulk ligand to the cell solution. Exogenous nitrogen donors such as cyanide and azide have been shown to act as competitive inhibitors for bacterial peroxidases (12; 13) as well as coordinating ligands to heme (16). Coordination of these ligands will presumably stabilize the ferric state, thereby lowering the redox potential. Figure 7 shows that at pH 5, where the LP heme exists in both conformations, increasing concentrations of cyanide from 0 μM (black) to 10 μM (blue) results in a complex perturbation of the electrochemical response: couple II shifts to a lower potential value, closer to couple I, and the apparent magnitude of the couple becomes less, with respect to I. The inclusion of 10 μM cyanide completes the transformation, and only a single feature is visible in the voltammogram. A similar trend is seen with the alternative ligand azide, although the behavior is only observed with a hundred-fold greater concentration (data not shown).
Figure 7.
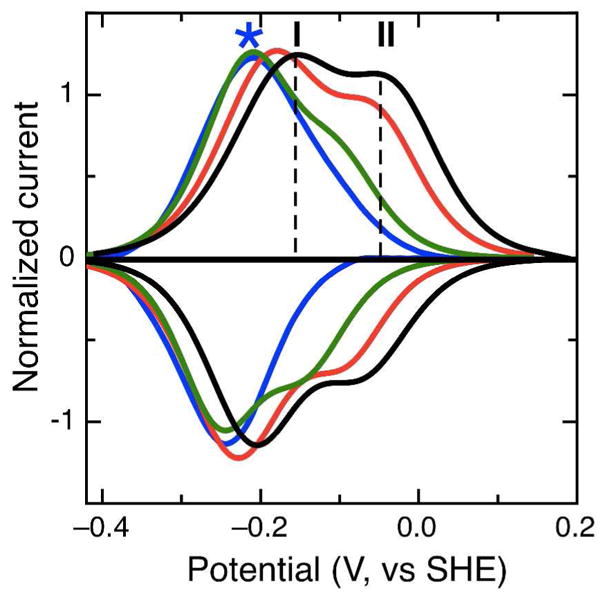
Baseline-subtracted data for the addition of cyanide to Psa CcP studied at a PGE electrode at pH 5. Non-turnover signals are shown in the presence of 0, 1, 3, and 10 μM potassium cyanide (black, red, green and blue traces, respectively.)
Catalytic Activity
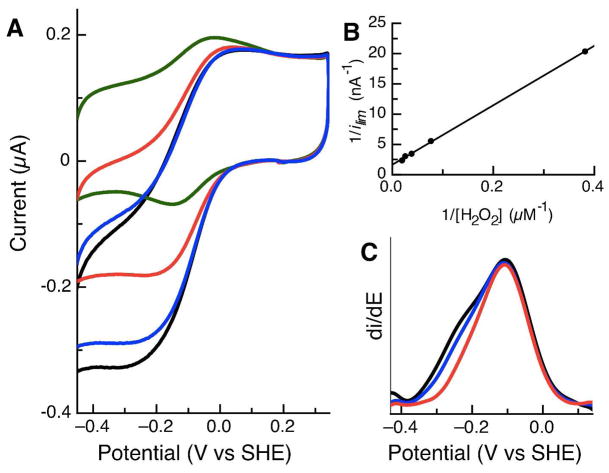
Electrocatalytic reduction of hydrogen peroxide was investigated by adding the substrate to Psa CcP immobilized at a rotating disc electrode, and catalytic PFV data are shown in Figure 8. By adding substrate, the voltammograms are transformed into reversible, sigmoidal waves as the electrode provides electrons to the LP heme and subsequently to the substrate. The sigmoidal waves are described by a midpoint potential of the transition, −69 mV vs SHE at low peroxide concentration, which is very close to the Em of couple II, and considerably lower in potential than electrocatalytic potentials observed for other heme peroxidases (12–14).
Figure 8.
Electrocatalytic reduction of hydrogen peroxide at a PGE electrode with Psa CcP adsorbed. (Experimental conditions: pH 7, scan rate = 10 mV/s, rotation rate = 2000 rpm.) (A) Voltammograms were collected at 3, 13, 26 and 40 μM hydrogen peroxide (green, red, blue and black traces, respectively). (B) Lineweaver-Burke plot of Psa CcP turnover of substrate. (C) Effect of increased substrate concentration on shape of the catalytic voltammogram. The first derivative of the catalytic current at 13, 40 and 60 μM hydrogen peroxide (red, blue and black traces, respectively).
Further useful information can be derived from the catalytic voltammogram by considering the limiting current (ilim) as an enzymatic velocity (36; 37). We have found that the limiting current of Psa CcP increases with increasing H2O2 concentration and eventually saturates, in accordance with Michaelis-Menten kinetics. The electrode is rotated at 2000 rpm to eliminate the effects of diffusion on enzymatic activity and the stability of the protein film at this rotation rate allows for multiple scans to be taken. Using the value of the current at −400 mV observed in the reductive half-scan as the true limiting current, ilim was considered as an enzymatic velocity, and a Km = 25 μM for H2O2 was calculated using Lineweaver-Burke analysis (Figure 8A, inset). This is similar to the Km determined previously in tradition solution based assays for hydrogen peroxide reduction using ferrocytochrome c-551 as an electron donor of 12 μM (18), showing that immobilization of the electrode does not effect peroxidase activity adversely.
In addition to the relationship of the observed limiting current with substrate concentration, increased substrate concentration was found to alter the general shape of the oxidative half-scan of catalytic voltammogram. By viewing the derivative of the sigmoidal catalytic signatures (Figure 8B) peak-shaped signals are observed, which can be used to assess the features of the catalytic wave. As Figure 8B shows, when the substrate concentration is below Km (13 μM) a highly symmetrical catalytic response that is consistent with an n=1 electron process (blue trace) results, while the symmetry is lost as the concentration of peroxide exceeds Km (40 and 60 μM, red and black traces, respectively). The broadening of the catalytic wave may be attributed to coupled phenomena, such as proton transfer (19; 20). Intriguingly, the pH dependence of the non-turnover signals (vide supra) indicates that protons may not be able to access and exit the active site freely, as revealed by a proton:electron stoichiometry that is apparently less than unity.
Inhibition
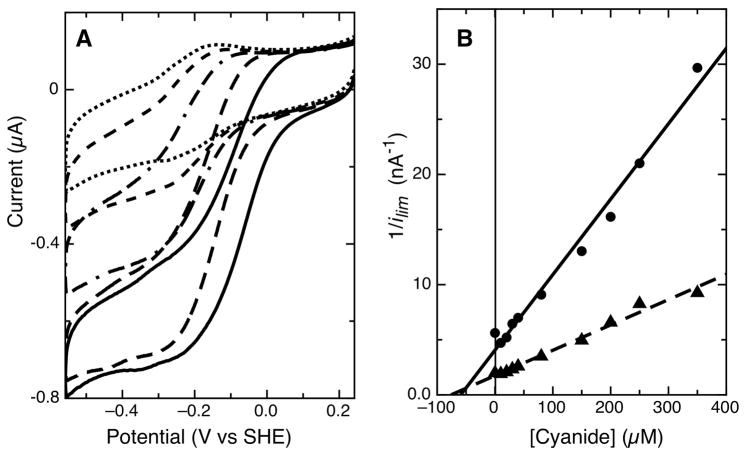
Though broadening of the wave-shape at high substrate concentrations was observed, we turned to the use of reversible inhibition as a means of probing the activity of the immobilized Psa enzyme, and providing additional evidence for the intact nature of the CcP active site (12; 13). While the non-turnover experiments demonstrate the impact of ligand binding upon the redox characteristics of couple II, in the presence of substrate, it is presumed that inhibition will merely deplete the limiting current and potentially perturb the observed midpoint potential of catalysis. Figure 9a shows that change in ilim with increasing concentration of cyanide. We can calculate the Ki value for cyanide using a Dixon plot, displayed in Figure 9b. Using the graphical analysis of the intersection of the fits for the various hydrogen peroxide concentrations we can learn about the mode of inhibition in addition to Ki. The two linear fits intersect below the y-axis, in a negative x quandrant, where Ki’ > Ki. This is indicative of either competitive or mixed-type inhibition (40). Ki is taken as the negative of the cyanide concentration at the point of intersection, giving a value of 50 μM. This value is higher than previously determined, (Ki = 7 μM), though within an order of magnitude. Both the solution measurements and the PFV data agree that cyanide acts as a mixed inhibitor of the Pseudomonas enzyme (21; 22).
Figure 9.
Inhibition effects of cyanide on Psa CcP electrocatalysis at pH 7. (A) Raw data of electrocatalytic reduction of 25 μM substrate (solid line) in the presence of 10 (dashed line), 80 (dot-dashed line), 250 (short dash line) and 500 μM (dotted line) potassium cyanide. (B) Dixon plot of cyanide addition in the presence of 15 μM (λ) and 25 μM (σ) hydrogen peroxide.
DISCUSSION
We have found that the Psa CcP displays identical voltammetric features at both PGE and hydrophobically-modified gold electrodes, which we attribute to the FeII/III couple of the peroxidatic heme. At this time, our findings represent the first example of stable non-turnover and catalytic voltammograms of a bacterial peroxidase on multiple electrode materials (12; 13; 23; 24). Previous attempts to resolve catalytic features of the Pseudomonas-type of BCcPs (such as the enzyme from Paracoccus pantotrophus) have required the use of mediating redox partners to shuttle electrons into the enzyme (24), while here we access the LP active site of the Psa enzyme directly. As described below, the pH dependent behavior of the electrochemical response in the absence of substrate reveals two distinct states of the LP, while the electrocatalytic response can be studied as a function of substrate and inhibitor concentration as a means of verifying that the Psa CcP active site is intact and functioning like native enzyme.
Development of an electrochemical model
To best interpret our PFV data, we must note that a PFV signal for the HP heme FeII/III couple has yet to be observed here, or in the case of any bacterial CcP that also demonstrates electrocatalysis. This may be due to the exact disposition of the Psa enzyme upon the electrode, which could preclude efficient electron transfer to the HP heme, and allows for electrons to pass directly to the LP heme only. Regardless, all indications suggest that upon either electrode, the Psa CcP is still active, and displays several characteristics anticipated for fully folded, native enzyme: The reversibility of the LP heme signal over a wide range of scan rates indicates efficient electron transfer; the quasi-reversible separation of the cathodic and anodic peak are stable up to a scan rate of 10 V/s and the peak shape of oxidative and reductive features are highly symmetric, indicating efficient electron transfer between the heme cofactor and the electrode. In the non-turnover regime, there is no evidence for coupled reactions that would give rise to gating (26). The relatively unchanged current ratio of the cathodic and anodic peaks over a scan range of 0.01 to 10 V/s supports a pure redox process. Finally, as described below, the catalytic PFV response indicates that the enzyme is activated at the electrode readily, and yields apparent Km and Ki values that are indicate of the native enzyme. Similar to solution measurements that indicate that inclusion of excess Ca2+ is required for maximal catalytic activity (2–4; 9; 28; 29), we find that stable films of Psa CcP can only be generated in the presence of 10 mM Ca2+, though the PFV response does not depend upon excess Ca2+ in the cell solution once the enzyme is adsorbed. Thus, the collective evidence discussed below indicates that the Psa CcP can be interrogated at an electrode in a manner that reveals events at the active site, though there is no single clear rationale for the absence of the voltammetric response of the HP heme. Simplistically, it would seem that the HP signal should be observed, in a similar fashion to the as stable films of the His/Met-ligated Psa cytochrome c551 (Em = +290 mV vs SHE) that can be studied at either modified gold (25) or pyrolytic graphite edge electrodes (39). Yet, the HP center appears to be insulated in our PFV measurement, such that our data dissect the CcP mechanism, allowing us to focus on steps of redox chemistry associated with the LP heme alone.
Non-turnover voltammetry
In the absence of substrate, the electrochemical response of LP indicates the resting state of the enzyme. Here, all PFV data are conducted at a potential where the HP heme should be reduced (though the HP heme may indeed be electrochemically insulated from the electrode, vide supra). Thus, the appearance of broad voltammograms that contain information about more than one redox couple (Figure 5) suggests that there are two distinct populations of molecules upon the electrode surface. Generally, the pH dependence of the LP peroxidatic heme supports the importance of the distal active site residues, such as His71, in determining both the relative population (the intensity of the electrochemical signal) and Em value displayed by the two states LP that can be observed. The fitting of the pH dependence model generated a pKred of 6.99 (Figure 6), which is consistent with a histidine residue, and one model for the non-turnover data poses that at pH values below neutral, protonation of one or more distal residues results in the loss of His71 as a ligand, and the appearance of couple II, an “open” conformation that is chemically ready to bind substrate. As the pH becomes more acidic the population of the LP shifts continually towards the open conformation, as observed in Figure 5 (inset). Simultaneously, the anodic peak current from I decreases as the pH is lowered, as the peak current of II increases. Meanwhile, as both I and II represent proton-coupled states, the pH-dependent shift of Em can also be rationalized at pH values below the pKa, and at values above the pKa, where I is the only state that exists, and it is no longer pH dependent. The transformation between I and II also coincides with solution-based catalytic properties, as it has been shown in solution based kinetic experiments that peroxidatic turnover is at a maxima at acidic pH (~5.5) (18; 28; 31). Here, this is understood in terms of the requirement for protons in the reduction of hydrogen peroxide to water, but also in terms of favoring the electrode-based equilibrium state II, which participates in catalysis. We also note that this model is strongly supported by the monitoring of non-turnover response at pH 5, where both I and II can be observed (Figure 7). In this experiment, increasing amounts of the inhibitor cyanide strongly impact couple II, shifting the potential to lower values, and depleting the population of the open conformation. Upon saturation, a single new, yet-lower potential feature (Figure 7, blue trace) indicative of the cyanide-bound form of LP. Thus, we take it that II indicates one of the catalytically relevant forms of Psa CcP, which has lost coordinating His71, and is ready to bind substrate.
These pH dependence of the PFV response of I and II suggest that the conversion of the “open” and “His-bound” conformations illustrated in Figure 1 may be in equilibrium in solution as a function of pH. It is possible that in our experiments, such chemistry occurs independent of the redox status of the HP heme, or perhaps as a result of the surface adsorption (where the HP heme is insulated from redox activity). The first of these possibilities has been suggested previously for solution based experiments, as Soininen and Kalkkiken have reported pH-dependent visible absorption and CD spectroscopic data for the fully oxidized form of Psa CcP, which show that perturbation of the spectra occurs as a function of pH (31). The data support a model where the His71-bearing loop may undergo conformation dynamics due to protonation events, independent of a redox event at the HP heme. However, the spectroscopic studies did not quantitative assessment of the amount of “open” and “closed” conformer as a function of pH, and may be further complicated by spectroscopic contributions from the HP, which also may be pH dependent. Thus, an equilibrium constant for the “open”/”closed” interconversion cannot be determined on the basis of these data alone, and if the redox chemistry associate with I and II can be linked in a square-scheme (26, 41), additional data on the redox-independent, pH-dependent His71 dissociation are required.
A critical caveat, however, is that the couple associated with II is assigned as a FeII/III couple, which limits the interpretation of the electrocatalytic data considered below. As described above, the general features of the PFV response indicate that the active site is intact, and there is good agreement between PFV and solution-based properties. Therefore, while the catalytic currents are representative of enzymatic chemistry, the catalytic midpoint potential corresponds to a FeII/III couple, suggesting that the redox couple by which the catalytic information is detected does not appear in the formal mechanism of the Psa catalytic cycle (Figure 2). Due to this trait the electrocatlytic data can be treated as enzymatic velocities, but more detailed evaluation of rate constants of individual fundamental steps (such as described in references 37 and 41) is not possible at this time.
Catalytic voltammetry
Where the non-turnover signals elucidate the dynamics of the resting, inactive forms of the LP heme, the addition of substrate results in electrocatalytic limiting currents. Considering the caveat articulated above, we can use the limiting currents as enzymatic velocities to approximate the activity of the Psa active site. Proceeding with this approximation seems reasonable, as the value of Km calculated using ilim as a function of substrate, reveals similar substrate binding for Psa CcP (32–34) and within the range of other studied bacterial peroxidases (6 to 25 μM) (2; 13; 28; 29). Similar to the kinetic characteristics, the mode of inhibition determined from ilim values collected in the presence of cyanide are in good agreement with previously reports of solution-based studies. Thus, it appears that adsorption of enzyme on either electrode surface does not alter the intrinsic characteristics of bacterial peroxidase active site. As we describe below, it is the value of Ecat that truly separates the Psa enzyme.
While the various catalytic experiments discussed suggest that Ecat represents an active-site process, it is clear that the value of Ecat, −70 mV at pH 7, is very low with respect to other electrocatalytic midpoint potentials associated with previously characterized peroxidases. Generally, all previous studies of bacterial and yeast peroxidase catalytic voltammetry have reported Ecat values ≥ +500 mV. In the case of the monoheme yeast cytochrome c peroxidase Ecat arises from the cooperative two-electron oxidation to compound I (14), and both non-turnover and catalytic signals have midpoint potentials of +740 mV, which have been interpreted in terms of a FeIV=O:W191 cation-radical state of the enzyme. Voltammograms of peroxidatic catalytic intermediates have been shown for the Nitrosomonas CcP as well (13), with values of Ecat greater than +515 mV, clearly lower than the catalytic intermediate found for yCcP, but which is still significantly higher in potential than the Psa enzyme. While inhibitor and pH dependence studies of the Nitrosomonas enzyme support a model where Ecat corresponds to a proton-coupled species generated after the formation of FeIV=O:R+• compound I-like intermediate, here Ecat for Psa CcP is closer to the reduction potential of a FeII/III couple.
Both yeast and Nitrosomonas europaea cytochrome c peroxidase have different catalytic mechanisms for the reduction of H2O2 than Pseudomonas aeruginosa. Despite also being a diheme bacterial peroxidase Ne CcP is catalytically active without pre-reduction of the high potential, electron transfer heme (13). Most diheme BCcP enzymes, such as the Psa CcP, require pre-reduction before becoming active, however, and interaction between the hemes is essential for catalysis. The HP must be reduced to cause a chemical rearrangement of the peptide backbone to open up a binding site on the LP heme and to bring proposed acid/base catalysts into range to support heterolytic cleavage of the O-O peroxide bond (2). The HP heme also supplies electrons from an electron donor to the LP during the catalytic cycle to regenerate the active form. Thus, one might choose to interpret the Psa Ecat as representing electron transfer between the hemes. However, the low potential of Ecat excludes the possibility of rate-limiting intramolecular electron transfer from the HP heme to the LP active site, and the HP heme appears to be electronically isolated in our study. This is further supported by the pH and substrate dependence of Ecat shown above, which are consistent with an electrocatalytic feature associated with the active site, and an inter-cofactor relay mechanism. The use of inhibitors such as cyanide further helps to elucidate the step that dictates catalysis. If Ecat was indicative of interfacial electron transfer, then the binding of inhibitors would have no perturbation of the catalytic voltammogram. As we have shown in Figure 9 this is not the case. Addition of increasing concentrations of cyanide effects both ilim and Ecat, suggesting that electrochemical data represents chemistry at the active site of the enzyme. Though discerning the precise nature of the Ecat associated with the Psa enzyme will be an ongoing effort, it is clear that the potential is much lower than that observed for enzymes that do not require reductive activation (e.g., the Nitrosomonas CcP). As such, PFV may be a rapid tool for the discerning of this catalytic property for other, uncharacterized BCcP enzymes.
CONCLUSION
From the various electrochemical studies performed on Psa CcP we have begun to better understand the catalytic mechanism as it relates to this classic bacterial peroxidase. It is clear that we are examining processes at the active site and that the rate-determining step in catalysis differs from those previously reported in electrochemical studies of BCcP enzymes that do not require reductive activation. Considering the mechanism in Figure 2 the likely rate-limiting step involves the proton-coupled release of the second equivalent of water, followed by reduction. Importantly, studies on the steady-state kinetics of horseradish peroxidase, a well-studied mono-heme peroxidase, have determined that the reduction of compound II back to the native enzyme is the slow step within the catalytic cycle (35). Thus, at either graphite or gold electrodes, PFV allows us to interrogate new mechanistic peroxidase chemistry as well the dynamics of the active site resting state. Further, as the observed potential for catalysis is much lower than previous reports peroxidases, one will be able to determine if the low-potential electrocatalysis is a general trait of bacterial peroxidases that require reductive activation.
Footnotes
Abbreviations: BCcP, bacterial cytochrome c peroxidase; HP, high-potential; LP, low-potential; Psa, Pseudomonas aeruginosa; PFV, protein film voltammetry; SHE, standard hydrogen electrode; MES, 2-(N-Morpholino)ethanesulfonic acid; HEPES, 4-(2-Hydroxyethyl) piperazine-1-ethane sulfonic acid; TAPS, N-[Tris(hydroxymethyl)methyl]-3-aminopropanesulfonic acid; CHES, 2-(Cyclohexylamino)ethanesulfonic acid; PGE, pryolytic graphite edge; Em, mid-point potential;δ, peak width at half-height; ilim, limiting current; Kred, ionization constant of the reduced state.
This work was supported by a National Institutes of Health grant (R01-GM072663).
References
- 1.Dunford HB, Stillman JS. On the function and mechanism of action of peroxidases. Coordination Chem Rev. 1976;19:187–251. [Google Scholar]
- 2.De Smet L, Savvides SN, Van Horen E, Pettigrew G, Van Beeumen JJ. Structural and mutagenesis studies on the cytochrome c peroxidase from Rhodobacter capsulatus provies new insight into structure-function relationship of bacterial di-heme peroxidases. J Biol Chem. 2006;281:4371–4379. doi: 10.1074/jbc.M509582200. [DOI] [PubMed] [Google Scholar]
- 3.Dias JM, Alves T, Bonifacia C, Pereira AS, Trincao J, Bourgeois D, Moura I, Romao MJ. Structural basis for the mechanism of Ca(2+) activation of the di-heme cytochrome c peroxidase from Pseudomonas nautica 617. Structure. 2004;12:961–973. doi: 10.1016/j.str.2004.03.025. [DOI] [PubMed] [Google Scholar]
- 4.Echalier A, Goodhew CF, Pettigrew G, Fülöp V. Activation and catalysis of the di-heme cytochrome c peroxidase from Paracoccus pantotrophus. Structure. 2006;14:107–117. doi: 10.1016/j.str.2005.09.011. [DOI] [PubMed] [Google Scholar]
- 5.Fülöp V, Ridout C, Greenwood C, Hajdu J. Crystal structure of the diheme cytochrome c peroxidase from Pseudomonas aeruginosa. Structure. 1995;3:551–567. doi: 10.1016/s0969-2126(01)00258-1. [DOI] [PubMed] [Google Scholar]
- 6.Shimizu H, Schuller DJ, Lanzilotta WN, Sundaramoorthy M, Arciero DM, Hooper AB, Poulos TL. Crystal structure of Nitrosomonas europaea cytochrome c peroxidase and the structural basis for ligand switching in bacterial di-heme peroxidase. Biochemistry. 2001;40:13483–13490. doi: 10.1021/bi011481h. [DOI] [PubMed] [Google Scholar]
- 7.Rönnberg M, Ellfolk N. Pseudomonas cytochrome c peroxidase. Initial delay of the peroxidatic reaction Electron transfer properties. Biochim Biophys Acta. 1978;504:60–66. doi: 10.1016/0005-2728(78)90006-3. [DOI] [PubMed] [Google Scholar]
- 8.Rönnberg M, Ellfolk N. Heme-linked properties of Pseudomonas cytochrome c peroxidase. Evidence for non-equivalnce of the hemes. Biochim Biophys Acta. 1979;581:325–333. doi: 10.1016/0005-2795(79)90252-6. [DOI] [PubMed] [Google Scholar]
- 9.Echalier A, Brittain T, Wright J, Boycheva S, Mortuza GB, Fülöp V, Watmough NJ. Redox-linked structural changes associated with the formation of a catalytically competent form of the diheme cytochrome c peroxidase from Pseudomonas aeruginosa. Biochemistry. 2008;47:1947–1956. doi: 10.1021/bi702064f. [DOI] [PubMed] [Google Scholar]
- 10.Ellfolk NRM, Aasa R, Andréasson L, Vänngård T. Properties and function of the two hemes in Pseudomonas cytochrome c peroxidase. Biochim Biophys Acta. 1983;743:23–30. doi: 10.1016/0167-4838(83)90413-2. [DOI] [PubMed] [Google Scholar]
- 11.Sivaraja M, Goodin DB, Smith M, Hoffman BM. Identification by ENDOR of Trp191 as the free-radical site in cytochrome c peroxidase compound ES. Science. 1989;245:738–740. doi: 10.1126/science.2549632. [DOI] [PubMed] [Google Scholar]
- 12.Bradley AL, Arciero DM, Hooper AB, Elliott SJ. Protonation and inhibition of Nitrosomonas europaea cytochrome c peroxidase observed with protein film voltammetry. J Inorg Biochem. 2007;101:173–179. doi: 10.1016/j.jinorgbio.2006.09.009. [DOI] [PubMed] [Google Scholar]
- 13.Bradley AL, Chobot SE, Arciero DM, Hooper AB, Elliott SJ. A distinctive electrocatalytic response from the cytochrome c peroxidase from Nitrosomonas europaea. J Biol Chem. 2004;279:13297–13300. doi: 10.1074/jbc.C400026200. [DOI] [PubMed] [Google Scholar]
- 14.Mondal MS, Fuller HA, Armstrong FA. Direct measurement of the reduction potential of catalytically active cytochrome c peroxidase compound I: Voltammetric detection of a reversible, cooperative two-electron transfer reaction. J Am Chem Soc. 1996;118:263–264. [Google Scholar]
- 15.Hsiao HC, Boycheva S, Watmough NJ, Brittain T. Activation of the cytochrome c peroxidase of Pseudomonas aeruginosa. The role of a heme-linked protein loop: A mutagenesis studies. J Inorg Biochem. 2007;101:1133–1139. doi: 10.1016/j.jinorgbio.2007.04.012. [DOI] [PubMed] [Google Scholar]
- 16.Battistuzzi G, Borsari M, Cowan JA, Ranieri A, Sola M. Control of cytochrome c redox potential: axial ligation and protein environment effects. J Am Chem Soc. 2002;124:5315–5324. doi: 10.1021/ja017479v. [DOI] [PubMed] [Google Scholar]
- 17.Clark WH. Oxidation and reduction potentials of organic systems. Williams and Wilkins Co; Baltimore: 1960. [Google Scholar]
- 18.Foote N, Thompson AC, Barber D, Greenwood C. Pseudomonas cytochrome c peroxidase. A purification procedure and study of CO-binding kinetics. Biochem J. 1983;209:701–709. doi: 10.1042/bj2090701. [DOI] [PMC free article] [PubMed] [Google Scholar]
- 19.Dequaire M, Limoges B, Moiroux J, Savéant J. Mediated electrochemistry of horseradish peroxidase. Catalysis and inhibition. J Am Chem Soc. 2001;124:240–253. doi: 10.1021/ja0170706. [DOI] [PubMed] [Google Scholar]
- 20.Jones AK, Lamle SE, Pershad HR, Vincent KA, Albracht SPJ, Armstrong FA. Enzyme Electrokinetics: Electrochemical studies of the anaerobic interconversions between active and inactive states of Allochromatium vinosum [NiFe]-hydrogenase. J Am Chem Soc. 2003;125:8505–8814. doi: 10.1021/ja035296y. [DOI] [PubMed] [Google Scholar]
- 21.Rönnberg M, Lambeir A, Ellfolk N, Dunford HB. Kinetics of cyanide binding by half-reduced Pseudomonas cytochrome c peroxidase. Biochim Biophys Acta. 1985;828:67–72. [Google Scholar]
- 22.Soininen R, Ellfolk N. Pseudomonas cytochrome c peroxidase V. Absorption spectra of the enzyme and of its compounds with ligands. Inhibition of the enzyme by cyanide and azide. Acta Chem Scand. 1973;27:35–46. doi: 10.3891/acta.chem.scand.27-0035. [DOI] [PubMed] [Google Scholar]
- 23.Lopes H, Pettigrew GW, Moura I, Moura JJG. Electrochemical study on cytochrome c peroxidase from Paracoccus denitrificans: a shifting pattern of structural and thermodynamic properties as the enzyme is activated. J Biol Inorg Chem. 1998;3:632–642. [Google Scholar]
- 24.Paes de Sousa PM, Pauleta SR, Simões Gonçalves ML, Pettigrew GW, Moura I, Correia dos Santos MM, Moura JJG. Mediates catalysis of Paracoccus pantotrophus cytochrome c peroxidase by P. pantotrophus pseudoazarin: kinetics of intermolecular electro transfer. J Biol Inorg Chem. 2007;12:691–698. doi: 10.1007/s00775-007-0219-9. [DOI] [PubMed] [Google Scholar]
- 25.Ye T, Kaur R, Wen X, Bren KL, Elliott SJ. Redox properties of wild-type and heme-binding loop mutants of bacterial cytochrome c peroxidase measured by direct electrochemistry. Inorg Chem. 2005;44:8999–9006. doi: 10.1021/ic051003l. [DOI] [PubMed] [Google Scholar]
- 26.Armstrong FA, Heering HA, Hirst J. Reactions of complex metalloproteins studied by protein-film voltammetry. Chem Soc Rev. 1997;26:169–179. [Google Scholar]
- 27.Aasa R, Ellfolk N, Rönnberg M, Vänngård T. Electron paramagnetic resonance studies of Pseudomonas cytochrome c peroxidase. Biochim Biophys Acta. 1981;670:170–175. doi: 10.1016/0005-2795(81)90005-2. [DOI] [PubMed] [Google Scholar]
- 28.Gimour R, Goodhew CF, Pettigrew GW, Prazeres S, Moura JJG, Moura I. The kinetics of the oxidation of cytochrome c by Paracoccus cytochrome c peroxidase. Biochem J. 1994;300:907–914. doi: 10.1042/bj3000907. [DOI] [PMC free article] [PubMed] [Google Scholar]
- 29.Timóteo CG, Tavares P, Goodhew CF, Duarte LC, Jumel K, Girio FMF, Harding S, Pettigrew GW, Moura I. Ca2+ and the bacterial peroxidases: the cytochrome c peroxidase from Pseudomonas stutzeri. J Biol Inorg Chem. 2003;8:29–37. doi: 10.1007/s00775-002-0382-y. [DOI] [PubMed] [Google Scholar]
- 30.Foote N, Peterson J, Gadsby P, Greenwood C, Thompson A. A study of the oxidized form of Pseudomonas aeruginosa cytochrome c-551 peroxidase with the use of magnetic circular dichroism. Biochem J. 1985;230:227–237. doi: 10.1042/bj2230369. [DOI] [PMC free article] [PubMed] [Google Scholar]
- 31.Soininen R, Kalkkinen N. Pseudomonas cytochrome c peroxidase. XIII pH-denaturation of the enzyme. Acta Chem Scand B. 1977;31:604–608. doi: 10.3891/acta.chem.scand.31b-0604. [DOI] [PubMed] [Google Scholar]
- 32.Ellfolk N, Rönnberg M, Soininen R. Pseudomonas cytochrome c peroxidase. VII Kinetics of the peroxidatic reaction mechanism. Acta Chem Scand. 1973;27:2171–2178. doi: 10.3891/acta.chem.scand.27-2171. [DOI] [PubMed] [Google Scholar]
- 33.Rönnberg M. Pseudomonas cytochrome c peroxidase. XII Product inhibition studies. Acta Chem Scand B. 1976;30:721–726. doi: 10.3891/acta.chem.scand.30b-0721. [DOI] [PubMed] [Google Scholar]
- 34.Rönnberg M, Ellfolk N. Pseudomonas cytochrome c peroxidase XI. Kinetics of the peroxidatic oxidation of Pseudomonas respiratory chain components. Acta Chem Scand B. 1975;29:719–727. doi: 10.3891/acta.chem.scand.29b-0719. [DOI] [PubMed] [Google Scholar]
- 35.Dunford HB. Heme peroxidases. Wiley-VCH; New York: 1999. [Google Scholar]
- 36.Zahn JA, Arciero DM, Hooper AB, Coats JR, DiSpirito AA. Cytochrome c peroxidase from Methylococcus capsulatus Bath. Arch Microbiol. 1997;168:362–372. doi: 10.1007/s002030050510. [DOI] [PubMed] [Google Scholar]
- 37.Léger C, Elliott SJ, Hoke KR, Jeuken LJC, Jones AK, Armstrong FA. Enzyme electrokinetics: Using protein film voltammetry to investigate redox enzymes and their mechanism. Biochemistry. 2003;42:8653–8662. doi: 10.1021/bi034789c. [DOI] [PubMed] [Google Scholar]
- 38.Elliott SJ, Léger C, Pershad HR, Hirst J, Heffron K, Ginet N, Blasco F, Rothery RA, Weiner JH, Armstrong FA. Detection and interpretation of redox optima in the catalytic activity of enzymes. Biochim Biophys Acta. 2002;1555:54–59. doi: 10.1016/s0005-2728(02)00254-2. [DOI] [PubMed] [Google Scholar]
- 39.Ye T, Kaur R, Senguen FA, Michel LV, Bren KL, Elliott SJ. Methionine Ligand Lability of Type I Cytochromes c: Detection of Ligand Loss Using Protein Film Voltammetry. J Am Chem Soc. 2008:6682–6683. doi: 10.1021/ja801071n. [DOI] [PMC free article] [PubMed] [Google Scholar]
- 40.Segel IH. Enzyme Kinetics: Behavior and Analysis of Rapid Equilibrium and Steady-State Enzyme Systems. John Wiley & Sons, Inc; 1975. [Google Scholar]
- 41.Léger C, Bertrand P. Direct Electrochemistry of redox enzymes as a tool for mechanistic studies. Chem Rev. 2008;108(7):2379–2438. doi: 10.1021/cr0680742. [DOI] [PubMed] [Google Scholar]


