Abstract
A transducer originally designed for Transesophageal Echocardiography (TEE) was adapted for real-time volumetric endoscopic imaging of the brain. The transducer consists of a 36 × 36 array with an interelement spacing of 0.18 mm. There are 504 transmitting and 252 receive channels placed in a regular pattern in the array. The operating frequency is 4.5 MHz with a −6 dB bandwidth of 30%. The transducer is fabricated on a 10 layer flexible circuit from MicroConnex (Snoqualmie, WA). The purpose of this study is to evaluate the clinical feasibility of real-time 3D intracranial ultrasound with this device. The Volumetrics Medical Imaging (Durham, NC) 3D scanner was used to obtain images in a canine model. A transcalvarial acoustic window was created under general anesthesia in the animal laboratory by placing a 10 mm burr hole in the high parietal calvarium of a 50 kg canine subject. The burr-hole was placed in a left para-sagittal location to avoid the sagittal sinus, and the transducer was placed against the intact dura mater for ultrasound imaging. Images of the lateral ventricles were produced, including real-time 3D guidance of a needle puncture of one ventricle. In a second canine subject, contrast (Optison™, Amersham Health, Inc., Princeton, NJ) enhanced 3D Doppler color flow images were made of the cerebral vessels including the complete Circle of Willis. Clinical applications may include real-time 3D guidance of cerebral spinal fluid extraction from the lateral ventricles and bedside evaluation of critically ill patients where CT and MR imaging techniques are unavailable.
Keywords: Real-Time 3D Imaging, 2D Array Transducer, Intraoperative Guidance
INTRODUCTION
In a recent study, we showed real-time 3D transcranial ultrasound scans with simultaneous transcranial axial, coronal and sagittal image planes and real-time volume rendered images of the gross anatomy of the brain in a human subject. In a transcranial sheep model we obtained real- time 3D color flow Doppler scans and perfusion images using bolus injection of contrast agents into the internal carotid artery (Smith et al. 2004).
There has been growing interest in the use of ultrasound for intraoperative surgical guidance of tumor resections in the brain (Commeau et al. 2000; Unsgaard et al. 2002a). By placing a burr hole in the calvarium, the transducer can rest directly upon the dura thereby eliminating the image-degrading artifacts seen on transcranial sonographic images. Without the intervening bone, image quality can be quite good (Unsgaard et al. 2002a). Additional improvement in image quality can be obtained through the use of intravascular contrast agents. It has been shown that cerebral tumors can be better identified and the borders more exactly located (Hansen et al. 2005). Better imaging would be expected to result in more complete tumor resection and less damage to adjacent healthy tissue. While magnetic resonance imaging (MRI) can also be adapted for surgical guidance (Black et al. 1997), it encumbers the costly MRI scanner, entails a restricted working space and requires special surgical tools that can be used within the MRI magnet.
While both of these approaches are promising, they require the alignment of a two-dimensional slice with the target tissue and fail to provide real-time 3D intra-operative guidance. MRI requires minutes to update the near real-time 2D slices into a 3D volume. Previous volumetric intracranial ultrasound approaches have also not been real-time (Unsgaard et al. 2002b). In addition, the conventional ultrasound procedures required a relatively large burr hole (3 cm diameter) to accommodate the transducer (Unsgaard et al. 2002a). The goal of this study was to develop an endoscopic transducer to facilitate real-time three dimensional ultrasound imaging of the brain via a 10 mm transcalvarial burr-hole and to demonstrate the ability to conduct imaging in an animal model.
METHODS
Volumetric Scanner
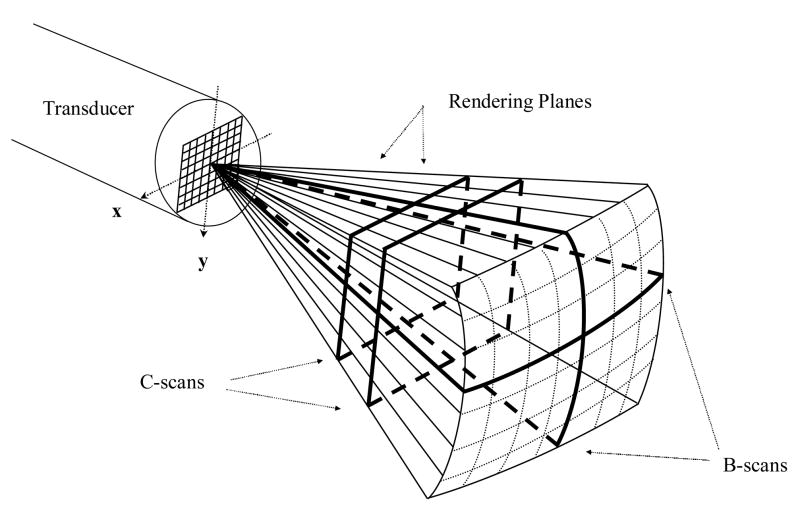
We have previously described our work in real-time three dimensional ultrasound imaging (Smith et al. 1991; von Ramm et al. 1991). We have modified the Duke/Volumetrics 3D scanner (Model 1, Volumetrics Medical Inc., Durham, NC) as the system platform for imaging with our transducers. The commercial Volumetrics Medical Imaging ultrasound scanner generates a real-time 3D pyramidal scan using as many as 512 transmitters and up to 256 receive channels. The scanner uses 16:1 receive mode parallel receive processing to generate 4100 B-mode image lines at up to 30 volumes per second. Figure 1 shows a schematic of B-mode display planes (perpendicular to the face of the transducer array) and two C-scan planes (parallel to the face of the transducer). Each image plane can also be inclined at any desired angle. By integrating and spatially filtering between two user-selected planes, e.g. the C-scan planes, the system also displays real-time 3D rendered images (Light et al. 2001; Light et al. 2005; Smith et al. 2002). The pyramid angle is typically set at 65 degrees, but we have modified the system to produce up to a 120 degree pyramidal scan for a larger field of view up close to the transducer (Lee et al. 2004). The scanner was also modified to allow for thicker B and C scans for better display of the arterial system in the brain. The plane thickness can be controlled independently so that either the two B-scans and/or the C-scan can be thickened up to 29 mm. This allows us to take advantage of the full volume of color flow Doppler data in the selected display planes.
Figure 1.
Schematic of the pyramidal scan from a 2D array transducer. Bold lines indicate possible display planes. By integrating and spatially filtering between two user-selected planes, real-time 3D rendered images are displayed.
Transducer Fabrication
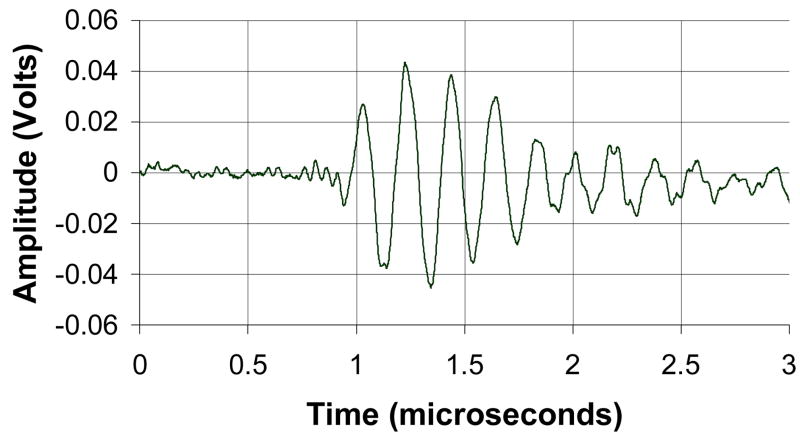
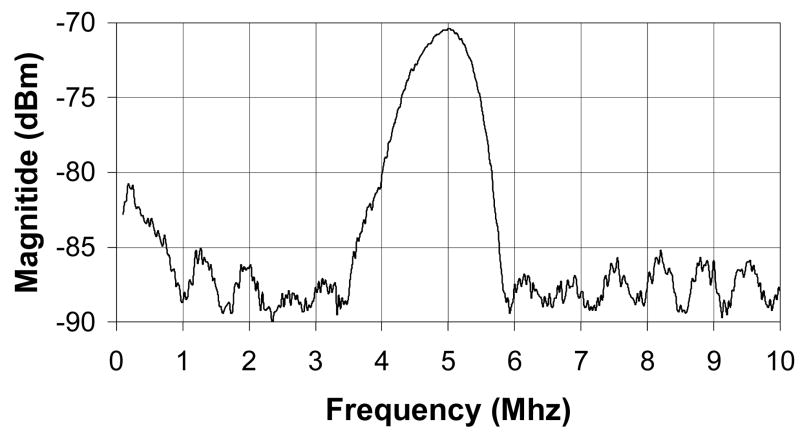
The matrix array transducer used in this study is a modified version of a TEE probe previously described (Pua et al.2004), which produces a −6 dB beamwidth of 3.4° yielding a lateral resolution of 3.0 mm at a 5 cm depth. The predicted noise clutter floor is −55 dB. The transducer is fabricated on a 10 layer flexible circuit from MicroConnex (Snoqualmie, WA) that consists of 252 receive channels and 504 transmitters. The elements are sparsely located in a periodic pattern (Brunke and Lockwood, 1997) The total aperture size is 6.48 × 6.48 mm. A 0.29 mm thick piece of PZT-5H (TRS Technologies, Inc., State College, PA) was bonded to the flex circuit with silver epoxy. The resulting frequency after dicing was 4.5 MHz. Figure 2A shows a photograph of the transducer on the flexible circuit after dicing. A layer of double-sided metallized liquid crystal polymer (LCP) was attached to the face of the transducer to protect it from the environment and provide a front electrical ground for the piezoelectric elements and overall electronic shielding. The flexible circuit was bent so that the transducer array was in a forward viewing configuration and an acoustic backing was attached. MicroFlat cables from W. L. Gore (Newark, DE) were soldered to the solder pads of the flex circuit and then to custom circuit boards fitted with Samtec (New Albany, IN) connectors (model # BSH-060-01-F-D-A) at the proximal end of the cables. These boards enable connection to the system handle that connects to the ultrasound scanner. The cables were placed in a lumen to protect them while the transducer is used. A second, 1.5 mm diameter lumen working port was attached to the side of the transducer to enable interventional devices to be guided into the brain. Figure 2B shows a photograph of the completed transducer with the working port and a 1.2 mm diameter needle (Brockenbrough, Daig Corporation, Minnetonka, MN) extending out of the working port. Figures 2C and 2D show a typical pulse and spectrum from the completed transducer. The center frequency is 4.5 MHz and the −6 dB fractional bandwidth is 30%. The measured Ispta was 0.114 W/cm2, well below the FDA limit of 0.72 W/cm2.
Figure 2.
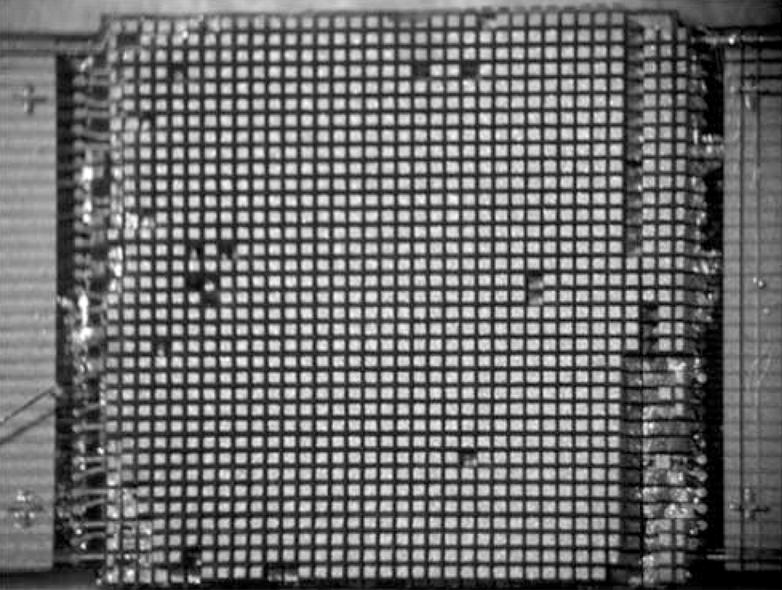
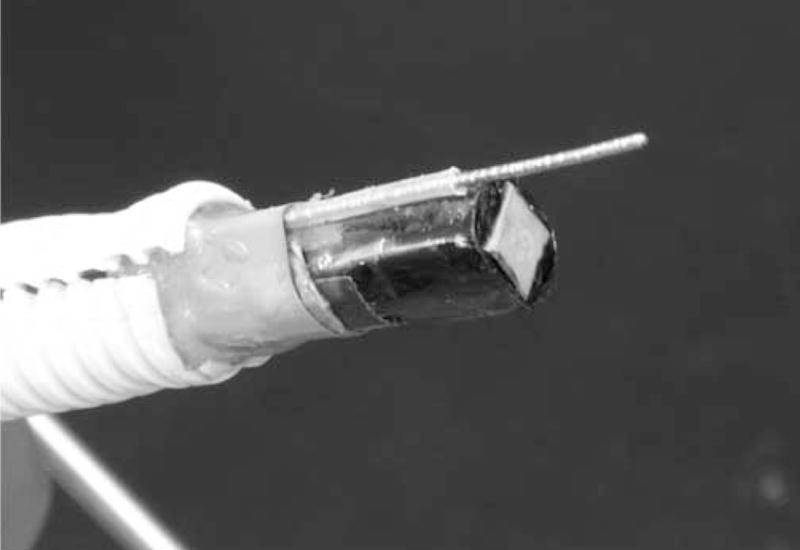
Transducer photos and typical pulse and spectrum from the transducer are shown. Figure 2A is a close up of diced 5 MHz matrix array transducer for intracrannial brain imaging. The total aperture size is 6.48 × 6.48 mm. Figure 2B is a photograph of completed matrix array transducer showing working port and a Brockenbrough needle coming out of the port. Figures 2C and 2D show typical pulse and spectrum from the transducer pictured in figure 2A and 2B. The center frequency is 4.5 MHz and the −6 dB fractional bandwidth is 30%.
Animal preparation
This study procedure was approved by the Institutional Animal Care and Use Committee at Duke University and conforms to the Research Animal Use Guidelines of the American Heart Association. Two canines were used, one for the needle guidance study and one for the 3D color Doppler study, each described below. In each study, an IV was established in a peripheral vein and the dog sedated with thiopental sodium, 20 mg/kg IV. Anesthesia induction was achieved with inhalation of isoflurane gas 1–5% delivered through a nose cone. The animal was intubated, placed on a water heated thermal pad and started on a ventilator. A femoral arterial line was placed via a percutaneous puncture or cutdown. Electrolyte and ventilator adjustments were made based on serial electrolyte and arterial blood gas measurements. An IV maintenance drip of D-5 Lactated Ringer’s solution was started and maintained at 5 ml/kg/min. Blood pressure, lead II electrocardiogram, and temperature were continuously monitored throughout the procedure. The animal was placed on its stomach for each study. A 10 mm burr hole was drilled into the para- left frontoparietal bone of the canine subject. Insonation through this window allowed interrogation of a pyramidal volume that extended ventrally to the central skull base.
Tissue Phantom Study
Images from an RMI Model 408 spherical lesion phantom (Middleton, WI) were acquired to evaluate the transducer before the animal studies. The phantom includes a pattern of 4 mm diameter spherical anechoic lesions, contrast = −35 dB.
Needle Guidance Study
The ventricles were initially identified on the gray-scale ultrasound scan prior to guidance of the needle. We modeled a needle puncture where a needle would be placed into lateral ventricle and cerebral spinal fluid removed. The needle was inserted through the 1.5 mm tool port attached to the transducer and monitored in the 3D ultrasound scan. The 3D scans were produced at a rate of 30 volumes per second.
3D color Doppler Study
In order to ensure that our imaging probe was properly aligned before enabling the real-time 3D color Doppler, major anatomical landmarks, such as the ventricles and cerebral arteries, were initially identified on the gray-scale ultrasound images. The cerebral arteries were identified by arterial pulsations in the images. A 0.5 mL dose of contrast (Optison™, Amersham Health Inc., Princeton, NJ) was administered through an IV, and followed by a flush of 0.9% sodium chloride. The 3D color Doppler images were produced at a rate of 18 volumes per second.
RESULTS
All images have a dynamic display range of 48 dB.
Images in tissue phantom
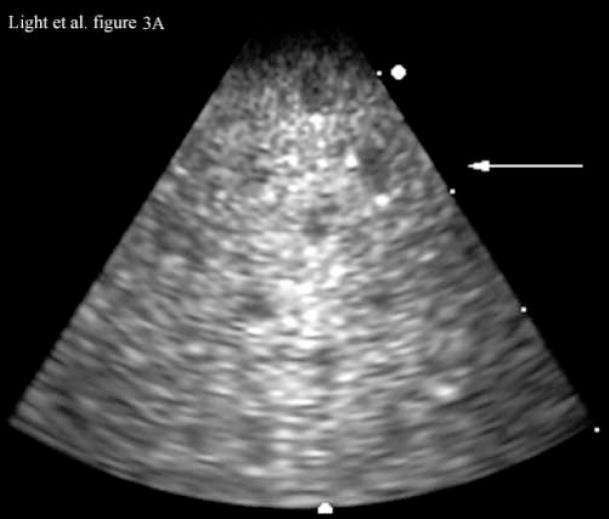
Figure 3 shows images of an RMI Model 408 spherical lesion phantom (Middleton, WI) made with our ultrasound endoscope. The images show a 4 cm deep 3D scan. Figure 3A shows a 4 cm deep B-scan and Figure 3B shows the corresponding simultaneous C-scan at the depth indicated by the arrow in the Figure 3A. In the images one can easily detect at least nine lesions in the B-scan and two lesions in the C-scan.
Figure 3.
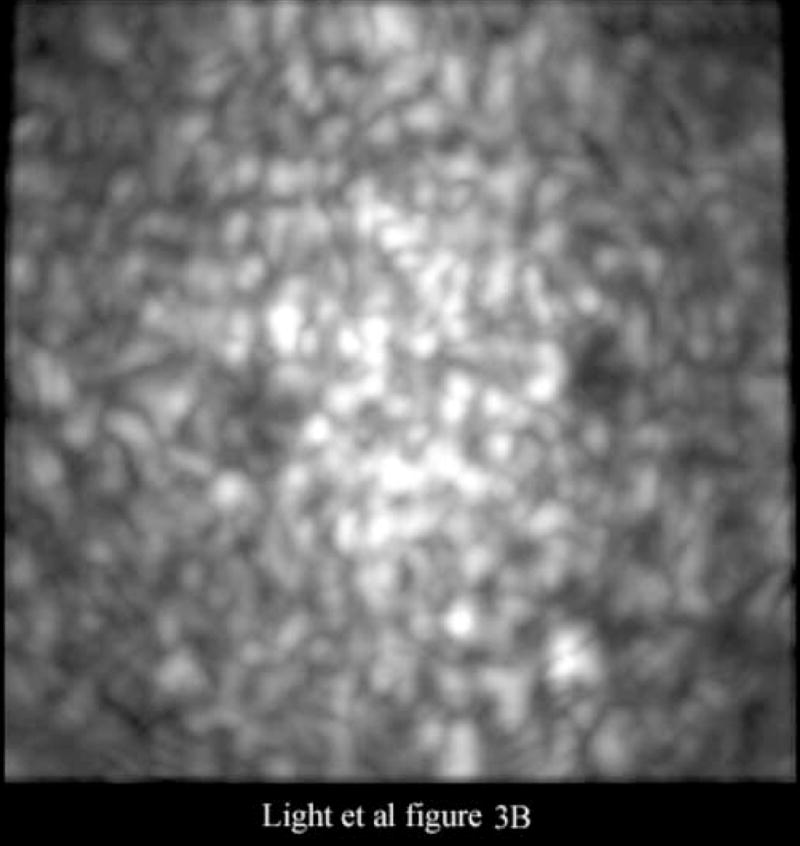
Figure 3A is a 4 cm deep B-scan, and Figure 3B is the corresponding real-time C-scan made at the plane indicated by the arrow. The lesions are 4 mm in diameter.
Interventional Procedure Guidance
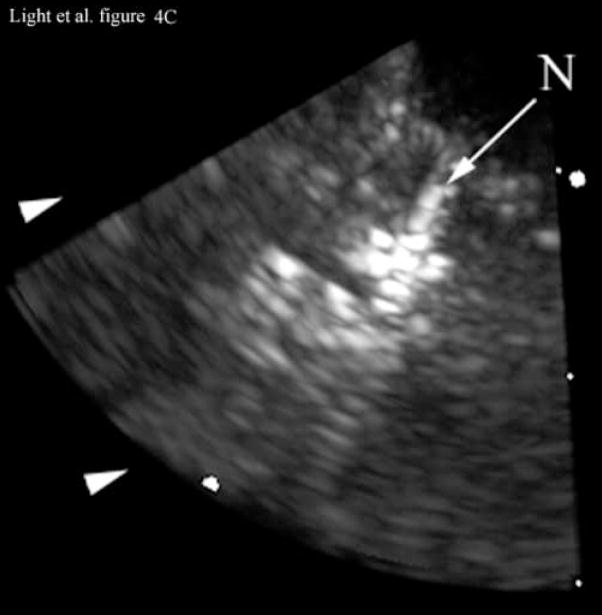
Figure 4 shows the results of 3D ultrasound guidance of a Brockenbrough needle into the lateral ventricle. Figure 4A shows a coronal anatomical slice through the brain (Fletcher). One of the lateral ventricles (LV), one of the cingulate sulcus (CS) and the falx (F) are labeled. Figures 4B and 4C show coronal image planes from the 3D scan which were rotated 29° to line up with the anatomical section. Each is a 3 cm deep, 65° B-scan obtained through a 10 mm burr hole drilled through the cranium. Figure 4B is a coronal slice before insertion of the needle. We can see the falx (F), two cingulated sulci (CS) and one of the lateral ventricles (LV). Figure 4C shows the coronal slice with the needle (N) inserted into the LV. The arrow heads represent the rendering planes for Figures 4G and 4H.
Figure 4.
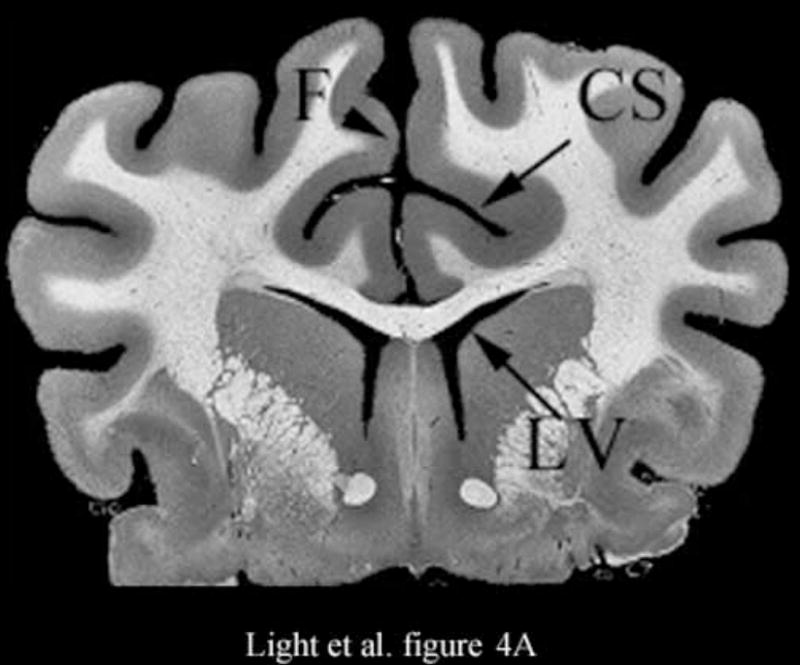
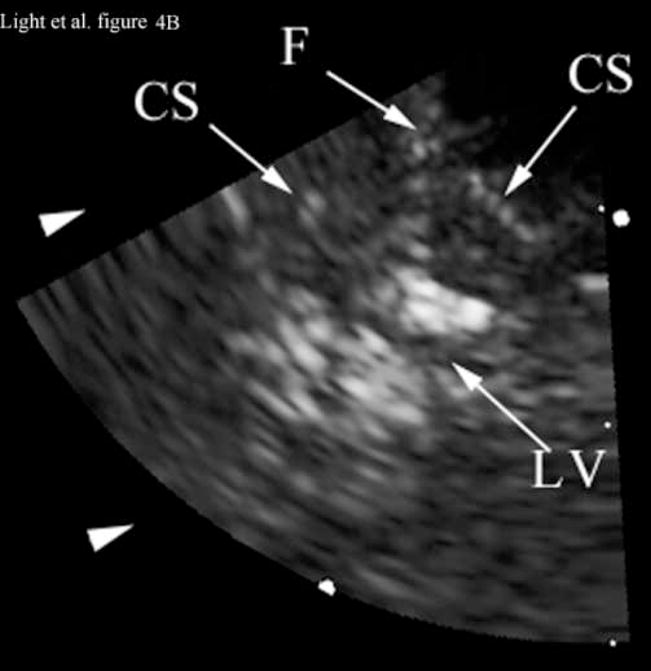
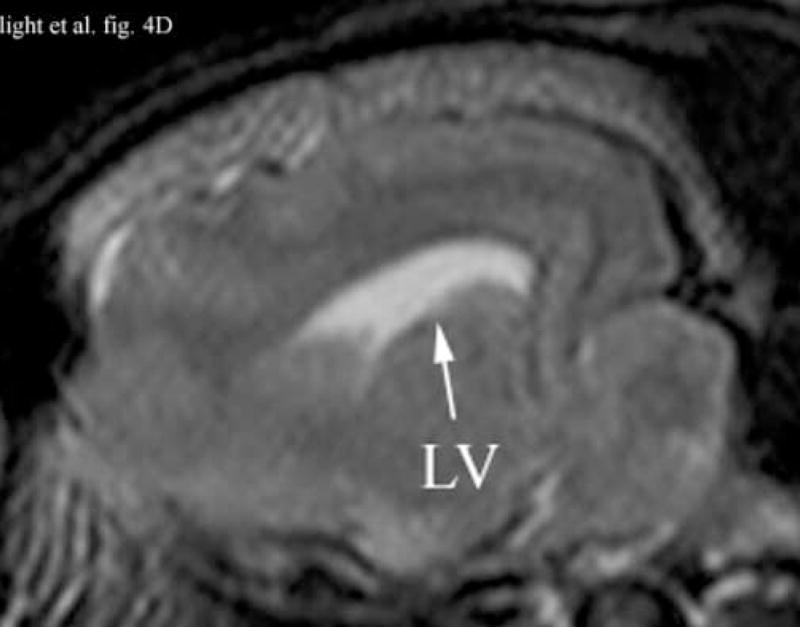
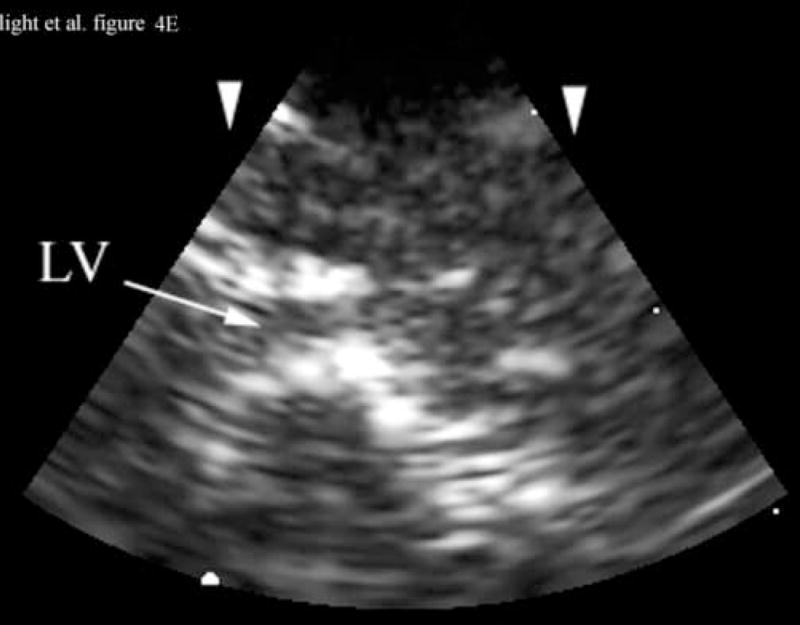
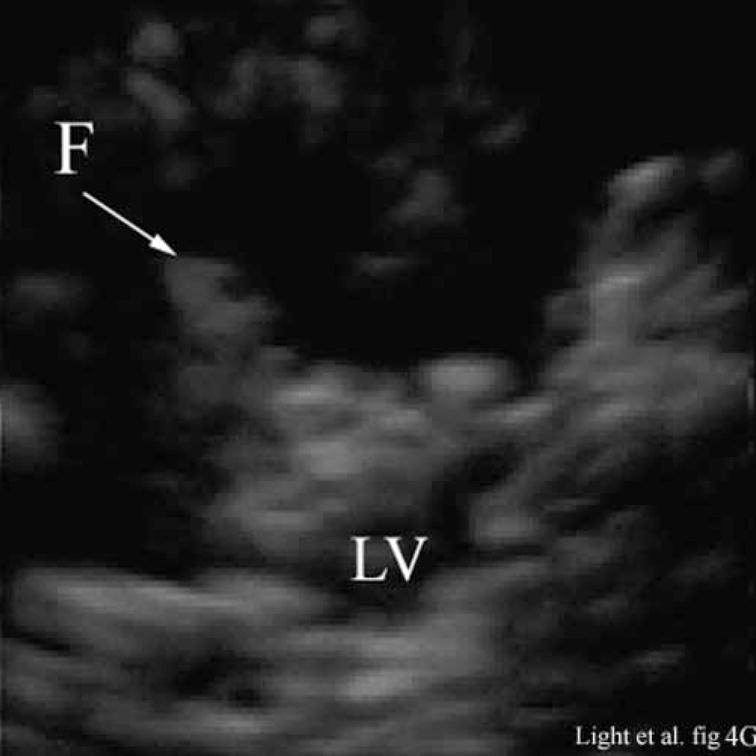
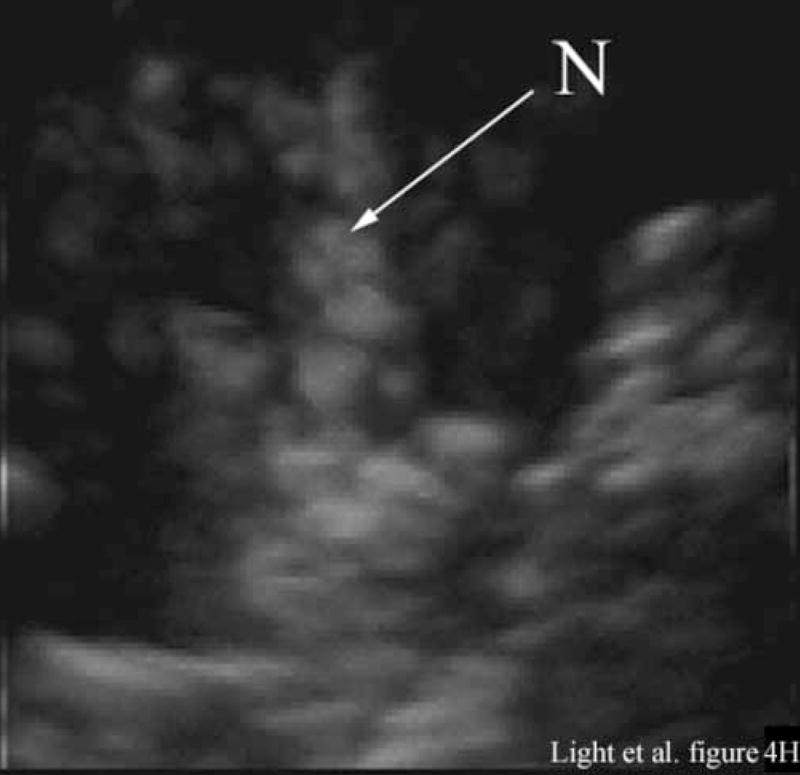
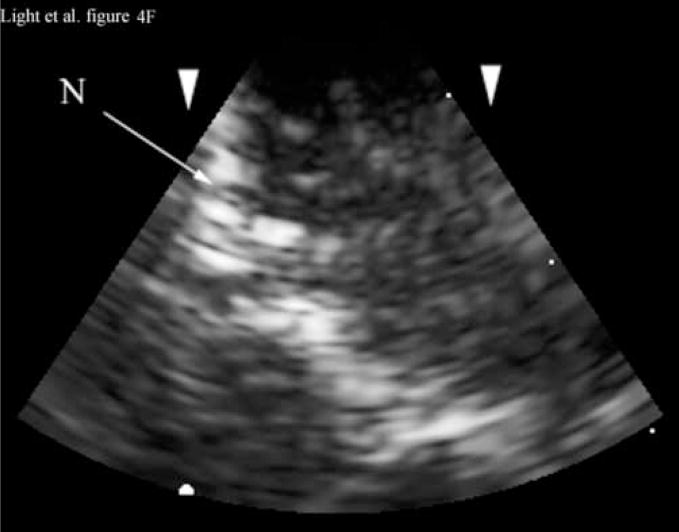
Figure 4A shows a coronal anatomical slice through the canine brain. The falx (F), cingulate sulcus (CS) and one of the lateral ventricles (LV) are labeled. Figure 4B shows a 3 cm deep B-mode image of the coronal plane also showing the Falx (F), cingulated sulcus (CS) and lateral ventricle (LV) prior to the LV being punctured by a needle. The needle (N) is viewed in Figure 4C after insertion. Figure 4D is an MRI of a para-sagittal plane through a lateral ventricle of a different canine brain. The lateral ventricle (LV) is white in the MRI image. Figure 4E shows the simultaneous orthogonal B-scan to Figure 4B. Again, we see the LV before the needle is inserted. Figure 4F shows the same B-scan plane with the needle (N) inserted into the LV. This plane was obtained simultaneously with Figure 4C and is orthogonal to Figure 4C. Figure 4G is the simultaneous real-time rendered view of the LV before the needle is inserted. We also see the Falx (F) in this image. Figure 4H, displayed simultaneously with Figure 4C and 4F, shows the needle (N) after being inserted into the LV.
Figure 4D shows an illustrative para-sagittal plane of another canine brain, a T2 weighted MRI showing the LV (in white). Figure 4E shows a 3 cm deep B-scan obtained simultaneously with Figure 4B that is the analogous para-sagittal slice also showing the LV. Figure 4F shows the same B-scan plane with the needle (N) inserted into the LV obtained simultaneously with and orthogonal to Figure 4C. The arrow heads represent the rendering planes for Figures 4G and 4H.
Figure 4G shows the real-time 3D rendered image of the canine brain before inserting the needle displayed simultaneously with Figures 4B and 4E. The image shows the Falx (F) and one of the lateral ventricles (LV). Figure 4H, displayed simultaneously with Figures 4C and 4F, shows the needle (N) after inserting it into the LV.
Contrast enhancement of the arteries
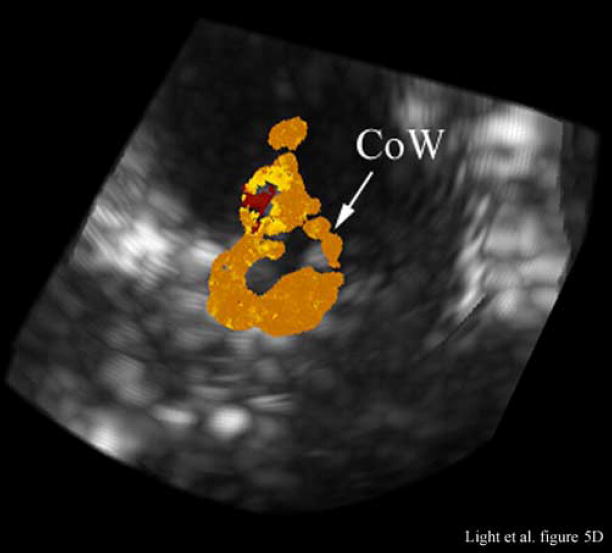
Figure 5 compares illustrative magnetic resonance angiography (MRA) images from a different animal with the contrast enhanced 3D color Doppler scans. The ultrasound color Doppler look up table has been modified to eliminate directional information because of aliasing. Figure 5A shows a para-sagittal MRA scan of the internal carotid artery (ICA) and the anterior cerebral artery (ACA). Figure 5B shows a 65° B-mode para sagittal plane that is 4 cm deep and 7.4 mm thick from the 3D scan. The green line indicates the plane of the simultaneous C-scan. One of the lateral ventricles (LV) as well as the base (B) of the skull is seen. Prior to the injection of contrast, we could not detect any color Doppler signal in the real-time 3D images. With the addition of Optison™, we can define the ICA and anterior cerebral artery (ACA) in good agreement with the MRA image.
Figure 5.
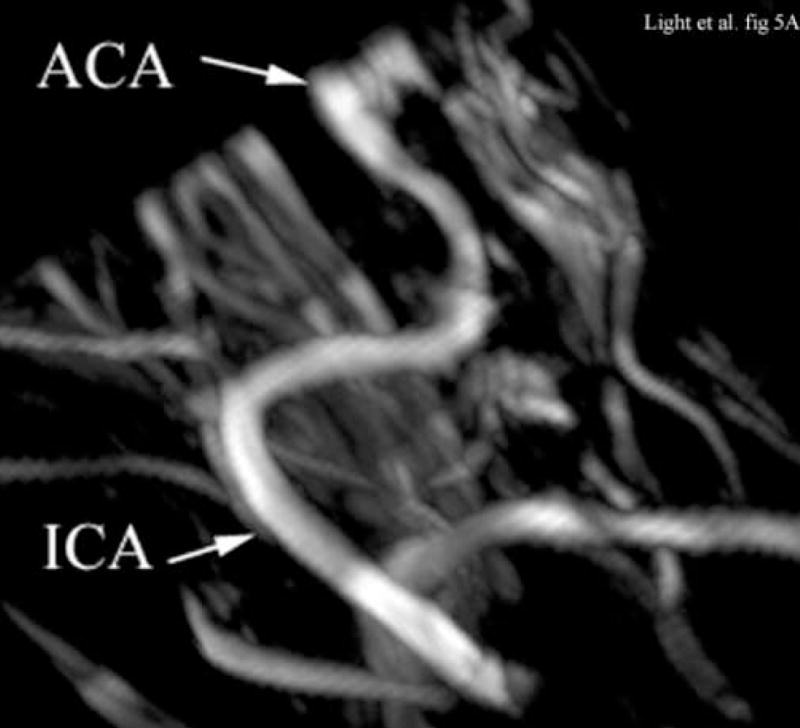
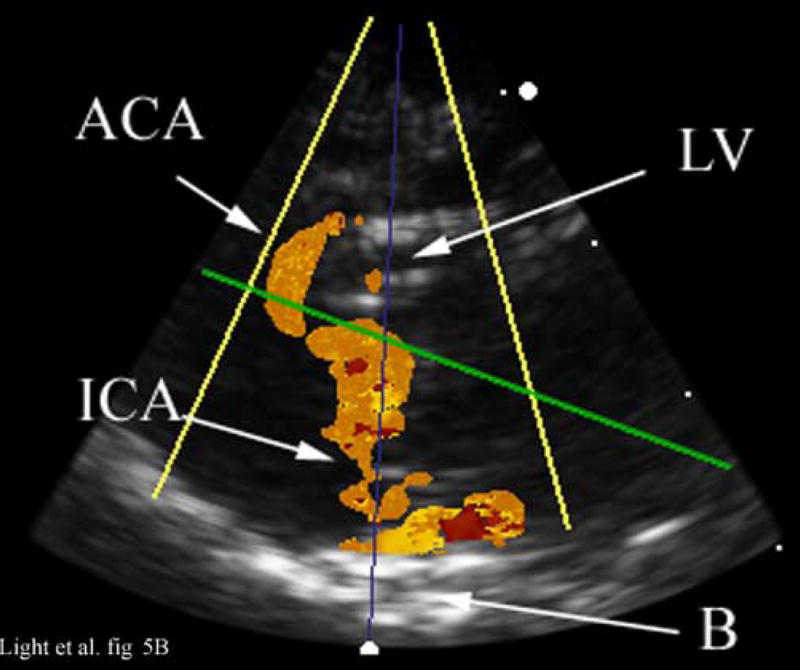
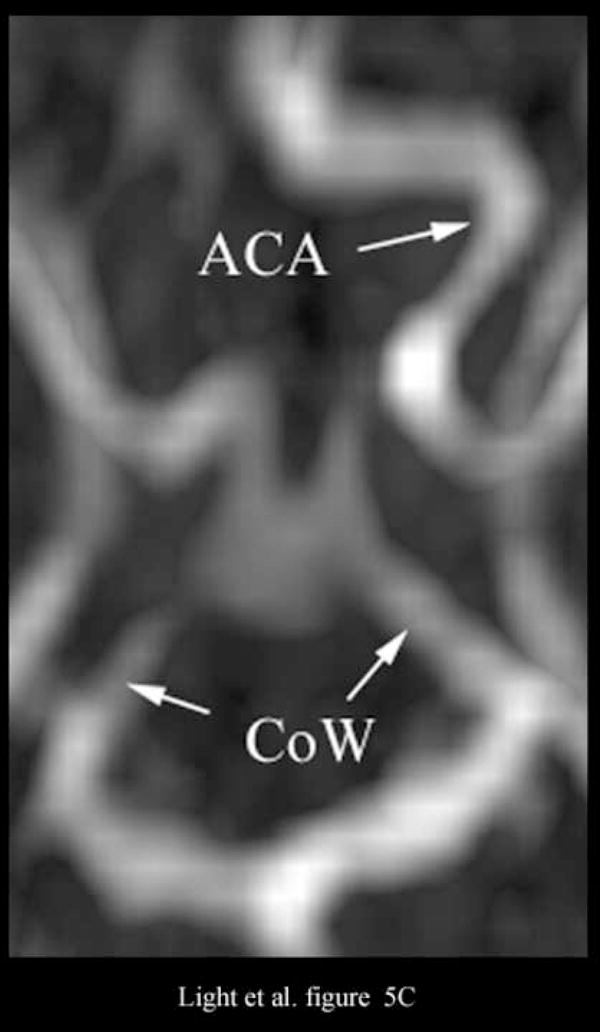
Figure 5A shows an illustrative MRA of the internal carotid artery (ICA) and anterior cerebral artery (ACA) from a different canine. The para-sagittal plane, Figure 5B, shows a 4 cm deep B-scan that is 7.4 mm thick. The contrast enhanced image shows the ICA, skull base (B), ACA and one of the LV’s. The Circle of Willis (CoW) with the ACA coming off is shown in the second MRA image (Figure 5C). The CoW is also seen in the axial plane of the simultaneous real-time C-scan (Figure 5D). This C-scan is 9.9 mm thick.
Figure 5C shows the Circle of Willis (CoW) and the ACA as it branches off in the MRA image. The Circle of Willis (CoW) is also visible in the corresponding real-time C-scan axial plane (Figure 5D). This C-scan is 9.9 mm thick and has been rotated to match the MRA image (Figure 5C).
SUMMARY AND DISCUSSION
We successfully adapted our TEE transducer design for real-time volumetric endoscopic imaging of the brain. By creating a transcalvarial acoustic window, we were able to image the lateral ventricles, including real-time 3D guidance of a needle puncture of one ventricle in one canine subject. In a second canine subject, contrast (Optison™) enhanced 3D Doppler color flow images were made of the cerebral vessels including the complete Circle of Willis. Potential clinical applications include real-time 3D guidance of cerebral spinal fluid extraction from the lateral ventricles, guidance of therapeutic drug delivery, guidance of tumor resection, delivery of ultrasound energy for heating and bedside evaluation of critically ill patients where CT and MR imaging techniques are unavailable.
The preliminary images are encouraging. We were clearly able to see the Brockenbrough needle and watch it enter the lateral ventricle (Figure 4). Guidance through the working port was not difficult and the ventricle was punctured on the first attempt. However, there is room for image improvement. The small footprint of the transducer that is so desirable for minimizing the hole in the cranium is degrading our image quality compared to larger arrays. Also, this is a prototype transducer with only 63% (316 out of 504) working elements. Such a low yield degrades image quality in terms of signal to noise ratio (SNR) and image contrast. The low yield is due in part to the bending of the flex circuit. To try to minimize the footprint of the transducer, the flex circuit has two 90 degree bends, each with a small radius of curvature. We believe this bending is a major contributor to low element yield. Also, while few elements were lost during the dicing, there are losses during the soldering and handling of the MicroFlat cables. More experience handling this large number of cables should reduce these types of losses, and increase the yield. A new, custom designed flex circuit, or a different manufacturing technique, should solve the losses due to bending.
Figure 5 shows some of the same issues. We cannot detect cerebral blood flow without contrast. Our poor SNR makes it difficult to see the vessels in the 3D echo scan except while they are pulsating. However, with the introduction of the Optison™, we do see flow. We see typical ‘blooming’ that others have reported (Holscher et al. 2001).
There are several areas for improvement, including acoustic matching layers or new transducer materials to improve our 30% fractional bandwidth. A transducer with 100% yield would also increase our SNR and improve the image quality.
We have previously reported transducers operating at 7 and 10 MHz (Light et al. 2004; Light et al. 2005). While the imaging system would also need improvement, increasing the frequency would improve the resolution of the images, at the price of reducing our penetration. The images in a canine are not very deep, we only needed 3 cm for guiding the needle to the ventricle. The 4 cm deep scans show us the base of the skull. In a human, this may be greater, so we will need a series of transducers to pick the optimum trade off between depth and resolution. We have demonstrated the proof of concept for these type of transducers. The transducer technology described in this paper is currently available to the ultrasound system manufacturers. There is nothing to prevent this technology from becoming practical future devices.
Despite the current short comings, access to a real-time 3D imaging capability can overcome the orientation liability of 2D guidance (Unsgaard et al. 2002a), and hopefully provide a more intuitive image format for the surgeon. In a canine subject, the real-time 3D scans produced simultaneous intracranial axial, coronal and sagittal image planes of the brain, as well as any desired oblique views and real-time volume rendered images within the 3D pyramid. Guidance of a Brockenbrough needle puncture into the lateral ventricle was shown. In a second canine subject, contrast enhanced real-time 3D color flow was demonstrated as a precursor to contrast enhanced perfusion imaging of cerebral tumors.
Supplementary Material
Acknowledgments
This research was supported by NIH grants HL 72840 and HL 64962 and NSF grant DMR-0313764. The authors thank E. Dixon-Tulloch for assistance with the animal experiment. The authors also acknowledge Prof. Don Thrall (D.V.M., Ph.D.), Prof of Radiology NCSU School of Veterinary Medicine for providing the MRI and MRA canine images.
Footnotes
Publisher's Disclaimer: This is a PDF file of an unedited manuscript that has been accepted for publication. As a service to our customers we are providing this early version of the manuscript. The manuscript will undergo copyediting, typesetting, and review of the resulting proof before it is published in its final citable form. Please note that during the production process errors may be discovered which could affect the content, and all legal disclaimers that apply to the journal pertain.
References
- Black PMcL, Moriarty T, Alexander E, III, et al. Development and implementation of intraoperative magnetic resonance imaging. Neurosurgery. 1997;41:831–845. doi: 10.1097/00006123-199710000-00013. [DOI] [PubMed] [Google Scholar]
- Brunke SS, Lockwood GR. Broad-bandwidth radiation patterns of sparse two-dimensional vernier arrays. IEEE Trans Ultrason Ferro and Freq Control. 1997;44:1101–1109. [Google Scholar]
- Commeau RM, Sadikot AF, Fenster A, Peters TM. Intraoperative ultrasound for guidance and tissue shift correction in image-guided neurosurgery. Medical Physics. 2000;27:787–800. doi: 10.1118/1.598942. [DOI] [PubMed] [Google Scholar]
- Fletcher TF. Canine brain atlas. http://vanat.cvm.umn.edu:16080/brainsect/index.html.
- Hansen C, Wilkening W, Ermert H. Intraoperative contrast enhanced perfusion imaging of cerebral tumors. Proceedings IEEE Trans Ultrason Symp. 2005:743–746. [Google Scholar]
- Holscher T, Schlachetzki F, Bauer A, et al. Echo enhanced transcranial color-coded US: clinical usefulness of intravenous versus bolus injection of SH U 508A. Radiology. 2001;219:823–827. doi: 10.1148/radiology.219.3.r01jn16823. [DOI] [PubMed] [Google Scholar]
- Holscher T, Wilkening WG, Lyden PD, Mattrey RF. Transcranial ultrasound angiograpgy (tUSA): a new approach for contrast specific imaging of intracranial arteries. Ultrasound in Med & Biol. 2005;31:1001–1006. doi: 10.1016/j.ultrasmedbio.2005.04.014. [DOI] [PubMed] [Google Scholar]
- Jensen JA, Svendsen NB. Calculation of pressure fields from arbitrarily shaped, apodized, and excited ultrasound transducers. IEEE Trans Ultrason Ferro and Freq Control. 199;39:262–267. doi: 10.1109/58.139123. [DOI] [PubMed] [Google Scholar]
- Lee W, Idriss SF, Wolf PD, Smith SW. A miniaturized catheter 2-D array for real-time 3D intracardiac echocardiography. IEEE Trans Ultras Ferro And Freq Control. 2004;51:1334–1346. doi: 10.1109/tuffc.2004.1350962. [DOI] [PubMed] [Google Scholar]
- Light ED, Idriss SF, Wolf PD, Smith SW. Real time three dimensional intracardiac echocardiography. Ultrasound in Med & Biol. 2001;27:1177–1183. doi: 10.1016/s0301-5629(01)00421-5. [DOI] [PubMed] [Google Scholar]
- Light ED, Smith SW. Two dimensional arrays for real time 3D Intravascular Ultrasound. Ultrasonic Imaging. 2004;26:115–128. doi: 10.1177/016173460402600204. [DOI] [PubMed] [Google Scholar]
- Light ED, Idriss SF, Sullivan KF, Wolf PD, Smith SW. Real-Time 3D Ultrasonic Laparoscopy. Ultrasonic Imaging. 2005;27:89–100. doi: 10.1177/016173460502700301. [DOI] [PubMed] [Google Scholar]
- Pua EC, Idriss SF, Wolf PD, Smith SW. Real-time 3D transesophageal echocardiography. Ultrasonic Imaging. 2004;26:217–232. doi: 10.1177/016173460402600402. [DOI] [PubMed] [Google Scholar]
- Smith SW, Pavy HE, von Ramm OT. High speed ultrasound volumetric imaging system part I: transducer design and beam steering. IEEE Trans Ultras, Ferro and Freq Control. 1991;38:100–108. doi: 10.1109/58.68466. [DOI] [PubMed] [Google Scholar]
- Smith SW, Light ED, Idriss SF, Wolf PD. Feasibility study of real time three dimensional intracardiac echocardiography for guidance of interventional electrophysiology. Pacing and Clinical Electrophysiology. 2002;25:351–357. doi: 10.1046/j.1460-9592.2002.00351.x. [DOI] [PubMed] [Google Scholar]
- Smith SW, Chu K, Idris SF, et al. Feasibility Study: real time 3D ultrasound imaging of the brain. Ultrasound in Med & Biol. 2004;30:1365–1371. doi: 10.1016/j.ultrasmedbio.2004.08.012. [DOI] [PubMed] [Google Scholar]
- Unsgaard G, Gronningsaeter A, Ommedal S, Hernes TAN. Brain operations guided by real-time two-dimensional ultrasound: new possibilities as a result of improved image quality. Neurosurgery. 2002;51:402–412. [PubMed] [Google Scholar]
- Unsgaard G, Ommedal S, Muller T, et al. Neuronavigation by intraoperative three-dimensional ultrasound: initial experience during brain tumor resection. Neurosurgery. 2002;50:804–812. doi: 10.1097/00006123-200204000-00022. [DOI] [PubMed] [Google Scholar]
- von Ramm OT, Smith SW, Pavy HE. High speed ultrasound volumetric imaging system part II: parallel processing and display. IEEE Trans Ultras, Ferro and Freq Control. 1991;38:109–115. doi: 10.1109/58.68467. [DOI] [PubMed] [Google Scholar]
Associated Data
This section collects any data citations, data availability statements, or supplementary materials included in this article.


