

Abstract
The purpose of this study was to develop a method to measure brain and white matter hyperintensity (leukoaraiosis) volume that is based on the segmentation of the intensity histogram of fluid attenuated inversion recovery (FLAIR) images, and to assess the accuracy and reproducibility of the method. Whole head synthetic image phantoms with manually introduced leukoaraiosis lesions of varying severity were constructed. These synthetic image phantom sets incorporated image contrast and anatomic features which mimicked leukoaraiosis found in real life. One set of synthetic image phantoms was used to develop the segmentation algorithm (FLAIR-histoseg). A second set was used to measure its accuracy. Test re-test reproducibility was assessed in 10 elderly volunteers who were imaged twice. The mean absolute error of the FLAIR-histoseg method for measurement of leukoaraiosis volume was 6.6% and for brain volume 1.4%. The mean test re-test coefficient of variation for leukoaraiosis volume was 1.4% and for brain volume was 0.3%. We conclude that the FLAIR-histoseg method is an accurate and reproducible method for measuring leukoaraiosis and whole brain volume in elderly subjects.
Index Terms: quantitative MRI, pulse sequences, segmentation, white matter disease, dementia
INTRODUCTION
White matter hyperintensity (leukoaraiosis) on MRI in elderly persons is suspected to be a direct manifestation of microvascular ischemic injury in the distribution of the penetrating arteriolar vessels(1–7). The main risk factors for leukoaraiosis are advanced age and hypertension(8, 9). A number of clinical studies have linked leukoaraiosis with cognitive impairment in the elderly(10–13). Most clinical research studies have employed semi-quantitative methods of viewer ranking to assess the volumetric burden of leukoaraiosis(14–16). While qualitative methods have advantages in a multi-site study design, a method for actual measurement of the volumetric burden of leukoaraiosis should be more accurate and reproducible and therefore useful for clinical research in aging and dementia.
A long TE/TI/TR Fluid Attenuated Inversion Recovery (FLAIR) image is essentially a T2-weighted image with the signal of CSF nulled, resulting in an image in which typical brain pathology appears as the brightest intracranial tissue type(17, 18). These contrast properties may be ideal for automated segmentation and classification of leukoaraiosis. The intracranial contents of an elderly person with leukoaraiosis can be conceptually divided into three major tissue classes, each of which occupy distinct regions of the intensity histogram of a FLAIR image. In order of decreasing signal intensity these are lesion, brain, and cerebral spinal fluid (CSF). Although segmentation of brain tissues using multi-spectral classifiers is a common approach, the markedly different signal intensity characteristics of each of these three intracranial tissue types on FLAIR images raised the possibility that accurate tissue volume measurements based on segmentation of the intensity histogram of FLAIR images alone might be feasible.
The objectives of this work were 1) to develop a realistic set of synthetic phantom images of leukoaraiosis in which the true lesion and brain volume were known, 2) to develop an automated method for measuring the volume of leukoaraiosis and brain by segmentation of the histogram of FLAIR images, 3) to assess the accuracy of the measurement method, and 4) to assess the reproducibility of the method.
METHODS
Subjects
The imaging data used in the four phases of this project was derived from four different groups of elderly volunteer subjects from the Alzheimer’s Disease Patient Registry/Alzheimer’s Disease Research Center (ADPR/ADRC) at the Mayo Clinic. These were:
Measurements of leukoaraiosis signal intensity properties on FLAIR images, n = 10 subjects.
Construction of synthetic image phantoms used to develop the segmentation algorithm, n = 10 subjects.
Construction of synthetic image phantoms used to measure the accuracy of the segmentation algorithm, n = 9 subjects.
Measurement of test re-test reproducibility of the method, n = 10 subjects.
Intensity Measurements Used to Construct Synthetic Image Phantoms
We use the term “synthetic phantom images” to denote images in which leukoaraiosis lesions are added to real MR images that were acquired in volunteers. The volume of the deliberately introduced leukoaraiosis lesions was precisely known and this served as a gold standard for developing and then testing our volume measurement algorithm. Our synthetic phantom images were designed to incorporate the following desirable features: 1) The contrast properties of the images, including the relative signal intensity and noise properties of the synthetic leukoaraiosis lesions, were identical to those encountered in FLAIR images of elderly subjects in real-life. 2) The anatomic distribution of leukoaraiosis matched that found in elderly persons in real-life. 3) The lesion volumes were known and could serve as an objective standard of the “truth”.
In order to generate realistic leukoaraiosis lesions we first had to identify the grey scale signal intensity properties of leukoaraiosis lesions found on FLAIR images of the elderly in real life. We identified ten individuals from the ADRC/ADPR with varying amounts of leukoaraiosis. All these volunteers had undergone a standardized protocol MR study which included the following FLAIR sequence: TR=11 sec, TI=2600 msec, TE=142 msec, bandwidth ± 32 kHz, echo train length 22, 256 × 192 matrix, 24 cm FOV, 3 mm interleaved slices with no interslice gap. Measurements of the signal intensity and standard deviation of white matter, CSF, and leukoaraiosis lesion were performed at 10 different sample sites throughout the brain for each of the 10 elderly volunteers. Thus, a total of 100 samples were averaged to form an overall mean value for each tissue type.
Synthetic Image Phantom Design
A second set of 10 subjects, whose FLAIR images were used to make the synthetic phantom images, was identified from the ADRC/ADPR. The subjects whose FLAIR images served as the base for our synthetic image phantoms had little or no leukoaraiosis (vs the 10 subjects described in the previous section who did have leukoaraoisis and whose FLAIR studies were used to measure contrast properties of leukoaraoisis in vivo). In order to create synthetic images that had realistic spatial distributions of leukoaraiosis−like lesions, regions of interest (ROI) mimicking the anatomic distribution of leukoaraiosis were hand drawn on the appropriate slices of the FLAIR images by a neuroradiologist (YX). Three different binary masks of leukoaraiosis were manually drawn on the multi-slice FLAIR image dataset of each subject with different volumes of lesion severity, which we labeled mild, moderate, and severe. The binary ROI files of leukoaraiosis were added to the original grey scale images. The intensity of the non-zero pixels in the binary ROI files was set to 1000. This enabled the “lesion creating” program, described in the next section, to automatically identify each manually introduced lesion on the basis of intensity alone. By adding the synthetic lesions to scans with little or no pre-existing leukoaraiosis, we knew the volume of lesions. The volume of leukoaraoisis in the phantoms was used as the “truth” when developing and testing our measurement algorithm.
A "lesion-creating" program was written by one of us (RM) which converted the hand drawn binary ROIs into ROIs which contained the empirically determined relative signal intensity and noise distribution characteristics of leukoaraiosis for FLAIR images. The program tapered the borders of the ROIs so that the signal intensity of the synthetic leukoaraiosis lesions declined linearly from the binary hand-drawn ROIs to background tissue. The result was three sets of synthetic whole brain image sets (with mild, moderate, and severe lesion severity) for each subject.
Although not a primary motivation for developing the FLAIR histogram segmentation method, we also wished to validate the ability of the algorithm to measure total brain volume. To accomplish this, an independent measure of brain volume had to be available for each phantom image set. In addition to the FLAIR, a fast spin echo pulse sequence was acquired with slice location and image geometry parameters identical to the FLAIR in each subject as part of the ADPR/ADRC imaging protocol. Parameters were TE = 102 msec, TR=4000 msec, echo train length 8, bandwidth ±16 kHz, and matrix of 256 × 256. A neuroradiologist (YX) measured the volume of the brain using a supervised auto-tracing algorithm on these images and this served as the "gold standard" definition of brain volume(19).
Algorithm Theory and Design
The FLAIR histogram segmentation (FLAIR-histoseg) method can be divided into the following operations: 1) image preprocessing, 2) segmentation and classification, 3) final editing. Several standard image-preprocessing steps are performed in order to reduce artifacts and improve the quality of the data prior to image segmentation and classification. In order these are, 1) manual editing of the image to remove skull, scalp, and flow related artifacts, 2) 2D RF inhomogeneity correction by a mean filter (20), (through-plane inhomogeneity is corrected not during pre-processing, but by the segmentation algorithm itself which automatically finds the mode value of normal brain uniquely for each imaging slice), 3) surface erosion with a 3 × 3 structure element which will be discussed later, and 4) anisotropic filtering to reduce image noise while preserving edge contrast (21).
Following the preprocessing above, the histogram of a typical FLAIR image contains a single central peak that corresponds to normal brain pixels (Fig. 1). Leukoaraiosis lesion occupies the right-hand tail, and CSF and other background pixels occupy the left-hand tail. A fully automated statistically based method to segment this histogram into regions which are classified as lesion, CSF, and normal brain was derived (Figure 1).
Figure 1. FLAIR Histogram.

Line drawing of the intensity histogram of a FLAIR image after the skull/scalp has been stripped away. The large central peak that makes up the bulk of the histogram is composed entirely of brain pixels. M refers to the mode value in the histogram. P is a horizontal line placed at one-third the height of the mode value. The values XL and XU represent the lower and upper points at which line P intersects the intensity histogram. The statistical properties of the central brain peak between XL and XU are used as independent variables in regression equations that are used to define values TL and TU, which are used to segment the histogram into three domains. Pixels to the left of TL are assigned to CSF; pixels between TL and TU are assigned to brain; and, pixels to the right of TU are assigned to leukoaraiosis lesion.
The segmentation portion of the algorithm contains the following steps: i) The mode value in the histogram is identified. Prior to determining the mode value of each slice, the histogram was smoothed using a moving average of three adjacent bins in order to improve the stability of mode determination. ii) A horizontal cut point (labeled P in Figure 1) is established at 1/3 of the height of the mode value. The cutoff value of 1/3 the height of the mode (P in Fig. 1) was determined empirically to be a value that always resulted in inclusion of only normal brain pixels in the central portion of the histogram that was used for statistical analysis. The intensities at which the horizontal cutoff value (P) intersects the histogram are denoted as XL and XU. The pixels in the intensity histogram which lie in the interval XL and XU define a central region of the histogram that will always represent normal brain tissue. iii) The statistical properties of this central region of the histogram are characterized by five standard parameters—mean, skewness, standard deviation, kurtosis, and the total number of pixels in this region of the histogram. The statistical parameters above and the values XL and XU are now used as independent variables in regression equations that are used to determine the threshold values TL and TU (See Appendix). Pixels with intensity values greater than TU are classified as lesion, less than TL as CSF, and between TL and TU as normal brain (Fig. 2). The values TL and TU are established uniquely for each imaging slice. Thus, this approach is able to accommodate slice to slice variation in statistical properties of the intensity histogram when determining the values (TL and TU) which are used to segment the histogram.
Figure 2. FLAIR-Histoseg.
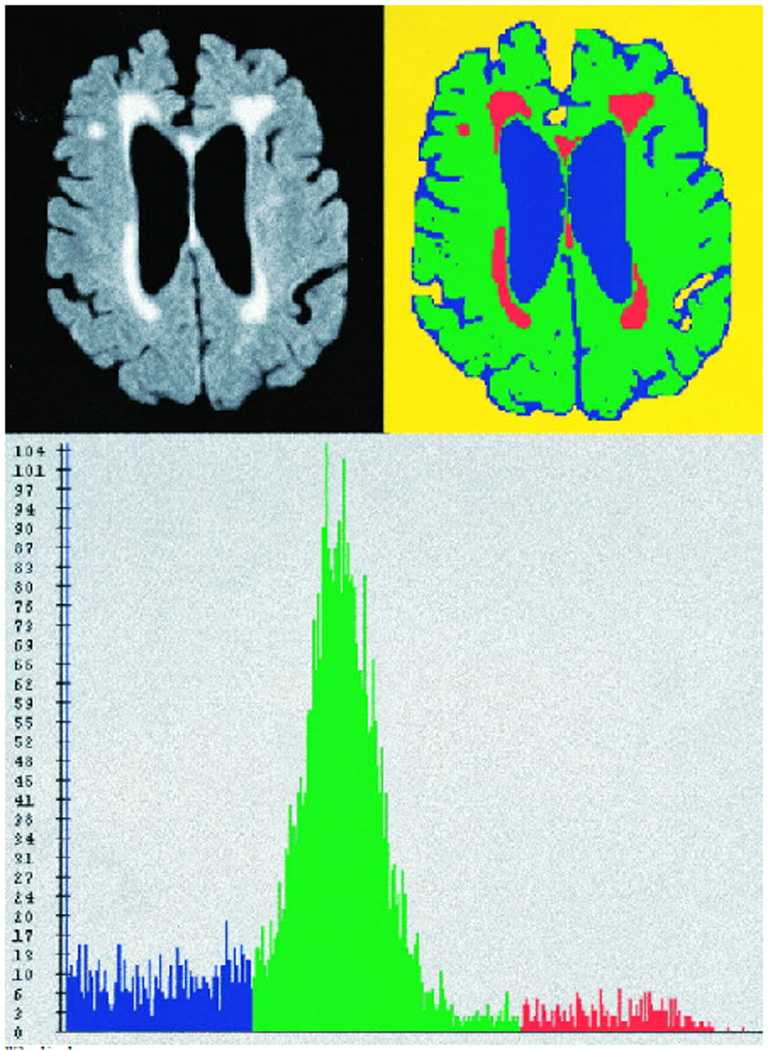
Top left panel represents a FLAIR image from a “moderate” synthetic phantom. Top right panel demonstrates the results of the FLAIR-histoseg method. Bottom panel represents the actual histogram of the FLAIR image after the skull and scalp has been removed. Pixels classified as normal brain are assigned the color green, leukoaraiosis lesion is red, and CSF is blue.
The signal intensity of allocortex tends to be higher than that of isocortex on FLAIR images (22). Some limbic cortical areas typically have signal intensity that overlaps the intensity range occupied by leukoaraiosis. Areas in the posterior limb of the internal capsule may normally appear bright on FLAIR images as well (23). Central grey nuclei in which dense physiologic mineral deposition has occurred overlap the intensity range of CSF. The classification of these incorrectly classified pixels was manually changed from CSF to brain prior to recording leukoaraiosis and brain volumes.
In order to derive the equations that most accurately predict TL and TU from the central portion of FLAIR histogram, image data was required that realistically portrayed the appearance of leukoaraiosis on FLAIR images but for which the true volumes were known. Synthetic phantom image datasets (corresponding to mild, moderate, and severe leukoaraiosis burden) from the FLAIR images of 10 normal elderly volunteers described earlier were used for this purpose. Subjects were selected who had only a minimal amount of leukoaraiosis present so as not to interfere with generating synthetic leukoaraiosis lesions. The correct TL and TU values for each image slice of each phantom were deduced using the known values of leukoaraiosis and brain volume of each phantom dataset. We then modeled TL and TU as dependent variables using the statistical parameters in the brain histogram of each slice of each of the phantom datasets as independent predictor variables. Stepwise regression was used, stepping up, with p <0.05 as the criteria for entry into the model. The possibility for non-linear associations and interactions were evaluated. The final equations are given in the Appendix.
Assessment of Algorithm Accuracy
When developing the segmentation algorithm, the values of TL and TU were known for each of the phantom datasets and the statistical parameters from the FLAIR histograms were treated as dependent variables in regression modeling. When using the FLAIR-histoseg algorithm to measure leukoaraiosis volume in patients, however, the procedure is reversed. That is, TL and TU are unknown and the statistical descriptors of the brain pixels in the central portion of the histogram (between XL and XU in Fig. 1) function as predictor variables in the algorithm. In order to assess the accuracy of the FLAIR-histoseg method, a second group of synthetic phantom datasets was generated. Nine elderly volunteers subjects with little or no leukoaraiosis were identified from the ADPR/ADRC. These were different from the 10 normals whose scans were used to develop the algorithm. Thus the phantom images used to test the algorithm were completely different from those used to develop the algorithm. This was done intentionally in order to avoid the built in bias toward an “accurate” test result had we developed the algorithm and then assessed how well it worked using the same data. Synthetic leukoaraiosis lesions of three different grades, mild, moderate, and severe were embedded in the scans as described previously. The volume of the brain and the leukoaraiosis volume were computed using the FLAIR-histoseg method. The known brain volumes and the manually delineated leukoaraiosis volumes for each dataset served as the gold standard against which the accuracy of the algorithm was compared.
Assessment of Technique Reproducibility
To assess the reproducibility of the measurement technique, ten elderly volunteers for the ADPR/ADRC were asked to undergo two separate FLAIR imaging studies during the same MRI examination. The participants were selected consecutively, so a representative spectrum of leukoaraiosis severity was captured in this reproducibility study (Fig 3 and Fig 4). Following acquisition of an initial FLAIR sequence, each subject was removed from the scanner, the subject’s head was repositioned, and the subject was placed back into the MR scanner. A second FLAIR sequence identical to the first was then acquired as a separate examination, which entailed re-prescanning and re-auto-shimming. The volume of leukoaraiosis and total brain was measured using the FLAIR-histoseg algorithm. The coefficient of variation between the two examinations across all ten subjects was computed.
Figure 3. FLAIR-Histoseg in an Elderly Subject with Mild Leukoaraiosis.
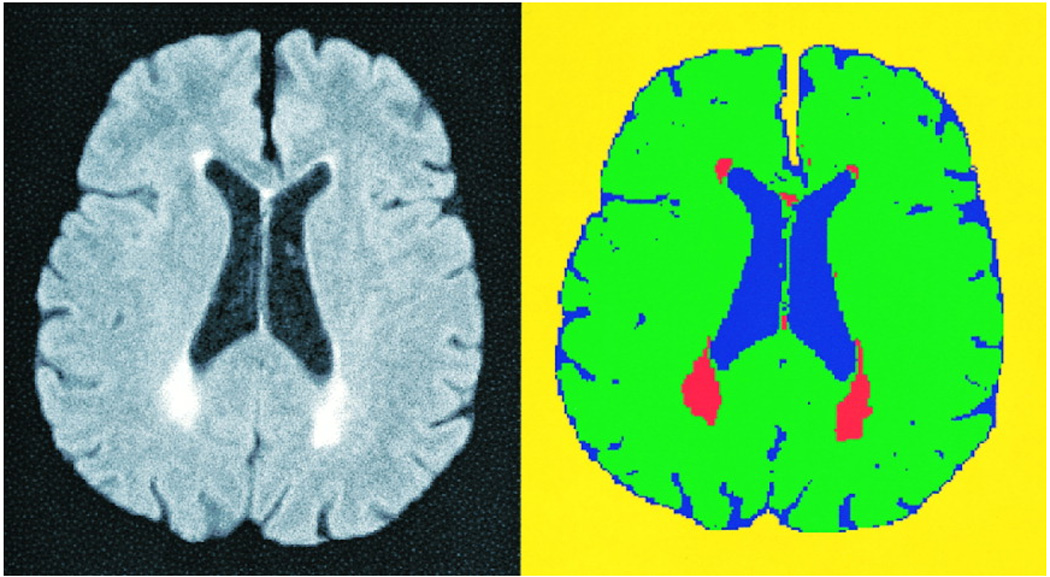
This figure illustrates the results of FLAIR-histoseg in an elderly volunteer for the reproducibility study. The FLAIR image, after removal of the skull and scalp, is on the left. The results of FLAIR-histoseg are seen on the right.
Figure 4.
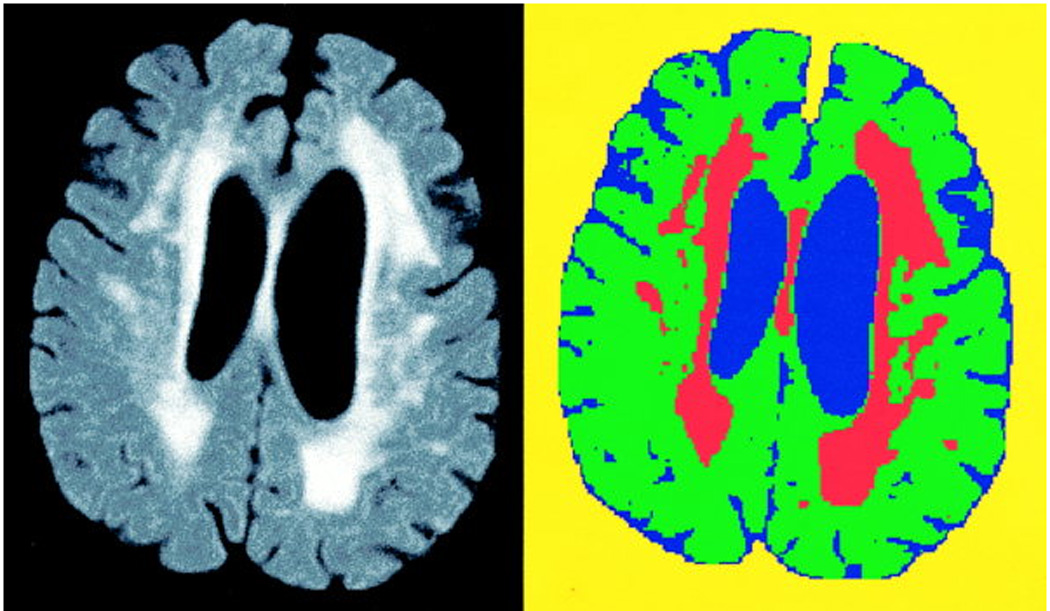
FLAIR-Histoseg in an elderly subject with more severe leukoaraiosis.
RESULTS
Tissue Intensity Values
Tissue intensity measurements (100 measurement values obtained from 10 normal elderly volunteers) are found in Table 1. The relative intensities of these values were used to create leukoaraiosis lesions in the synthetic image phantoms.
Table 1.
Tissue Intensity Values
| Mean | SD | |
|---|---|---|
| Normal White Matter | 156 | 13 |
| Leukoaraiosis lesion | 342 | 25 |
| CSF | 35 | 11 |
| Lesion/white matter ratio | 2.2 | 0.2 |
Assessment of Algorithm Accuracy
The values that appear in Table 2 for each of the three synthetic image phantom lesion severity levels represent the absolute error (i.e., absolute value) by which the output of the FLAIR-histoseg algorithm under or overestimated the known volume of leukoaraiosis when summed across all nine multi-slice synthetic phantom image datasets. The mean absolute error was 6.6%.
Table 2.
Percent Error in Leukoaraiosis Volume Measurement
| Mean (%) | SD (%) | |
|---|---|---|
| Mild | 4.1 | 8.1 |
| Moderate | 8.0 | 13.1 |
| Severe | 7.7 | 6.7 |
| Average | 6.6 | 9.6 |
The mean difference between the brain volume derived from the FLAIR-histoseg algorithm and auto-tracing of the T2-weighted brain images, across all 9 data sets was 1.4% (SD 1.8%).
Assessment of Technique Reproducibility
Table 3 shows the measured brain and lesion volumes of the ten volunteers who were scanned twice. The mean test re-test coefficient of variation for leukoaraiosis volume was 1.4% (SD 0.9%) and for brain volume was 0.3% (SD 0.2%).
Table 3.
Reproducibility
| Brain Volume in cm3 | Lesion Volume in cm3 | |||||
|---|---|---|---|---|---|---|
| Subject | 1st Scan | 2nd Scan | Absolute Value of the Difference Between 1st and 2nd Scan in % |
1st Scan | 2nd Scan | Absolute Value of the Difference Between 1st and 2nd Scan in % |
| 1 | 968.9 | 969.8 | 0.08 | 8.4 | 8.1 | 3.39 |
| 2 | 981.2 | 980.8 | 0.04 | 27.7 | 27.7 | 0.29 |
| 3 | 1154.3 | 1152.7 | 0.18 | 18.0 | 17.7 | 1.63 |
| 4 | 1067.9 | 1056.9 | 1.04 | 75.8 | 73.2 | 3.46 |
| 5 | 998.4 | 995.5 | 0.29 | 5.4 | 5.5 | 1.46 |
| 6 | 893.9 | 891.0 | 1.33 | 6.9 | 6.9 | 0.87 |
| 7 | 1214.4 | 1223.5 | 0.74 | 13.0 | 13.6 | 4.29 |
| 8 | 1077.1 | 1080.5 | 0.32 | 14.9 | 15.0 | 1.14 |
| 9 | 998.2 | 999.2 | 0.10 | 25.7 | 25.0 | 2.60 |
| 10 | 1188.8 | 1193.1 | 0.36 | 5.4 | 5.5 | 0.74 |
DISCUSSION
Over the past decade and half a large literature has developed on the topic of computer aided segmentation and quantitation of brain MRI. Much of this literature has focused on algorithms designed to measure global brain and CSF volume that can be accomplished with high reproducibility(24–32). It is generally acknowledged, however, that the accuracy and reproducibility of automated image segmentation is much worse for small, spatially non-contiguous tissues like leukoaraiosis than for larger structures like the whole brain(26). Like leukoaraiosis, MS plaques are most often located in the white matter, typically have elevated T2 signal with respect to adjacent normal brain tissue, and assume an anatomic configuration either of spatially distributed discrete foci or confluent areas of elevated signal in the periventricular white matter. In many respects therefore, quantification of leukoaraiosis volume is more analogous to MS quantitation than to whole brain quantitation; and the literature on automated quantitation of MS plaque volume is far larger than the literature on automated quantitation of leukoaraiosis volume(33).
Multi-spectral segmentation algorithms are a commonly used approach to the problem of segmentation, particularly of MS plaques(34–39). Two or more spatially registered MR image volumes with different contrast properties are used to define a feature-space. The images are segmented into different tissue classes based on the principle that specific tissues form clusters in feature-space. An advantage of the FLAIR-histoseg algorithm is that tissue classification is accomplished with only a single image volume. This obviates the need for registration of multiple image datasets. While registration algorithms generally work well, it does require an additional step that is unnecessary with FLAIR-histoseg or other single-band algorithms. Also, situations do arise in which registration functions suboptimally. For example, in order to achieve adequate spatial resolution in the slice select direction, and minimize partial volume averaging, an interleaved acquisition with thin sections (≤3 mm) is recommended for MS plaque (and leukoaraiosis) quantitation(37). A situation which we frequently encounter in our elderly and demented subjects is that one of the "packs" of the interleaved acquisition is slightly out of registration with the others due to patient head motion during the acquisition. Often this is inplane axial head rotation. If the inplane axial rotation occurs during the acquisition of non-centric phase encoding views, the mis-registered slices may not be excessively blurry, and are therefore "usable", just mis-aligned with respect to the images in the other interleaves. In this situation, rigid body multi-image registration required for many multi-spectral classifiers would be invalid. However, by obviating the need for registering multiple image volumes, the FLAIR-histoseg algorithm can estimate leukoaraiosis lesion volume even in the presence of some intra-image rotational motion.
A second advantageous feature of the FLAIR-histoseg algorithm is that the actual classification of pixels operates unsupervised, in the sense that no operator input is necessary to determine tissue intensity values used by the algorithm to segment the image. (Operator intervention is required in the pre-processing steps, so the algorithm as a whole is best regarded as semi-automated). The FLAIR-histoseg algorithm was "trained" in advance using phantom image datasets in which correct tissue classification was known. Supervised algorithms on the other hand require a trained operator to manually identify training sets of the major tissue classes of interest, for example CSF, brain, and leukoaraiosis lesion for each new set of images. The final result of a supervised classifier is highly dependent on operator defined tissue classification input values which are unique to each dataset(26). Small differences in operator judgment about the training dataset(s) may produce wide variation in results (32).
Surface erosion was employed in preprocessing, because we noticed that in FLAIR images the limbic cortex often had increased signal relative to white matter and neocortex. As a result, without surface erosion, some limbic cortex was mis-classified as lesion. In a recent publication, Hirai et al (22) confirmed this observation of increased signal intensity of limbic cortex relative to neocortex. Even with the surface erosion step, some manual editing of pixels in the limbic cortex that are incorrectly classified as lesion is usually required. Manual editing is also necessary for flow-related artifacts, pixels in the posterior limb of the internal capsule which often have high signal intensity, and pixels in central grey nuclei with dense physiologic mineral deposition which have low signal intensity (23). These manual editing steps are the main source of test re-test variability in the method. Manual editing is also used to segment the brain from the skull and scalp. This step could be automated to some extent using erode/dilate procedures. However, even with putatively fully automatic algorithms, some manual "clean-up" is usually required in order to obtain pristine brain segmentation.
The method we developed for creating synthetic image phantoms of leukoaraiosis allowed us to first develop the segmentation algorithm and then later, using a different set of image phantoms, test the accuracy of the algorithm with respect to a known gold standard measure. The leukoaraiosis lesions introduced into the synthetic images had signal intensity properties and spatial distribution properties that were fairly representative of that found in real life.
The FLAIR histoseg algorithm operates on the following principal. Pixels which represent normal brain can be accurately identified by statistic evaluation of the central portion of the histogram of FLAIR images, and pixels whose intensity exceeds that of normal brain represent lesion. We chose to use the mode value of the histogram to identify the central value of normal brain pixels. Unlike other measures of central tendency, the mode does not fluctuate with variations in the magnitude of the values in the tails of the histogram, which by definition vary across slices and across patients. Smoothing the histogram prior to determining its mode reduced variability associated with using the mode as the measure of central tendency.
The mean measurement error of FLAIR-histoseg algorithm with respect to the gold standard leukoaraiosis volume embedded in a number of different phantom images was 6.6%. This compares favorably with the accuracy values published for various other classifiers which range from 2.2% to 20%, using either synthetic images or physical phantoms as the measure of absolute truth (38–42). Because designing anatomically realistic phantoms of MS or leukoaraiosis is difficult, most segmentation algorithm validation studies have addressed test re-test reproducibility rather than measurement accuracy compared to an absolute volumetric gold standard. With a mean test re-test co-efficient of variation of 1.4%, the FLAIR-histoseg technique compares favorably with reproducibility assessments of other algorithms for MS and leukoaraiosis quantitation. Published reproducibility measurements expressed as coefficients of variation range from 0.9% to 39% (35, 41, 43, 44).
In summary, FLAIR-histoseg is a viable method by which the volumetric burden of leukoaraiosis can be measured in elderly persons. The measured levels of accuracy and reproducibility can be achieved by simply thresholding a single image, due to the unique contrast properties of the FLAIR pulse sequence which isolates the pathology of interest to a specific portion of the intensity histogram. This avoids the need for multi-image registration. The unique aspect of the segmentation algorithm itself centers on automated statistically based computation of histogram thresholds for tissue classification, which are determined individually for each slice and thus accommodate slice to slice variation in the intensity histogram distribution.
ACKNOWLEDGMENTS
Brenda Maxwell - Typing
Ruth Cha - Statistical Analysis
Scott Stiving, B.S., Programming
Supported by NIH-NIA-AG11378; AG-08031; AG-06786; AG-16574
APPENDIX
Algorithm Parameters
The following parameters were considered as independent variables in the regression modeling. These refer to the statistical properties of the pixels in the interval XL to XU in the FLAIR intensity histogram (See Figure 1).
Z1 = Mean
Z2 = Standard deviation
Z3 = Skew
Z4 = Kurtosis
Z5 = XU – Mode
Z6 = Mode – XL
Z7 = Mode
Z8 = frequency at Mode (Number of pixels with the Mode value)
Z9 = P (1/3 the number of pixels at Mode)
Z10 = Summation of pixels between XL and XU
Based on the regression modeling described in the Methods Section the following equations were found to optimally define TU and TL:
| Eqn. 1 |
TU. In the course of the modeling, we obtained better results by using V̂ as the dependent variable rather than TU. V̂ is defined as the number of pixels in the histogram to the right of TU (i.e. the estimated volume of leukoaraiosis in that imaging section), and determining V̂ implicitly defines the value of TU. We also found that results were best if two different equations for V̂ were used, depending on the computed value of V* (defined as the number of pixels in the histogram to the right of XU – see Fig. 1)
If V* ≥3000 pixels then:
| Eqn. 2 |
If V* <3000 pixels then:
| Eqn. 3 |
REFERENCES
- 1.Braffman BH, Zimmerman RA, Trojanowski JQ, et al. Brain MR: pathologic correlation with gross and histopathology. 2. Hyperintense white matter foci in the elderly. AJNR. 1988;9:629–636. doi: 10.2214/ajr.151.3.559. [DOI] [PubMed] [Google Scholar]
- 2.Fazekas F, Kleinert R, Offenbacher H, Schmidt Rea. Pathologic correlates of incidental MRI white matter signal hyperintensities. Neurology. 1993;43:1683–1689. doi: 10.1212/wnl.43.9.1683. [DOI] [PubMed] [Google Scholar]
- 3.Kirkpatrick JB, Hayman LA. White-matter lesions in MR imaging of clinically healthy brains of elderly subjects: possible pathologic basis. Radiology. 1987;162:509–511. doi: 10.1148/radiology.162.2.3797666. [DOI] [PubMed] [Google Scholar]
- 4.Lotz PR, Ballinger WE, Quisling RG. Subcortical arteriosclerotic encephalopathy: CT spectrum and pathologic correlation. AJNR. 1986;7:817–822. doi: 10.2214/ajr.147.6.1209. [DOI] [PubMed] [Google Scholar]
- 5.Marshall VG, Bradley WG, Jr, Marshall CE, Bhoopat T, Rhodes RH. Deep white matter infarction: correlation of MR imaging and histopathologic findings. Radiology. 1988;167:517–522. doi: 10.1148/radiology.167.2.3357964. [DOI] [PubMed] [Google Scholar]
- 6.Munoz DG, Hastak SM, Harper B, et al. Pathologic correlates of increased signals of the centrum ovale on magnetic resonance imaging. Arch Neurol. 1993;50:492–497. doi: 10.1001/archneur.1993.00540050044013. [DOI] [PubMed] [Google Scholar]
- 7.Moody DM, Brown WR, Challa VR, Anderson RL. Periventricular venous collagenosis: association with leukoaraiosis. Radiology. 1995;194:469–476. doi: 10.1148/radiology.194.2.7824728. [DOI] [PubMed] [Google Scholar]
- 8.Manolio TA, Kronmal RA, Burke GL, et al. Magnetic resonance abnormalities and cardiovascular disease in older adults.The Cardiovascular Health Study. Stroke. 1994;25:318–327. doi: 10.1161/01.str.25.2.318. [DOI] [PubMed] [Google Scholar]
- 9.Liao D, Cooper L, Cai J, et al. Presence and severity of cerebral white matter lesions and hypertension, its treatment, and its control. The ARIC study. Stroke. 1996;27:2262–2270. doi: 10.1161/01.str.27.12.2262. [DOI] [PubMed] [Google Scholar]
- 10.van Swieten JC, Geyskes GG, Derix MMA, et al. Hypertension in the elderly is associated with white matter lesions and cognitive decline. Ann Neurol. 1991;30:825–830. doi: 10.1002/ana.410300612. [DOI] [PubMed] [Google Scholar]
- 11.Breteler MMB, van Amerongen NM, van Swieten JC, et al. Cognitive correlates of ventricular enlargement and cerebral white matter lesions on magnetic resonance imaging. The Rotterdam Study. Stroke. 1994;25:1109–1115. doi: 10.1161/01.str.25.6.1109. [DOI] [PubMed] [Google Scholar]
- 12.Breteler MMB, vanSwieten JC, Bots ML, et al. Cerebral white matter lesions, vascular risk factors, and cognitive function in a population-based study: The Rotterdam study. Neurology. 1994;44:1246–1252. doi: 10.1212/wnl.44.7.1246. [DOI] [PubMed] [Google Scholar]
- 13.Longstreth WT, Manolio TA, Arnold A, et al. Clinical correlates of white matter findings on cranial magnetic resonance imaging of 3301 elderly people. The Cardiovascular Health Study. Stroke. 1996;27:1274–1282. doi: 10.1161/01.str.27.8.1274. [DOI] [PubMed] [Google Scholar]
- 14.Davis PC, Gray L, Albert M, et al. The consortium to establish a registry for Alzheimer’s disease (CERAD).Part III. Reliability of a standardized MRI evaluation of Alzheimer’s disease. Neurology. 1992;42:1676–1680. doi: 10.1212/wnl.42.9.1676. [DOI] [PubMed] [Google Scholar]
- 15.Bryan RN, Manolio TA, Schertz LD, et al. A method for using MR to evaluate the effects of cardiovascular disease on the brain: the Cardiovascular Health Study. AJNR. 1994;15:1625–1633. [PMC free article] [PubMed] [Google Scholar]
- 16.Bryan RN, Wells SW, Miller TJ, et al. Infarct-like lesions in the brain: prevalence and anatomic characteristics at MR imaging of the elderly--data from the Cardiovascular Health Study. Radiology. 1997;202:47–54. doi: 10.1148/radiology.202.1.8988191. [DOI] [PubMed] [Google Scholar]
- 17.Rydberg JN, Hammond CA, Grimm RC, Erickson BE, Jack CRJ, Huston J, Riederer SJ. Initial clinical experience in MR imaging of the brain using a fast FLAIR pulse sequence. Radiology. 1994;193:173–180. doi: 10.1148/radiology.193.1.8090888. [DOI] [PubMed] [Google Scholar]
- 18.Rydberg JN, Riederer SJ, Hammond CA, Jack CRJ. Contrast optimization of fluid-attenuated inversion recovery (FLAIR) imaging. Mag Reson in Med. 1995;34:868–877. doi: 10.1002/mrm.1910340612. [DOI] [PubMed] [Google Scholar]
- 19.Robb RA. A software sytem for interactive and quantitative analysis of biomedical images., in 3D Imaging in Medicine. In: Hohne KH, Fuchs H, Pizer SM, editors. Berlin-Heidelberg: Springer Verlag; 1990. pp. 333–361. NATO ASI Series. [Google Scholar]
- 20.Brinkman B, Manduca A, Robb R. Optimized homomorphic unsharp masking for MR grayscale inhomogeneity correction. IEEE Trans Med Img. 1998;17:161–171. doi: 10.1109/42.700729. [DOI] [PubMed] [Google Scholar]
- 21.Perona P, Malik J. Scale-space and edge detection using anisotropic diffusion. IEE Trans Med Img. 1990;12:629–639. [Google Scholar]
- 22.Hirai T, Korogi Y, Yoshizumi K, Shigematsu Y, Sugahara T, Takahashi M. Limbic lobe of the human brain: evaluation with turbo fluid-attenuated inversion-recovery MR imaging. Radiology. 2000;215:470–475. doi: 10.1148/radiology.215.2.r00ma06470. [DOI] [PubMed] [Google Scholar]
- 23.Gawne-Cain ML, Solver NC, Moseley IF, Miller DH. Fast FLAIR of the brain: the range of appearances in normal subjects and its application to quantification or white-matter disease. Neuroradiology. 1997;39:243–249. doi: 10.1007/s002340050402. [DOI] [PubMed] [Google Scholar]
- 24.Atkins M, Mackiewich BT. Fully automatic segmentation of the brain in MRI. IEEE. 1998;17:98–107. doi: 10.1109/42.668699. [DOI] [PubMed] [Google Scholar]
- 25.Clarke LP, Velthuizen RP, Phuphanich S, Schellenberg JD, et al. MRI: stability of three supervised segmentation techniques. Magnetic Resonance Imaging. 1993;1:95–106. doi: 10.1016/0730-725x(93)90417-c. [DOI] [PubMed] [Google Scholar]
- 26.Clarke LP, Velthuizen RP, Camacho MA, et al. MRI segmentation: methods and applications. Magnetic Resonance Imaging. 1995;13:343–368. doi: 10.1016/0730-725x(94)00124-l. [DOI] [PubMed] [Google Scholar]
- 27.DeCarli C, Maisog J, Murphy DTM, Teichber D, Rapoport ST, Horwitz B. Method for quantification of brain, ventricular, and subarachnoid CSF volumes from MR images. Journal of Computed Assisted Tomography. 1992;16:274–284. doi: 10.1097/00004728-199203000-00018. [DOI] [PubMed] [Google Scholar]
- 28.Kao YH, Sorenson JA, Bahn MM, et al. Dual-echo MRI segmentation using vector decomposition and probability techniques: a two-tissue model. Magnetic Resonance in Medicine. 1994;32:342057. doi: 10.1002/mrm.1910320310. [DOI] [PubMed] [Google Scholar]
- 29.Kikinis R, Shenton ME, Gerig G, Martin J, Anderson M, et al. Routine quantitative analysis of brain and cerebrospinal fluid spaces with MR imaging. JMRI. 1992;2:619–629. doi: 10.1002/jmri.1880020603. [DOI] [PubMed] [Google Scholar]
- 30.Lin JS, Cheng KS, Mao CW. Multispectral magnetic resonance images segmentation using fuzzy Hopfield neural network. International Journal of BioMedical Computing. 1996;42:205–214. doi: 10.1016/0020-7101(96)01199-3. [DOI] [PubMed] [Google Scholar]
- 31.Bonar DC, Schaper KA, Anderson JR, Rottenberg DA, Strother SC. Graphical analysis of MR feature space for measurement of CSF, gray-matter, and white matter volumes. Journal of Computer Assisted Tomography. 1993;17:461–470. doi: 10.1097/00004728-199305000-00024. [DOI] [PubMed] [Google Scholar]
- 32.Barra V, Boire JY. Tissue segmentation on MR images of the brain by possibilistic clustering on a 3D wavelet representation. Journal of Magnetic Resonance Imaging. 2000;11:267–278. doi: 10.1002/(sici)1522-2586(200003)11:3<267::aid-jmri5>3.0.co;2-8. [DOI] [PubMed] [Google Scholar]
- 33.Zijdenbos AP, Dawant BM, Margolin RA, Palmer AC. Morphometric analysis of white matter lesions in MR images: method and validation. IEEE Transactions on Medical Imaging. 1994;13:716–724. doi: 10.1109/42.363096. [DOI] [PubMed] [Google Scholar]
- 34.Simon JH, Scherzinger A, Raff U, Li X. Computerized method of lesion volume quantitation in multiple sclerosis: error of serial studies. AJNR. 1997;18:580–582. [PMC free article] [PubMed] [Google Scholar]
- 35.Kikinis R, Guttmann CR, Metcalf D, et al. Quantitative followup of patients with multiple sclerosis using MRI: technical aspects. Journal of Magnetic Resonance Imaging. 1999;9:519–530. doi: 10.1002/(sici)1522-2586(199904)9:4<519::aid-jmri3>3.0.co;2-m. [DOI] [PubMed] [Google Scholar]
- 36.Erickson B, Avula RTV. An algorithm for automatic segmentation and classification of magnetic resonance brain images. Journal of Digital Imaging. 1998;11:74–82. doi: 10.1007/BF03168729. [DOI] [PMC free article] [PubMed] [Google Scholar]
- 37.Evans AC, Frank JA, Antel J, Miller DH. The role of MRI in clinical trials of multiple sclerosis: comparison of image processing techniques. Ann Neurol. 1997;41:125–132. doi: 10.1002/ana.410410123. [DOI] [PubMed] [Google Scholar]
- 38.Kamber M, Shinghal R, Collins DL, Francis GS, Evans AC. Model-based 3D segmentation of multiple sclerosis lesions in magnetic resonance brain images. IEEE Transactions on Medical Imaging. 1995;14:442–453. doi: 10.1109/42.414608. [DOI] [PubMed] [Google Scholar]
- 39.Mitchell JR, Karlik SJ, Lee DH, Fenster A. Computer-assisted identification and quantification of multiple sclerosis lesions in MR imaging volumes in the brain. JMRI. 1994;4:197–208. doi: 10.1002/jmri.1880040218. [DOI] [PubMed] [Google Scholar]
- 40.Tofts PS, Barker GJ, Filippi M, Gawne-Cain M, Lai M. An oblique cylinder contrast-adjusted (OCCA) phantom to measure the accuracy of MRI brain lesion volume estimation schemes in multiple sclerosis. Magnetic Resonance Imaging. 1997;15:183–192. doi: 10.1016/s0730-725x(96)00339-6. [DOI] [PubMed] [Google Scholar]
- 41.Jackson EF, Narayana pA, Wolinsky JS, Doyle T. Accuracy and reproducibility in volumetric analysis of multiple sclerosis lesions. Journal of Computer Assisted Tomography. 1993;17:200–205. doi: 10.1097/00004728-199303000-00007. [DOI] [PubMed] [Google Scholar]
- 42.Jack CR, Jr, Bentley M, Twomey CK, Zinsmeister AR. MR-based volume measurements of the hippocampal formation and anterior temporal lobe: validation studies. Radiology. 1990;176:205–209. doi: 10.1148/radiology.176.1.2353093. [DOI] [PubMed] [Google Scholar]
- 43.Molyneux PD, Tofts PS, Fletcher A, Gunn B, Robinson P, et al. Precision and reliability for measurement of change in MRI lesion volume in multiple sclerosis: a comparison of two computer assisted techniques. J Neurol Neurosurg Psychiatry. 1998;65:42–47. doi: 10.1136/jnnp.65.1.42. [DOI] [PMC free article] [PubMed] [Google Scholar]
- 44.Udupa JK, Wei L, Samarasekera S, Miki Y, van Buchem MA, Grossman RI. Multiple sclerosis lesion quantification using fuzzy-connectedness principles. IEEE Transactions of medical imaging. 1997;16:598–609. doi: 10.1109/42.640750. [DOI] [PubMed] [Google Scholar]