

Abstract
Objective
The purpose of this study was to systematically compare methods for standardization of blood pressure levels obtained by ambulatory blood pressure monitoring (ABPM) in a group of 111 children studied at our institution.
Methods
Blood pressure indices, blood pressure loads and standard deviation scores were calculated using he original ABPM and the modified reference standards. Bland—Altman plots and kappa statistics for the level of agreement were generated.
Results
Overall, the agreement between the two methods was excellent; however, approximately 5% of children were classified differently by one as compared with the other method.
Conclusion
Depending on which version of the German Working Group’s reference standards is used for interpretation of ABPM data, the classification of the individual as having hypertension or normal blood pressure may vary.
Keywords: ambulatory blood pressure monitoring, blood pressure, hypertension, reference standards
Introduction
Ambulatory blood pressure monitoring (ABPM) has gained acceptance for characterization of blood pressure (BP) in children and adolescents both in clinical and research setting [1,2]. In adults with hypertension (HTN), ABPM has consistently shown superiority over casual, clinic readings for prediction of cardiovascular morbidity and mortality [3-5]. Compared with office BP readings, ABP is a better predictor of increased left ventricular mass in children with HTN [6,7]. Furthermore, the ability to examine 24-h BP is particularly useful in children with renal disease or diabetes mellitus, as increases in nocturnal BP are associated with worse prognosis [1,8].
Before the availability of the ABPM reference standards, clinicians and investigators used casual standards published by the Joint Working Group on Hypertension Control [9,10] for interpretation of ABPM in children [11-16]. When the German Working Group on Pediatric Hypertension presented normal values from over 1000 children in 1997 [17], studies involving ABPM in children gradually adopted these as the best available standards, although some investigators continued to use the Working Group’s casual BP reference standards as ABP standards [18]. The prevalence of white coat HTN or ambulatory HTN vary significantly depending on the choice of threshold values [19-21]. The German Working Group transformed their original data to correct for their non-Gaussian distribution to generate day and night threshold values, and the coefficients to allow calculation of a standard deviation scores (SDS) [22].
In literature, studies on comparison of the available ABP reference standards as applied to the interpretation of an individual BP recording are lacking. The purpose of this study is to test the degree of agreement between BP indices (BPI) and BP loads obtained by the application of the original ABPM versus smoothed reference standards. We also wanted to compare thresholds based on height with those based on age from the modified standards.
Methods
Participants were recruited from primary care clinics and from children referred to University of Tennessee Medical Group nephrology or cardiology clinics for the evaluation of elevated BP as described earlier [7]. Informed consent was obtained; the research protocol was approved by the University of Tennessee Health Science Center Institutional Review Board, and followed the guidelines for good clinical practice.
ABPM was performed using the AM5600 ambulatory blood pressure monitor (Advanced Biosensor, Columbia, South Carolina, USA), which has been validated in children [23]. The monitors were programmed to measure the BP every 20 min for a 24-h period using the auscultatory technique to detect systolic BP (SBP) at Korotkoff phase I and diastolic BP (DBP) at Korotkoff phase V. Details of the procedures have been reported [7].
Participant height and weight were measured using a balance beam scale and pediatric wall-mounted stadiometer. Height percentile was calculated using the CDC NHANES III data tables by age in months [24].
The mean SBP and DBP were calculated separately for the day and night periods. The BPI for each patient were calculated by expressing the mean BP as a ratio to the appropriate 95th percentile, either from the German multicenter ABPM trial, as reported by Soergel et al. (termed ‘original’) [17] or from the modified threshold values as reported later by Wuhl et al. (termed ‘modified’) [22]. Only day and night BPI were calculated because the modified reference values did not provide 95th percentile threshold values for mean 24-h BP. SDS based on individual child’s height and age were calculated using the least mean square method for 24 h, day and night values. The 24-h BP load was calculated from the sum of abnormal readings from day and night periods over the total number of readings. Recent guidelines stratify into three categories based on load: less than 25, 25–50 and greater than 50% [1,25].
Statistical analysis
SAS software (SAS Inc., Cary, North Carolina, USA) was used for statistical analyses. Bland—Altman plots [26] were generated using Graph Pad Prism4 (Graph Pad Software Inc., San Diego, California, USA). For each Bland—Altman plot, the BPI or load obtained using the 95th percentile for sex and height from original reference standards [17] were subtracted from the value obtained using the modified reference standards [22].
The mean difference in BPI, BP load, or SDS (also known as the bias) is reported along with the standard deviation of the difference and 95% limits of agreement [26]. Whether the individual differences were statistically significant was assessed by the Wilcoxon’s rank sign test. The kappa statistic, κ, a measure of the agreement for categorization of patients as hypertensive or normotensive [27], was calculated for each parameter; for the load analyses, the agreement between those categorized as having normal load (< 25%), or a load known to be associated with increased risk for target-organ damage (> 50%) were calculated [1]. A κ value of 0.4–0.6 indicates moderate agreement, 0.6–0.8 indicates substantial agreement, and 0.8–1.0 indicates almost perfect agreement [27].
Results
There were 111 children studied: their mean age was 13.6 ± 2.6 years (range 7–18 years). There were 79 African—Americans, 31 Caucasians, and one Asian participant; 64% were male and 54% were categorized as overweight based on BMI percentile. The total number of readings obtained for the 24-h study period was 54.8 ± 10.8 (mean ± standard deviation), with 31.6 ± 9.4 for day and 23.2 ± 6.1 for night.
The Bland—Altman plots were generated to compare the values obtained for SBP indices (SBPI) (Fig. 1) and DBP (Fig. 2) indices (DBPI). Mean bias for day and night SBPI were − 0.004 (NS, by Wilcoxon’s signed rank test) and − 0.011 (P< 0.0001), respectively, indicating that the BPIs derived from the modified reference standards are slightly lower compared to the originals. Mean bias for day and night DBPI were 0.027 (P< 0.0001) and 0.016 (P< 0.0001), respectively, indicating that the BPI derived from the modified reference standards were slightly higher compared with the originals. Of the BPI, only day SBP did not show a significant difference between those calculated from original and modified reference standards. The level of agreement in categorizing an individual’s mean BP as abnormal (BPI > 1) was evaluated by calculation of the κ statistic (Table 1). Agreement between the two reference standards in categorizing a child as hypertensive was substantial for day DBPI and almost perfect for day SBPI, night SBPI, and night DPBI. The best agreement was for night DBPI.
Fig. 1.

Bland—Altman plots of systolic blood pressure indices (SBPI) calculated from original and modified ambulatory blood pressure monitoring reference values for (a) day SBPI [bias − 0.004 ± 0.019, confidence interval (CI): − 0.041 to 0.033, P= 0.0586], (b) night SBPI [bias − 0.011 ± 0.010, CI: − 0.30 to 0.009, P< 0.0001]. The y-axis represents the difference between the two methods and the x-axis represents the mean of the two methods. Dashed lines represent the mean difference between the two BPI with 95% limits of agreement.
Fig. 2.

Bland—Altman plots of diastolic blood pressure indices (DBPI) calculated from original and modified ambulatory blood pressure monitoring reference values for (a) day DBPI [bias 0.027 ± 0.011, confidence interval (CI): 0.005–0.049, P< 0.0001], (b) night DBPI [bias 0.016 ± 0.007, CI: 0.001–0.030, P< 0.0001]. The y-axis represents the difference between the two methods and the x-axis represents the mean of the two methods. Dashed lines represent the mean difference between the two BPI with 95% limits of agreement.
Table 1.
Kappa statistics for level of agreement so as to categorize BP as abnormal based on BPI and load according to the original and modified ABP standards
| Systolic BP |
Diastolic BP |
|||
|---|---|---|---|---|
| BPI (> 1) | κ | CI | κ | CI |
| Day | 0.86 | 0.77–0.96 | 0.79 | 0.64–0.95 |
| Night | 0.93 | 0.86–1.00 | 0.95 | 0.04–0.25 |
| Load, 24 h | ||||
| < 25% | 0.85 | 0.75–0.95 | 0.77 | 0.65–0.88 |
| > 50% | 0.85 | 0.75–0.95 | 0.86 | 0.75–0.97 |
Two different load values were assessed: < 25%, which is accepted by most as normal, and > 50%, which is associated with greater risk for target-organ damage. Kappa statistics (κ) are the level of agreement between categorization of each participant using original and modified ambulatory blood pressure (ABP) standards. BPI, blood pressure index, which represents the individual mean BP divided by the 95th percentile for sex, age, and height; CI, 95% confidence intervals for the κ statistic; Load, the percentage of individual readings > 95th percentile.
Comparison of BP load derived from each of the reference standards is shown in Fig. 3. For 24-h SBP load, the bias was − 2.5% (P= − 0.018), indicating that the load calculated from the modified reference standards was, on average, 2.5% lower as compared with the original. For 24-h DBP load the bias was 5.9% (P< 0.0001), indicating that the load calculated from the modified reference standards was, on average, 5.9% higher as compared with the original. The κ statistics for level of agreement in categorizing a child as having a 24-h BP load that is normal (< 25%) or one who is at increased risk for target-organ damage (> 50%) are found in the Table 1. Agreement was almost perfect for categorization of an individual as having SBP and DBP loads greater than 50%, and for having a SBP load less than 25%; however, the agreement between the two methods in categorizing a participant as having a normal DBP load was substantial.
Fig. 3.

Bland—Altman plots of blood pressure (BP) load calculated from original and modified ambulatory blood pressure monitoring reference values for (a) 24-h systolic BP (SBP) [bias − 2.5 ± 11.5%, confidence interval (CI): − 25 to 20, P= 0.018], (b) 24-h diastolic BP (DBP) [bias 5.85 ± 10.3%, CI: − 14.3 to 26.0, P< 0.0001]. The y-axis represents the difference between the two methods and the x-axis represents the mean of the two methods. Dashed lines represent the mean difference between the two BP indices with 95% limits of agreement.
Comparison of BP SDS based on either height or age showed that the SBP SDS were higher based on height as compared with age for all time periods; DBP SDS were much closer in value. The Bland—Altman plots are not shown, but the mean bias is shown in Fig. 4. Values for 24-h SDS were significantly different between the age-based and height-based methods with the exception of the 24-h DBP SDS.
Fig. 4.
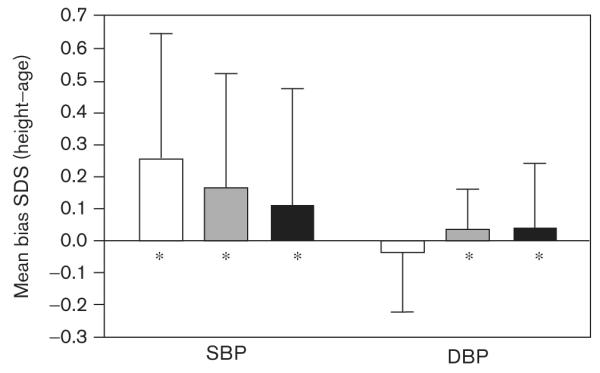
Mean bias for comparison of the height-based versus the age-based standard deviation scores (SDS) for systolic blood pressure (SBP) and diastolic blood pressure (DBP). Values represent the mean ± standard deviation. *Significant difference (P< 0.01) in values obtained by the two methods.
Discussion
A recently published American Heart Association Scientific Statement on ABPM in children and adolescents recommends use of either the original or modified reference standards derived from the German Working Group. Our aim was to systematically examine the differences between the original and modified reference values when applied to a group of children who were evaluated for HTN; these children underwent ABPM as part of a cross-sectional study [7].
Since the ABPM reference values from the German Working Group on Pediatric Hypertension were published in 1997, they have been adopted as the standard for ABP. As recently discussed in the review article by Lurbe et al. [1], there are concerns about the lack of variation in DBP with age and sex as compared with the casual data presented by the Task Force [9,10]. However, they are accepted as the best reference values available [1]. Although they are derived from the same original data, threshold values from the original and those modified by Wuhl et al.[22], after transformation of data using the least mean square method, differ slightly. As a result, interpretation of the individual child’s ABP may be different depending on which reference standards are used. In general, the agreement between the original and modified reference standards was excellent; however, approximately 5% of children were classified differently depending on which standards were used. The dilemma as to which standards are more accurate is further complicated by the recent publication of guidelines, which include a third, slightly different table of reference standards, which were also derived from the German Working Group’s original data [25].
Although age-based reference standards were provided by Wuhl et al. [22], most clinicians and investigators use height-based rather than age-based normal values when applying the ABP reference standards. We found that height-based SBP SDS tended to be higher than age-based, whereas height-based and age-based DBP SDS were much closer in value.
One of the limitations to our study is the use of a primarily auscultatory method (oscillometric backup), rather than the oscillometric method that was used by the German Working Group to collect the ABPM data. However, most investigators check the accuracy of the ambulatory monitor (even oscillometric monitors) in each patient using a mercury manometer, and have found the readings to be nearly identical [28,29]. Furthermore, recently published studies have applied the Working Group standards to ABP data obtained using oscillometric monitors [18] and oscillometric ABP reference standards when using an auscultatory monitor [7,30].
Given the paucity of cardiovascular endpoints by which to validate BP data threshold values in childhood, the best choice of reference standards is not clear. However, depending on which version of the German Working Group’s reference standards is used for interpretation of ABPM data, the classification of the individual as having HTN or normal BP may vary. Until ABP thresholds can be based on reliable outcome measures in a multiethnic cohort of youth, the pediatric HTN community will continue to be challenged by the dilemma of selecting the most appropriate normative standards for the interpretation of ABPM in children.
Acknowledgements
This study was supported by a grant from the Children’s Foundation Research Center of Memphis at Le Bonheur Children’s Medical Center, and the UTHSC GCRC NCRR #000211 and NIH NHLBI #5K23HL83910-2.
Footnotes
Conflicts of interest: none declared.
References
- 1.Lurbe E, Sorof JM, Daniels SR. Clinical and research aspects of ambulatory blood pressure monitoring in children. J Pediatr. 2004;144:7–16. doi: 10.1016/j.jpeds.2003.09.050. [DOI] [PubMed] [Google Scholar]
- 2.Graves JW, Althaf MM. Utility of ambulatory blood pressure monitoring in children and adolescents. Pediatr Nephrol. 2006;21:1640–1652. doi: 10.1007/s00467-006-0175-6. [DOI] [PubMed] [Google Scholar]
- 3.Verdecchia P, Porcellati C, Schillaci G, Borgioni C, Ciucci A, Battistelli M, et al. Ambulatory blood pressure. An independent predictor of prognosis in essential hypertension. Hypertension. 1994;24:793–801. doi: 10.1161/01.hyp.24.6.793. [DOI] [PubMed] [Google Scholar]
- 4.Clement DL, De Buyzere ML, De Bacquer DA, de Leeuw PW, Duprez DA, Fagard RH, et al. Prognostic value of ambulatory blood-pressure recordings in patients with treated hypertension. N Engl J Med. 2003;348:2407–2415. doi: 10.1056/NEJMoa022273. [DOI] [PubMed] [Google Scholar]
- 5.Hansen TW, Jeppesen J, Rasmussen S, Ibsen H, Torp-Pedersen C. Ambulatory blood pressure and mortality: a population-based study. Hypertension. 2005;45:499–504. doi: 10.1161/01.HYP.0000160402.39597.3b. [DOI] [PubMed] [Google Scholar]
- 6.Sorof JM, Cardwell G, Franco K, Portman RJ. Ambulatory blood pressure and left ventricular mass index in hypertensive children. Hypertension. 2002;39:903–908. doi: 10.1161/01.hyp.0000013266.40320.3b. [DOI] [PubMed] [Google Scholar]
- 7.Richey PA, Disessa TG, Hastings MC, Somes GW, Alpert BS, Jones DP. Ambulatory blood pressure and increased left ventricular mass in children at risk for hypertension. J Pediatr. 2008;152:343–348. doi: 10.1016/j.jpeds.2007.07.014. [DOI] [PMC free article] [PubMed] [Google Scholar]
- 8.Patzer L, Seeman T, Luck C, Wuhl E, Janda J, Misselwitz J. Day- and night-time blood pressure elevation in children with higher grades of renal scarring. J Pediatr. 2003;142:117–122. doi: 10.1067/mpd.2003.13. [DOI] [PubMed] [Google Scholar]
- 9.Update on the 1987 Task Force Report on High Blood Pressure in Children and Adolescents: a working group report from the National High Blood Pressure Education Program. National High Blood Pressure Education Program Working Group on Hypertension Control in Children and Adolescents. Pediatrics. 1996;98(4 Pt 1):649–658. [PubMed] [Google Scholar]
- 10.National High Blood Pressure Education Program Working Group on High Blood Pressure in Children and Adolescents The fourth report on the diagnosis, evaluation, and treatment of high blood pressure in children and adolescents. Pediatrics. 2004;114(Suppl):555–576. [PubMed] [Google Scholar]
- 11.Flynn JT. Differentiation between primary and secondary hypertension in children using ambulatory blood pressure monitoring. Pediatrics. 2002;110(1 Pt 1):89–93. doi: 10.1542/peds.110.1.89. [DOI] [PubMed] [Google Scholar]
- 12.Kennedy SE, Mackie FE, Rosenberg AR, Craig E, Kainer G. Agreement on reporting of ambulatory blood pressure monitoring in children. Pediatr Nephrol. 2005;20:1766–1768. doi: 10.1007/s00467-005-2066-7. [DOI] [PubMed] [Google Scholar]
- 13.Sorof JM, Poffenbarger T, Portman R. Abnormal 24-h blood pressure patterns in children after renal transplantation. Am J Kidney Dis. 2000;35:681–686. doi: 10.1016/s0272-6386(00)70016-3. [DOI] [PubMed] [Google Scholar]
- 14.Giordano U, Matteucci MC, Calzolari A, Turchetta A, Rizzoni G, Alpert BS. Ambulatory blood pressure monitoring in children with aortic coarctation and kidney transplantation. J Pediatr. 2000;136:520–523. doi: 10.1016/s0022-3476(00)90016-7. [DOI] [PubMed] [Google Scholar]
- 15.Morgan H, Khan I, Hashmi A, Hebert D, McCrindle BW, Balfe JW. Ambulatory blood pressure monitoring after renal transplantation in children. Pediatr Nephrol. 2001;16:843–847. doi: 10.1007/s004670100668. [DOI] [PubMed] [Google Scholar]
- 16.Kouidi E, Fahadidou-Tsiligiroglou A, Tassoulas E, Deligiannis A, Coats A. White coat hypertension detected during screening of male adolescent athletes. Am J Hypertens. 1999;12(2 Pt 1):223–226. doi: 10.1016/s0895-7061(98)00186-1. [DOI] [PubMed] [Google Scholar]
- 17.Soergel M, Kirschstein M, Busch C, Danne T, Gellermann J, Holl R, et al. Oscillometric twenty-four-hour ambulatory blood pressure values in healthy children and adolescents: a multicenter trial including 1141 subjects. J Pediatr. 1997;130:178–184. doi: 10.1016/s0022-3476(97)70340-8. [DOI] [PubMed] [Google Scholar]
- 18.Brady TM, Fivush B, Flynn JT, Parekh R. Ability of blood pressure to predict left ventricular hypertrophy in children with primary hypertension. J Pediatr. 2008;152:73–78. doi: 10.1016/j.jpeds.2007.05.053. [DOI] [PubMed] [Google Scholar]
- 19.Sorof JM, Portman RJ. White coat hypertension in children with elevated casual blood pressure. J Pediatr. 2000;137:493–497. doi: 10.1067/mpd.2000.108394. [DOI] [PubMed] [Google Scholar]
- 20.Kennedy SE, Mackie FE, Craig E, Kainer G. The choice of threshold limits for pediatric ambulatory blood pressure monitoring influences clinical decisions. Blood Press Monit. 2006;11:119–123. doi: 10.1097/01.mbp.0000209085.55364.73. [DOI] [PubMed] [Google Scholar]
- 21.Diaz LN, Garin EH. Comparison of ambulatory blood pressure and Task Force criteria to identify pediatric hypertension. Pediatr Nephrol. 2007;22:554–558. doi: 10.1007/s00467-006-0372-3. [DOI] [PubMed] [Google Scholar]
- 22.Wuhl E, Witte K, Soergel M, Mehls O, Schaefer F. Distribution of 24-h ambulatory blood pressure in children: normalized reference values and role of body dimensions. J Hypertens. 2002;20:1995–2007. doi: 10.1097/00004872-200210000-00019. [DOI] [PubMed] [Google Scholar]
- 23.Jones DP, Richey PA, Alpert BS. Validation of the AM5600 in children and adolescents. Blood Press Monit. 2008;13:349–351. doi: 10.1097/MBP.0b013e3283102cfe. [DOI] [PMC free article] [PubMed] [Google Scholar]
- 24.Kuczmarski RJ, Ogden CL, Grummer-Strawn LM, Flegal KM, Guo SS, Wei R, et al. CDC growth charts: United States. Adv Data. 2000;314:1–27. [PubMed] [Google Scholar]
- 25.Urbina E, Alpert B, Flynn J, Hayman L, Harshfield GA, Jacobson M, et al. Ambulatory blood pressure monitoring in children and adolescents: recommendations for standard assessment: a scientific statement from the American Heart Association Atherosclerosis, Hypertension, and Obesity in Youth Committee of the council on cardiovascular disease in the young and the council for high blood pressure research. Hypertension. 2008;52:433–451. doi: 10.1161/HYPERTENSIONAHA.108.190329. [DOI] [PubMed] [Google Scholar]
- 26.Bland JM, Altman DG. Statistical methods for assessing agreement between two methods of clinical measurement. Lancet. 1986;1:307–310. [PubMed] [Google Scholar]
- 27.McGinn T, Wyer PC, Newman TB, Keitz S, Leipzig R, For GG. Tips for learners of evidence-based medicine: 3. Measures of observer variability (kappa statistic) CMAJ. 2004;171:1369–1373. doi: 10.1503/cmaj.1031981. [DOI] [PMC free article] [PubMed] [Google Scholar]
- 28.Portman RJ, Yetman RJ, West MS. Efficacy of 24-h ambulatory blood pressure monitoring in children. J Pediatr. 1991;118:842–849. doi: 10.1016/s0022-3476(05)82193-6. [DOI] [PubMed] [Google Scholar]
- 29.Lurbe E, Redon J, Liao Y, Tacons J, Cooper RS, Alvarez V. Ambulatory blood pressure monitoring in normotensive children. J Hypertens. 1994;12:1417–1423. [PubMed] [Google Scholar]
- 30.Kavey RE, Kveselis DA, Atallah N, Smith FC. White coat hypertension in childhood: evidence for end-organ effect. J Pediatr. 2007;150:491–497. doi: 10.1016/j.jpeds.2007.01.033. [DOI] [PubMed] [Google Scholar]