Abstract
We conducted a genome-wide association pooling study for cutaneous melanoma and performed validation in samples totalling 2019 cases and 2105 controls. Using pooling we identified a novel melanoma risk locus on chromosome 20 (rs910873, rs1885120), with replication in two further samples (combined P <1 × 10-15). The odds ratio is 1.75 (1.53, 2.01), with evidence for stronger association in early onset cases.
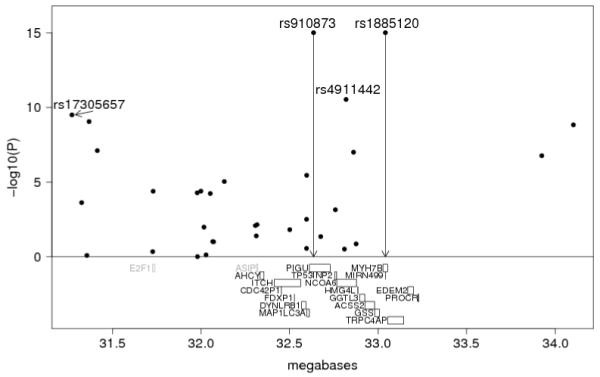
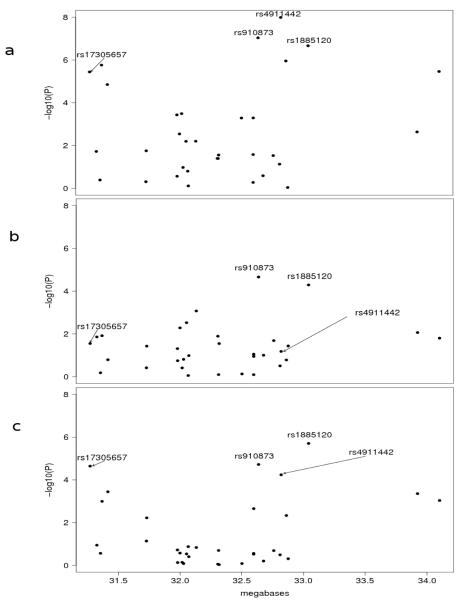
Cutaneous melanoma is an important health problem in fair-skinned populations worldwide and its incidence is rising in most1. An understanding of the genetic factors influencing melanoma risk and the identification of susceptible individuals may aid in increasing sun protection and early detection of the disease in populations at risk. Four high penetrance melanoma loci have been identified (CDKN2A, ARF, CDK4, and a locus on 1p22)2, and MC1R has been validated as a low penetrance gene3,4. To identify additional low penetrance genes we carried out a genome-wide association study (GWAS) using pooling of 864 cases drawn from a larger population based sample of cases from Queensland, unselected for age-at-onset (Queensland study of Melanoma: Environment and Genetic Associations (Q-MEGA)5) and 864 controls (Q1). Each pool was hybridized to six Illumina HumanHap550 arrays, and SNPs were ranked after accounting for pooling error6,7. The proportion of SNPs with p-values from pooling less than 0.01 was consistent with what would be expected by chance if there were no true associations. Conversely, at smaller p-value thresholds, there were more SNPs than expected by chance - for example, at the 0.0001 threshold, we would expect to see ~55 SNPs under the null hypothesis of no association but we in fact observed 90 SNPs, indicating there are a number of true associations (Supplementary Notes online). Here we focus on only the most significant finding from pooling. The 1st (rs17305657, p=2.56 × 10⁻⁷) and 4th (rs4911442, p=2.39 × 10⁻⁶) top-ranked SNPs are 1.5 megabases apart on chromosome 20. Multiple other SNPs in the region showed evidence for association (Supplementary Fig. 1 online). When the pooling results were validated by individual genotyping, concordance was excellent; rs17305657, p=3.63 × 10⁻⁶; rs4911442, p=1.03 × 10⁻⁸. To fine map this region we selected 31 additional SNPs, which span ~2.78 Mb in chromosome bands 20q11.21-q11.22 (Supplementary Methods online). Selection was based on candidate genes, pooling results, ethnic frequency differences and linkage disequilibrium (LD) patterns (i.e. SNPs correlated with both rs17305657 and rs4911442, Supplementary Methods online). The set of 33 SNPs was then genotyped in three sample sets: 789 cases and 854 controls from the pooled Q-MEGA subjects (Q1); a second set of 725 cases and 797 controls sampled independently from Q-MEGA (Q2); and 505 cases and 454 controls (A1) from an independent population-based case-control-family study of melanoma diagnosed before age 40 years, ascertained in Brisbane, Melbourne and Sydney (Australian Melanoma Family Study, A. Cust, unpublished data). The combined sample comprised 2019 cases and 2105 controls of European descent. All cases had incident primary melanomas (stage 1). Fig. 1 shows the association results for Q1, Q2 and A1 (see also Supplementary Tables 1-5 online). Several SNPs showed stronger evidence for association than the two SNPs identified using the HumanHap550 array. In each of the samples, two SNPs were highly associated with melanoma, rs910873 and rs1885120 (Fig. 1), with combined P <1 × 10-15 (Fig. 2).
Figure 1.
Association analysis of SNPs across a region of chromosome 20q11.22. P-values for association testing for the three samples a, Q1; b, Q2; c, A1 are shown.
Figure 2.

Association analysis of SNPs across a region of chromosome 20q11.22 for the combined sample. Genes from AHCY to PROCP are shown in black; two candidate genes, E2F1 and ASIP, are shown in grey.
To distinguish the association due to nearby loci we analysed multiple SNPs jointly by logistic regression. The effects of rs910873 and rs1885120 could not be separated (fitting one in the model rendered the other redundant, r2>0.9 both in cases and controls). Given the high r2 value between rs910873 and rs1885120, we cannot unambiguously identify the interval in which the causal variant(s) lie. When either was fitted in the logistic regression, all other SNPs typed in the vicinity were redundant (Supplementary Table 6 online). There was some evidence for residual association around rs17305657, indicating there may be two independent signals in this region of chromosome 20 (either in the same or different genes). Alternatively, both SNPs may be in incomplete LD with a single causal variant.
We tested whether the observed association at rs910873 was explicable by any of the obvious candidate genes in the region. SNPs rs2071054 and rs3213182 lie in or near E2F1, which encodes a transcription factor regulated by the retinoblastoma protein, but neither showed evidence for association once the effect of rs910873 (or rs1885120) was accounted for (Supplementary Table 6). Similarly, rs819163, rs6059743, rs819162, within or adjacent to ASIP, showed little evidence for residual association (smallest p=0.062, Supplementary Table 6). ASIP encodes the human ortholog of the murine agouti gene product, a paracrine signaling molecule and antagonist of alpha-melanocyte-stimulating hormone (the ligand of the MC1R gene product), which regulates synthesis of melanin. In humans, a SNP in the 3′-untranslated region of ASIP has been associated with variation in pigmentation8,9,10 but has not been independently associated with nevi or melanoma risk4,8,10. Although we have not genotyped all variants in ASIP and E2F1, our findings provided stronger evidence that a risk variant for melanoma lies in a more telomeric region that includes several other candidate loci. It is noteworthy that rs910873 (and by LD rs1885120) is only polymorphic in Caucasian (CEU) and not in Asian (JPT/CHB) or African (YRI) HapMap samples. Furthermore in our data, the frequency of the risk alleles for rs910873 and rs1885120 is significantly higher in melanoma cases (frequency 0.15) than controls (frequency 0.09). Since population stratification may cause false positive associations in non-homogeneous samples we assessed the self-reported ancestry for all 4 grandparents in a subset of 1779 controls and 597 cases from Q1/Q2 for which data were available. The vast majority of controls (N=1438) and cases (N=585) reported 100% Northern European ancestry (others had one or more grandparents with Southern European ancestry). In the Northern European subset, allele frequencies were very similar (within 0.01) to those found in the whole sample, implying that population stratification (even within Europe) could not explain the results.
To further describe the phenotypic associations of the peak SNPs, we examined age-at-onset using rs910873. In Q1 and Q2 we used two criteria, ≤40 and ≤30. Since all A1 cases had age-at-onset ≤40 years, we stratified this sample only at ≤30. Results for Q2 indicated that the age-at-onset threshold of ≤40 was important (≤40 subset OR, 1.83 (1.39, 2.41); >40 subset OR, 1.30 (1.00, 1.69)) but that the ≤30 threshold was not (≤30 subset OR, 1.82 (1.31, 2.53)). Examining only the Q2 case sample, there was a significant effect of the rs910873 risk allele when age-at-onset was analysed as a quantitative trait (p=0.03, Supplementary Notes). In A1 the association in the ≤30 subset (OR 1.77 (1.22, 2.57)) was weaker than that in the >30 subset (OR 1.87 (1.40, 2.51)). Age-at-onset was not significant in Q1 (data not shown), the discovery sample which was ascertained without respect to age-at-onset. Overall, rs910873 (and through LD, rs1885120) appears related to early onset. To provide an unbiased estimate of the odds ratio and population attributable fraction (PAF) we used the two replication samples Q2 and A1. The ORs were 1.72 (1.48, 2.14) and 1.81 (1.52, 2.17) for all cases and ≤40 age-at-onset, respectively. The PAFs in these samples from the Australian population were 0.06 (0.04, 0.09) and 0.07 (0.04, 0.09) for all cases and ≤40 age-at-onset, respectively.
The most strongly associated region between rs910873 and rs1885120 is ~400 kb in length. Rs1885120 maps within an intron of MYH7B (myosin, heavy polypeptide 7B, cardiac muscle, beta), which is not expressed in a large panel of melanoma cell lines analysed11. Rs910873 maps within an intron of PIGU (also known as CDC91L1) which encodes phosphatidylinositol glycan anchor biosynthesis class U, and is expressed in all melanoma cell lines assessed, as are TP53INP2 (tumor protein p53 inducible nuclear protein 2), NCOA6 (nuclear receptor coactivator 6), GGTL3 (gamma-glutamyltransferase-like 3), ACSS2 (acyl-CoA synthetase short-chain family member 2), and GSS (glutathione synthetase), the other genes that map between these two SNPs.
In summary, we have identified a novel melanoma risk locus and replicated this association in two independent samples, with a combined P <1 × 10-15. The effect size for melanoma associated with this genomic region is of similar magnitude to that associated with MC1R (OR ~2, PAF ~0.1 for heterozygotes)3,4, the only robustly replicated low penetrance melanoma predisposition gene identified to date. Identification of the causal variants associated with melanoma predisposition at 20q11.22 will help refine the estimates of risk for this increasingly common cancer.
Supplementary Material
ACKNOWLEDGEMENTS
This work was supported by the National Institutes of Health/National Cancer Institute (CA88363, CA83115), the National Health and Medical Research Council of Australia (NHMRC) (380385, 389892, 496675, 402761), the Cancer Councils NSW, Victoria and Queensland, the Cancer Institute New South Wales, the Melanoma Research Foundation (MRF) and a charitable contribution from F. Najafi. NKH and GWM are supported by the NHMRC Fellowships scheme and JLH is an Australia Fellow of the NHMRC. SM and KMB are recipients of Career Development Awards from the NHMRC (496674) and MRF respectively. KMB is supported by the National Institutes of Health/National Cancer Institute (CA109544, CA083115). JMT is supported by the National Institutes of Health/National Cancer Institute (CA109544). DAC is supported by the National Heart, Lung, and Blood Institute (HL086528). BKA is supported by the University of Sydney Medical Foundation. AEC is supported by a NHMRC postdoctoral fellowship. We are grateful to Matthew Huentelman and Szabolcs Szelinger for technical assistance. The AMFS and Q-MEGA gratefully acknowledges all its participants, the hard work of all its research interviewers and examiners, and of Chantelle Agha-Hamilton in managing the AMFS biospecimens. Q-MEGA thanks Amanda Baxter, Monica de Nooyer, Isabel Gardner, Dixie Statham, Barbara Haddon, Jane Palmer, Belinda Castellano, Lisa Bardsley, David Smyth, and Harry Beeby for their input into project management, sample processing and database development.
Footnotes
COMPETING INTERESTS STATEMENT
The authors declare no competing financial interests.
REFERENCES
- 1.Lens MB, Dawes M. Br. J. Dermatol. 2004;150:179–185. doi: 10.1111/j.1365-2133.2004.05708.x. [DOI] [PubMed] [Google Scholar]
- 2.de Snoo FA, Hayward NK. Cancer Lett. 2005;230:153–186. doi: 10.1016/j.canlet.2004.12.033. [DOI] [PubMed] [Google Scholar]
- 3.Palmer JS, et al. Am. J. Hum. Genet. 2000;66:176–186. doi: 10.1086/302711. [DOI] [PMC free article] [PubMed] [Google Scholar]
- 4.Landi MT, et al. J. Natl. Cancer Inst. 2005;97:998–1007. doi: 10.1093/jnci/dji176. [DOI] [PubMed] [Google Scholar]
- 5.Baxter A, et al. Twin Res. Hum. Genet. 2008;11:183–96. doi: 10.1375/twin.11.2.183. [DOI] [PMC free article] [PubMed] [Google Scholar]
- 6.Macgregor S, et al. Nucleic Acids Res. 2008;36:e35. doi: 10.1093/nar/gkm1060. [DOI] [PMC free article] [PubMed] [Google Scholar]
- 7.Macgregor S, et al. Nucleic Acids Res. 2006;34:e55. doi: 10.1093/nar/gkl136. [DOI] [PMC free article] [PubMed] [Google Scholar]
- 8.Kanetsky PA, et al. Am. J. Hum. Genet. 2002;70:770–775. doi: 10.1086/339076. [DOI] [PMC free article] [PubMed] [Google Scholar]
- 9.Bonilla C, et al. Hum. Genet. 2005;116:402–406. doi: 10.1007/s00439-004-1251-2. [DOI] [PubMed] [Google Scholar]
- 10.Meziani R, et al. J. Dermatol. Sci. 2005;40:133–136. doi: 10.1016/j.jdermsci.2005.08.001. [DOI] [PubMed] [Google Scholar]
- 11.Johansson P, Pavey S, Hayward N. Pigment Cell Res. 2007;20:216–221. doi: 10.1111/j.1600-0749.2007.00375.x. [DOI] [PubMed] [Google Scholar]
Associated Data
This section collects any data citations, data availability statements, or supplementary materials included in this article.


