

Abstract
The ability of three dithiolethione cancer chemopreventives - oltipraz 1, anetholedithione (ADT) 2, 1,2-dithiole-3-thione (D3T) 3 and the major metabolite, 4, of 1 - to induce the cytoprotective enzyme NQO1 in hepa 1c1c7 cells and the inhibition of this induction by catalase is demonstrated. The ability of 1, 3 and 4 to form O2• has been reported, and it is here demonstrated that 2 decomposes in the presence of GSH to form, upon addition of the nitrone spin trap DMPO, the DMPO-OH adduct that is detectable by epr. Decomposition of 2 in the presence of GSH elicits, upon the addition of hydroethidine and excitation at 510 nm, fluorescence at 580 nm that is diminished by the addition of superoxide dismutase. The compound 4, is product of reduction of 1 and it is demonstrated that 2 and 3 decompose in the presence of reductants such as thiolates and NaBH4, followed by addition of CH3I, to form the dimethylated products of reductive cleavage of the S1-S2 bond. The same products are isolated subsequent to lysis in buffer containing CH3I of Hepa 1c1c7 cells treated with 2 or 3. Reductive cleavage of 2 and 3 in aqueous ethanol by NaBH4 in an argon atmosphere, followed by acidic destruction of remaining borohydride and neutralization and introduction of O2 results in the reformation of 2 and 3 to the extent of 80 and 33%, respectively. The data in toto are consistent with a model in which dithiolethiones, generally, undergo reductive cleavage in Hepa 1c1c7 cells thereby resulting in the generation of O2• that dismutates to H2O2, that subsequently, by direct or indirect means, effects the nuclear translocation of transcription factor Nrf2, that upregulates phase 2 enzyme expression.
Introduction
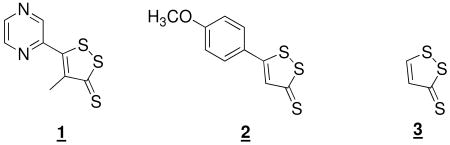
1,2-Dithiole-3-thiones are a large class of compounds containing the title pharmacophore, depicted in the three most well-known members 1 (oltipraz), 2 (anethole dithiolethione – ADT) and 3 (1,2-dithiole-3-thione – D3T), below, many members of which demonstrate chemopreventive potential against environmental carcinogens and oxidative stress in wide range of in vitro and animal models. (1-7) Human clinical trials of 1 and 2 indicate that certain dosing regimes of 1 can increase deactivated aflatoxin metabolites in populations exposed to aflatoxins of dietary origin (8) while 2 decreases pre-neoplastic lung dysplasias in smokers. (9) Neuropathies and phototoxicity in human studies limit the further development of 1, (10) though these complications are not known to inhere in the class of compounds. Indeed 2 is actively employed (Sulfarlem) in many countries both in the treatment of hyposialia in Sjögren's syndrome and as a stimulant of lachrymal flow. The compound 3 was reportedly isolated from some edible cabbages and kale, (11) but a later report failed to find 3 from cabbage of the same species from an alternate source. (12) There is therefore ongoing interest in the mechanism(s) of cancer chemoprevention by this class in hopes of a viable clinical entity. (13)
Chemopreventive potential of dithiolethiones is in part imbued by upregulation of phase 2 enzymes that provide enhanced protection to electrophilic and oxidative assault. (14-18) Upregulated transcription is effected by transcription factor Nrf2 in concert with small Maf proteins that target the cis-acting anti-oxidant response element (ARE) preceding the transcribed regions of many genes that code for the cytoprotective proteins. Nrf2 in the cytoplasm is sequestered by the protein Keap1 which facilitates its ubiquitination and proteosomal degradation. Keap1 is a cysteine rich protein, the human form contains 27 such residues, and is believed to be the target of many cancer chemopreventives that upregulate the expression of phase 2 enzymes. A number of hypotheses have been advanced but it is currently unclear whether free Keap1, or Keap1 bound to one or more of the proteins in a complex, is the actual target of the electrophiles and oxidants. (19-30)
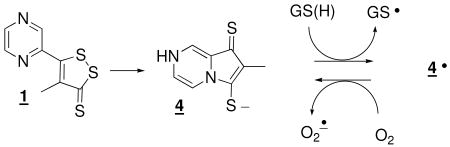
The molecular mechanism whereby dithiolethiones effect modification of Keap1, and thereby upregulate the expression of phase 2 enzymes, has not been elucidated. It was originally proposed that they act as electrophiles at the nucleophilic cysteine residues of Keap1, effecting a disulfide closure. (3) There is chemical precedent of their electrophilicity towards thiolates. (31-33) An analysis of the chemical reactivity toward dithiols and thiols cast doubt on the basis for the original proposal and established a lack of concordance between chemical reactivity of various dithiolethiones and their varying potencies as phase 2 enzyme inducers. (34) The Gates group established that dithiolthiones in the presence of thiols, metal ions and oxygen generated reactive oxygen species that were detectable by the formation of DNA strand breaks and it was speculated that the action of dithiolthiones might be due to their initiation of an oxidative assault. (35) It was later established that the major metabolite of 1, 4, viewed as electrophilically inactive, was a phase 2 enzyme activator of similar potency to 1 and also a generator of superoxide radical anion (O2•), passing reducing equivalents from GSH to O2 in a redox cycle, as in eq 1. (36, 37) Other dithiolethiones do not have the potential to form the pyrrolopyrazine metabolite which leads to the question of the generality
 |
(1) |
of this mechanism. Though, most recently it has been shown that 3 also reacts with thiols in oxygen-containing buffers leading to oxygen consumption and the production of O2•. (38)
The present investigation was carried out to determine the generality of reactive oxygen species as important intermediates in the phase 2 enzyme induction by dithiolethiones, and if possible to understand the chemical basis for this. It is concluded that hydrogen peroxide, derived from superoxide radical anion, is a second messenger for enzyme induction by dithiolethiones and that the common progenitors of these reactive oxygen species are the reductive metabolites of dithiolethiones.
Experimental
Materials
Compounds 1 and 3 were kindly provided by the Chemoprevention Branch, National Cancer Institute, Rockville, MD. Compound 2 was synthesized according to a previously published method. (39) The structure was confirmed by 1H NMR, 13C NMR, HMQC, HMBC, APCI-MS, and UV. The synthesis and characterization and use of stable prodrugs to 4 has been reported. (36, 40)
Effect of catalase on NQO1 induction by 1- 4
Five thousand Hepa 1c1c7 cells were plated in 96 well micoliter plates and incubated at 37°C for 24 h. The growth medium was decanted and columns 1-6 were treated with growth medium, while columns 7-12 were treated with growth medium containing 1000U of catalase/mL. Cells were again incubated at 37°C for 18 h. The growth medium was decanted and columns 1-6 were treated with growth media and dithiolethione, while columns 7-12 were treated with growth media, dithiolethione, at various concentrations – see Results, and 1000U of catalase/mL. Cells were incubated for 48 h. at 37°C and then washed with phosphate buffered saline (PBS), and then lysed by successive rounds of freezing and thawing under 50μL of PBS. NQO1 activity was determined by spectrophotometric analysis as described previously. (36) The specific activity of NQO1 was normalized against total protein concentration as determined by a BCA assay of cell lysates treated under identical conditions.
EPR analysis of the thiolytic decay of compound 2
Compound 2, at a final concentration of 0.5 mM, was suspended in 0.1M argon-purged phosphate buffer pH 7.4, containing 5 mM glutathione (GSH) and 0.1mM diethylene triamine pentaacetic acid (DTPA). 5,5-Dimethyl-1-pyrroline-N-oxide (DMPO) was added, to a final concentration of 50 mM and EPR spectra were taken as a function of time. Compound 2 was also suspended, at a final concentration of 0.5 mM, in the same reaction solution in an argon tent. The reaction was incubated at room temperature for 60 h. After incubation the reaction mixture was stirred in ambient oxygen for 1 h. DMPO was added, at a final concentration of 50mM, and EPR spectra were collected as a function of time. EPR spectra were recorded using quartz flat cells at room temperature with a Bruker ESP 300E spectrometer operating at X-band with 100 KHz modulation frequency and a TM110 cavity.
Thiolytic decay of 2 in the presence of hydroethidine
The reaction of an argon purged solution of 2, 0.5 mM, in 0.1 M phosphate buffer (pH = 7.4) containing 100 μM diethylene triamine pentaacetic acid (DTPA), 15% by volume acetonitrile was initiated by addition of GSH to a final concentration of 5mM. The reaction was maintained at room temperature in an argon tent for 2 h. The reaction was then exposed to ambient oxygen and stirred for 1 h. The reaction mixture was partitioned into two equal volumes. Hydroethidine (HE) was added directly, to a final concentration of 0.1 mM, to one of the aliquots with superoxide dismutase, at a final concentration of 0.10 mM, and HE, at a final concentration 0.1 mM were added to the second aliquot. The emission intensity at 580 nm was monitored as a function of time using a Horiba Jobin Yvon flourolog fluorimeter.
Reductive cleavage and methylation: Thiolytic reduction
Both compounds 2 and 3 were subjected to cleavage and methylation by the method described for 2, below. Differences in the procedure with compound 3 are summarized at the end. Compound 2, 50 mg, and NaSCH3, 175 mg, were added to a 10 mL reaction flask. The reaction flask was flushed with argon for 5 min. To this was added 500 μL of 15-crown-5 ether and 7 mL of argon-saturated dimethylformamide (DMF). The reaction was carried out under positive argon pressure at room temperature and monitored by TLC – hexane/ethyl acetate (3/2). The solution turned a deep red over the first hour of reaction. Upon completion of the reduction (48 h) 250 μL of methyl iodide was added whereupon the solution turned a light orange in a matter of minutes. After stirring at room temperature for 30 min. the solvent was removed via rotary evaporation. The resulting material was suspended in 50 mL dichloromethane, and 25 mL of water was added. The organic layers were separated and the aqueous phase was extracted twice more with dichloromethane. The combined organic layers were stirred over Na2SO4 for 1h. The solution was then filtered and the solvent was removed via rotary evaporation. A fraction corresponding to the major spot on TLC was isolated by chromatography on silica gel using chloroform/methanol (19/1) as eluant. Further purification was performed via semi-preparative HPLC. Analysis of material by analytical HPLC reveals a mixture of two compounds, which appear as two peaks which are fused at the baseline, with UV profiles having λmax = 359.6 and 380.6 nm, respectively. Isolation and subsequent re-injection of either peak resulted in chromatograms containing both of the two original peaks in a ratio identical, within 10%, to that observed in the first injection. HPLC coupled APCI-MS analysis revealed an m/z = 270.0, 223.1 for both compounds. Exact [M+H]+ mass obsd: 271.02832, calcd: 271.02849. 1H NMR (400 MHz CH2Cl2) Major component: δ 7.25 (m, 2H), 7.13 (s, 1H), 6.92 (d, 2H), 3.81 (s, 3H), 2.59 (s, 3H), 1.93 (s, 3H). Minor component: δ 7.26 (m, 2H), 6.85 (d, 2H), 6.71 (s, 1H), 3.80 (s, 3H), 2.44 (s, 3H), 2.36 (s, 3H). 13C NMR (400 MHz CHCl3) Major component: δ 215.60, 160.11, 159.43, 131.28, 130.73, 129.62, 114.10, 55.47, 19.00, 17.55. Minor component: δ 222.28, 160.74, 152.92, 131.84, 129.45, 128.66, 114.00, 55.37, 20.28, 16.66.
The product of the reaction of 3 was similarly obtained following silica gel chromatography using hexane/ethyl acetate (9/1) as eluant. Analysis of material by analytical HPLC revealed a mixture of two compounds with UV profiles having λmax = 366.1 and 345.9 nm, respectively. Isolation and subsequent re-injection of either peak resulted in chromatograms containing both of the two original peaks in a ratio identical, within 10%, to that observed in the first injection. HPLC-ACPIMS analysis yielded [M+H]+ = 165.0, and [M+Na]+ = 187.0 for both compounds. 1H NMR (400 MHz CHCl3) Major component: δ 5.65 (d, 1H), 4.99 (d, 1H), 2.29 (s, 3H), 2.27 (s, 3H). Minor component: δ 7.96 (d, 1H), 6.70 (d, 1H), 2.64 (s, 3H), 2.37 (s, 3H). 13C NMR (400 MHz CHCl3) Major component: δ 205.36, 128.56, 123.23, 50.63, 16.76. Minor component: δ 215.53, 161.54, 136.54, 29.78, 17.41.
Reductive cleavage and methylation: NaBH4 reduction
Similar procedures were employed for both compounds 2 and 3, differences in the procedure in the case of compound 3 are indicated further below. Compound 2, 50mg, and NaBH4, 16 mg, were added to a 10mL reaction flask. The reaction flask was flushed with argon for 5 min. To this, 15-crown-5 ether, 86 μL, and 7 mL of argon-purged ethanol were added. The reaction was carried out under positive argon pressure at room temperature and monitored by TLC – hexane/ethyl acetate (3/2). The solution turned a deep red within minutes. Upon completion of the reduction (1.5 h) 200 μL of methyl iodide was added. The solution turned a light orange within minutes. After stirring at room temperature for 30 min. the solvent was removed via rotary evaporation. The resulting material was suspended in 50 mL dichloromethane, and 25 mL of water was added to effect extraction. The organic layer was isolated and the aqueous layer was extracted two more times with similar volumes of dichloromethane. To the combined organic layers was added Na2SO4 and the suspension was stirred for 1h. The solution was then filtered and the solvent was removed by rotary evaporation. The product was isolated with silica column chromatography using hexane/ethyl acetate (4/1) as eluant. Analysis of this material by analytical HPLC reveals a chromatogram containing two peaks fused at the baseline, with λmax = 359.6 and 380.6 nm, respectively, and with retention times identical with material isolated from thiolytic reduction and methylation. HPLC coupled APCI-MS analysis exhibits a parent ion and major fragment ion an m/z = 270.0 and 223.1, respectively, for both compounds. 1H NMR (400 MHz CH2Cl2) Major component: δ 7.25 (m, 2H), 7.13 (s, 1H), 6.92 (d, 2H), 3.81 (s, 3H), 2.59 (s, 3H), 1.93 (s, 3H). Minor component: δ 7.26 (m, 2H), 6.85 (d, 2H), 6.71 (s, 1H), 3.80 (s, 3H), 2.44 (s, 3H), 2.36 (s, 3H).
In the case of compound 3, the final product was isolated by silica gel chromatography using hexane/ethyl acetate (9/1) as eluant. Analysis of material by analytical HPLC reveals two baseline-separable components having λmax = 366.1 and 345.9 nm, respectively, for both compounds and with retention times identical with material isolated from thiolytic reduction and methylation. 1H NMR (400 MHz CHCl3) Major component: δ 5.65 (d, 1H), 4.99 (d, 1H), 2.29 (s, 3H), 2.27 (s, 3H). Minor component: δ 7.96 (d, 1H), 6.70 (d, 1H), 2.64 (s, 3H), 2.37 (s, 3H).
Metabolite Trapping/Extraction
One million Hepa 1c1c7 cells were plated in a 75 cm2 flasks and incubated over night at 37°C. The growth media was then decanted and replaced with fresh media containing either 15μM 2 or 5μM 3. Treated cells were incubated at 37°C for 48 h. The growth media was decanted and the cells were washed with PBS. They were then treated with 6 mL of 0.25% trypsin. After 5 min. the cells were added to a centrifuge tube and spun at 2000 rpm for 10 min. The buffer was removed from the cell pellet, and 1 mL of lysis buffer, containing 0.5M phosphate buffer pH 7.2, 1mM EDTA, 1% (v/v) Triton X-100, and methyl iodide was added to a final concentration of 0.17 M. The cell pellet was homogenized by shearing the cells through a 22 gauge needle multiple times. The resulting lysate was incubated at room temperature for 25 min. A 50 mL volume of saturated NaCl was added to the lysate and the solution was extracted with 20 mL volumes of dichloromethane each of three times. The organic layer was dried over Na2SO4 for 1h, filtered, and the solvent was removed via rotary evaporation. The resulting material from the cultures treated with 2 was analyzed by HPLC-MS, while the material from cultures treated with 3 was analyzed by HPLC.
Oxidation of reduced 2 and 3 by molecular oxygen
Either 13.5 mg of 3 or 5 mg of 2 were suspended in 5 mL of EtOH. The solution was brought to a final volume of 20 mL with deionized H2O. To this solution was added 40 mg NaBH4. The reduction was monitored by analytical HPLC. In the case of 3 the reaction was monitored for 40 min, while the reaction of 2 was monitored for 1 h. Acetic acid was then added to quench excess NaBH4. This was followed by the addition of 1 mL of 1 M phosphate buffer, pH 7.2. The resulting solution was bubbled with O2 for 10 min and analyzed by HPLC.
Results
Effect of catalase on NQO1 induction by dithiolethiones
Induction of the phase 2 enzyme NQO1 by dithiolethiones is depicted in Figure 1A-D for 1-4, in the presence and absence of catalase for each compound. The values of CD, the concentration of drug required to double enzyme activity, for each of the drugs in the absence of catalase are 14, 12, 2 and 9 μM, respectively, which is comparable with what has been previously reported. (36, 41, 42) In the case of 1 it was possible to measure CD = 30 μM, when drug was co-incubated with catalase. While for the metabolite 4, the value of CD more than doubled, to a value of 26 μM. In the case of 2 and 3, the CD value could not be estimated in the presence of catalase, but inspection of Fig. 1C and 1D for the concentrations required to increase activity by 50% suggest the potency decreases in the presence of catalase similarly by somewhat more than a factor of 2. In control experiments with 1, cells were co-treated with the following proteins at concentrations identical with catalase (above) and the upper limits for decreases in CD, compared to cells + 1 alone, are indicated in parantheses: of yeast phosphoglucoisomerase (<10%), yeast phosphoglucoisomerase (<15%) or spinach aldolase (<10%).
Figure 1. The effect of catalase on the NQO1 induction potency of compounds 1-4.
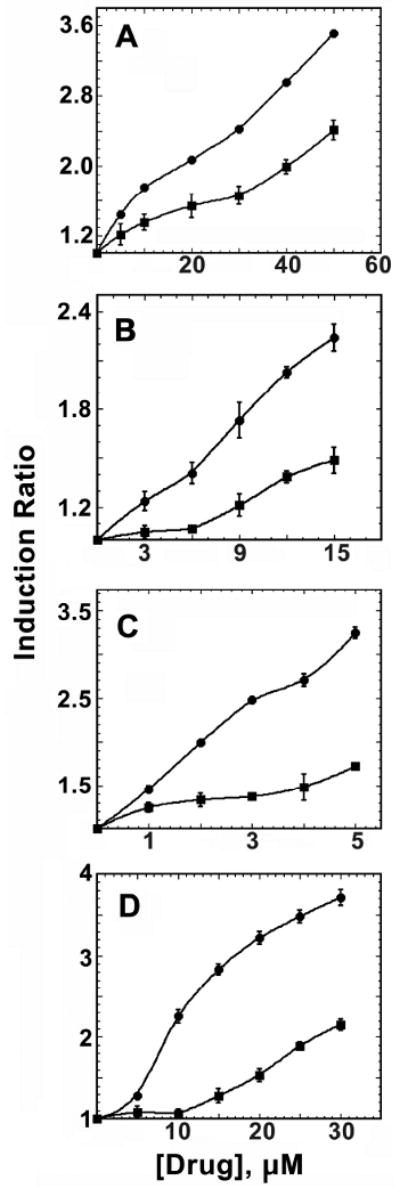
Hepa 1c1c7 cells were plated in growth medium and incubated for 18 h. Half of the plate was then treated with growth media while the other half was treated with growth medium plus 1000 U/mL of catalase. After a 24 h incubation, the medium was decanted and fresh medium containing either; (A) compound 1. (B) compound 2. (C) compound 3. (D) compound 4. The cells were treated for 48 h, then lysed and assayed for both total protein concentration and NQO1 activity. Circles indicate compound alone while squares indicate compounds co-treated with catalase.
Reduction of dithiolethiones
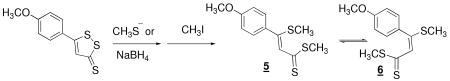
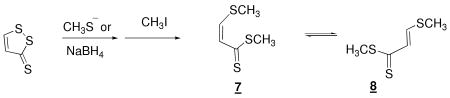
Treatment with excess methanethiolate in the solvent DMF, followed by addition of CH3I converts dithiolethiones 2 and 3 to isomeric reduced dimethylated forms. This is indicated by 1H- and 13C-NMR and high resolution mass spectrometry in the case of 2 and 1H- and 13C- NMR and low resolution mass spectrometry in the case of 3. In the cases of both, as in equations 2 and 3, the products
 |
(2) |
 |
(3) |
are a pair of isomers in agreement with what was reported for other compounds of this class by Fleury. (31, 32) Injection of the purified mixtures of isomers on an HPLC allows nearly baseline separation, as indicated in Figure 2A and 2B, but isolation of either form followed by re-injection results in a chromatogram containing both forms, in the original proportion (not shown). Reduction of dithiolethiones is more facilely accomplished with NaBH4 and the dimethylated forms can be similarly isolated (data not shown).
Figure 2. HPLC separation of isomers of reduced dimethylated products of reactions of 2 and 3.
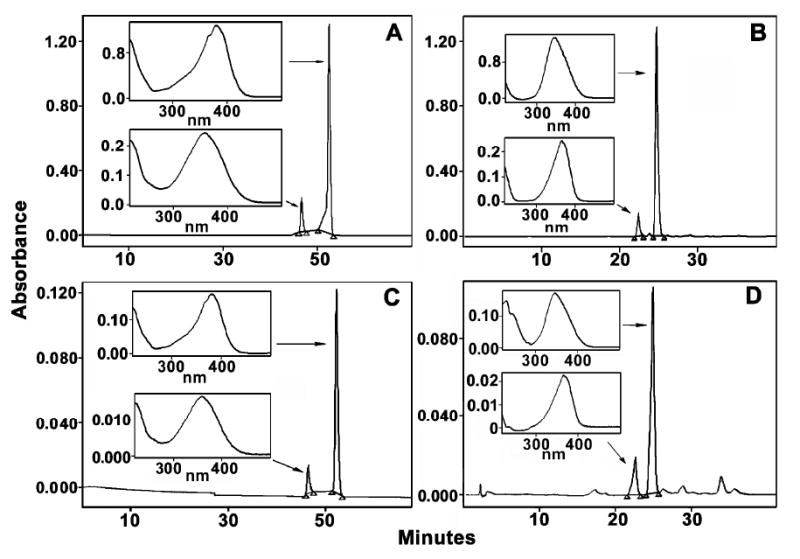
(A) Chromatogram, monitored at 370 nm, of products of the reaction of 2 with methanethiolate in DMF, followed by treatment with excess CH3I and purification by silica gel chromatography. (B) Chromatogram, monitored at 366 nm, of products of the reaction of 3 with methanethiolate in DMF, followed by treatment with excess CH3I and purification by silica gel chromatography. (C) Chromatogram, monitored at 370 nm, of products drived from a CH2Cl2 extract of CH3I-containing lysate of Hepa 1c1c7 cells treated with 2. (D) Chromatogram, monitored at 366 nm, of products drived from a CH2Cl2 extract of CH3I-containing lysate of Hepa 1c1c7 cells treated with 3. See Experimental and Results for further details.
The chromatograms Figure 2C and 2D indicate that the same compounds are isolated from Hepa 1c1c7 cells treated with 2 and 3, respectively, when lysed in a buffer containing CH3I.
Thiolytic reduction of 2 is accompanied by the formation of reactive oxygen species. Figure 3 indicates the EPR spectrum of solutions in which 2 was decomposed, in an argon atmosphere for zero, 120 and 360 min in a phosphate buffered saline solution containing 10 mM GSH, and subsequently, DMPO was added and the solutions were exposed, with stirring, to ambient oxygen prior to transfer to the flat cell. Controls lacking either 2 or GSH generated baseline spectra with no obvious features (data not shown). Fig 4, upper trace, indicates fluorescence intensity at 580 nm as a function of time of a solution of 35 μM 2 treated with 5 mM 2 for 120 min in an argon atmosphere which was subsequently stirred in ambient air and to which was added hydroethidine (final concentration = 0.1 mM). The lower trace in Fig. 4 represents an identical experiment with the exception that, prior to addition of hydroethidine, CuZn superoxide dismutase was added to a final concentration of 100 μM. Controls containing 2 only or glutathione only exhibit no fluorescence at 580 nm over this time period (data not shown)
Figure 3. EPR spectrum of DMPO-OH formed from 2 in the presence of GSH, the nitrone spin trap DMPO and ambient oxygen.
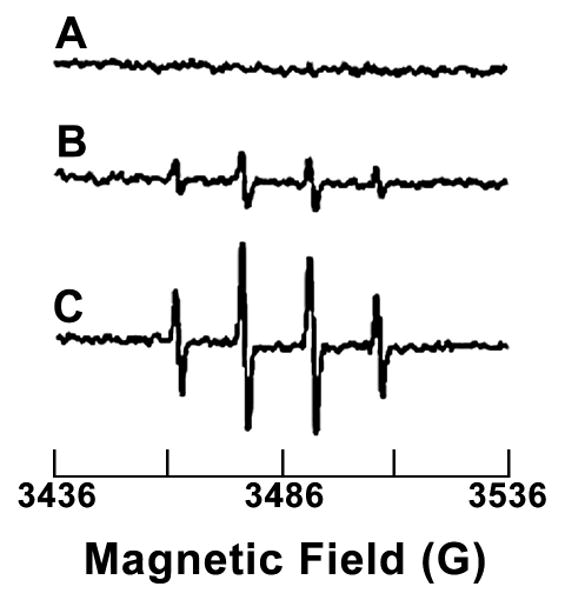
Compound 2, 0.5mM in 0.1M phosphate buffer pH 7.4, containing 5 mM GSH and 0.1mM diethylene triamine pentaacetic acid (DTPA) was allowed to react for various times in an argon atmosphere and subsequently 5,5-dimethyl-1-pyrroline-N-oxide (DMPO) was added to a concentration of 50 mM and the sample was exposed to ambient air and EPR spectra were recorded. Reaction times were (A) t = 0 h, (B) t = 2 h and (C) t = 60 h.
Figure 4. Fluorescence detection (580 nm) with hydroethine in the reaction of 2 with GSH.

Compound 2, 0.5 mM was decomposed with 0.005 M GSH under argon for two hours. The reaction mixture was then exposed to ambient oxygen for 1 h, at which time either HE was added. Upper trace, no other reagents present. Lower trace, SOD was added prior to the addition of HE. See Experimental and Results for further details.
Oxidation of reduced dithiolethiones
The nature of the reaction of the products of reduction of dithiolethiones with O2 was investigated. Reversal of reduction upon exposure to O2 is indicated by inspection Fig. 5A-C for compound 2 and Fig. 5D-F for compound 3. Chromatograms 5a and 5d are injections of solutions of dithiolethones in 20% ethanol – 80% H2O. The solutions were subjected to reduction with 0.05 M NaBH4, and Fig. 5b and 5e are chromatograms after 60 and 40 min, respectively, of reduction. While 3 is not detectable, 20% of 2 remained unreduced. Destruction of the borohydride by acidification with acetic acid followed by neutralization to pH 7.2 phosphate buffer and bubbling with O2 for 10 min followed by re-injection yielded the chromatograms in Figs 5C and 5F. The concentrations of 2 and 3 were 80% and 35%, respectively, of the initial injections. Controls (not shown) in which solutions flushed with argon, subsequent to reduction, were acidified and neutralized, without bubbling O2 yielded chromatograms indistinguishable from Figs. 5B and 5E.
Figure 5. Regeneration of dithiolethiones by O2 subsequent to their reduction by NaBH4.

(A) HPLC chromatogram of 2. (B) HPLC chromatogram of 2 subsequent to reduction, in an argon atmosphere, with excess NaBH4 for 1h in H2O containing 20% ethanol by volume. (C) HPLC chromatogram of the material in panel (B) after, quenching with acetic acid, adjusting to pH 7.4 with phosphate buffer and bubbling under a stream of O2 for 10 min. Chromatograms D-F are a similar sequence with 3, but the reduction time was 40 min. For further details see Experimental and Results.
Discussion
The observation, Fig. 1, that catalase diminishes the ability of dithiolethiones 1 - 3 and the metabolite 4 to induce NQO1 implicates hydrogen peroxide as the common second messenger in phase 2 enzyme induction in all of these cases. Catalase more than doubles the value of CD in the case of 1, the effect is slightly larger in the case of the metabolite 4. Similar effects are indicated for compounds 2 and 3. Though considerable extrapolation, in these cases, would be required to estimate CD in the presence of catalase, consideration of concentration of drug required for induction by 50% in the absence and presence of catalase indicates similar degrees of inhibition by catalase. It is not possible to rule out that some of the effect of catalase is the result of intercept by catalase of hydroperoxides that may also be part of the signaling cascade initiated by dithiolethiones. (43) However, such species presumably arise downstream of Fenton-mediated damage initiated by H2O2. The oxidase activity of catalase that has been recently characterized (44) is unlikely the source of the observed decrease by catalase in NQO1 induction. This activity creates both H2O2 and carbonyl-type electrophiles and would thus be anticipated to have the opposite effect, stimulating the induction of phase 2 enzymes.
Compounds 1 and 3, and the metabolite 4 have all been demonstrated to generate O2•, (37, 38, 45) the precursor to H2O2, in the presence of thiols and the evidence obtained in the present study indicates that 2, as well, reacts with thiols to generate O2•. Reductive cleavage by thiols of dithiolethiones was first characterized by Fleury and involves cleavage of the S1-S2 bond. (31, 32) The kinetics were later characterized and it was demonstrated that 2 reacts more sluggishly than 1 or 3. (34) Figure 3 establishes that the product of thiolytic decay of 2, in the presence of the nitrone spin trap DMPO, generates the 1:2:2:1 quartet (aH = aN = 14.9G) characteristic of DMPO-OH which can be formed either by trapping of HO• (an unlikely species in the present case due to the presence of metal ion chelator) or via the relatively rapid decomposition of the DMPO-OOH adduct derived from trapping O2•. (46, 47) The fact that the signal increases with time, the longest time point in Fig. 3 representing 0.12% conversion, indicates that the reactive oxygen species, whatever its form, is derived from the product of thiolytic decay. That O2• is a substantial component of the flux of reactive oxygen species derived from the product of thiolytic decay is indicated by the complimentary fluorescence experiments in Fig. 4 with hydroethidine. In spite of what is often claimed, hydroethidine is a nonspecific trap for O2• (48, 49) and the detection of fluorescence upon the thiolytic decay of 2, demonstrated in the upper trace of Fig. 4, is anticipated on the basis of the epr spin trapping studies summarized in Fig 3. The observation, lower trace of Fig. 4, that superoxide dismutase substantially diminishes the fluorescence implicates O2• as a major component of the reactive oxygen species derived from the thiolytic decay of 2.
In the case of compounds 2 and 3, the products of reductive cleavage react with oxygen to regenerate dithiolethiones. Reductive cleavage, by either methanethiolate or NaBH4, results in the anticipated cleavage of the S1-S2 bond and subsequent methylation yields the equilibrating isomers 5 and 6, and 7 and 8 in eqs 2 and 3, as indicated in the experiments described in the Results and Fig 2A and 2B. Figure 5 demonstrates that 2 (compare Fig. 5B with 5A) is mostly decomposed, and 3 (compare Fig. 5E with 5D) is entirely decomposed by treatment, for 1 h and 40 min, respectively, with NaBH4 in aqueous media, 20% ethanol by volume, in an argon atmosphere. Clearing with acid of the excess NaBH4 and introduction of oxygen results in the reformation of significant quantities of the dithiolethione, 80% in the case of 2 and 32% in the case of 3. That 2 and 3 undergo reductive cleavage in cells is confirmed by the isolation of 5 and 6, and 7 and 8, from Hepa 1c1c7 cells treated with 2 and 3, respectively, as indicated panels C and D in Fig. 2.
The elements common to the induction of NQO1 in Hepa 1c1c7 cells by all three of the dithiolethiones are depicted in Scheme 1. They undergo reductive cleavage to yield intermediates that generate superoxide radical anion. In the case of 1, the first formed intermediate undergoes intramolecular capture, but coincidently, this product is redox active, as has been demonstrated. Whether the first formed intermediate ever returns to 1 is unknown. The reductive cleavage products of the other dithiolethiones also produce superoxide radical anion as deduced here for 2 and elsewhere for 3. (38) The exact mechanism for this process is not known, but it presumably can occur in the course of the ring closure and reformation of the original dithiolethiones under the influence of oxygen - here demonstrated for the intermediates from reduction of both 2 and 3. It is not known if these intermediates can themselves redox cycle passing reducing equivalents from GSH to O2, as has been demonstrated for intermediate 4. (37) Dismutation to H2O2 of the O2• formed and subsequent direct or indirect, by lipid peroxidation products subsequent to Fenton chemistry or a change in the major redox couples in the cell, (50-58) reaction with Keap1 accounts for the diminution of the potency of 1, 2, 3 and the metabolite 4 in the presence of catalase. Relevant to this, it has recently been demonstrated in vitro that physiologically relevant alterations in a GSH/GSSG couple leads to glutathionylation and cysteine disulfide closure of specific cysteines of Keap1. (59) In addition, the intermediacy of H2O2 in the upregulation by arsenic (60) or tert-butylhydroquinone (61) of Nrf2 mediated protein synthesis has been demonstrated.
Scheme 1.

It is essential to emphasize that the mechanism of reductive cleavage of dithiolethiones in living systems, whether chemical or enzymatic, is unknown. Cells that were demonstrated to have been depleted in GSH by treatment with buthionine sulfoximine in fact show increased sensitivity to NQO1 induction by oltipraz (data not shown). However, the interpretation of this observation is confounded by a number of variables including the impact of the increase in oxidative stress as well as the impact on the unknown “machinery” by which the cells reduce dithiolethiones. Obviously, identifying the nature of the reduction process could have significant implications for controlling tissue/organ specificity in the use of dithiolethiones as cancer chemopreventives.
Finally, while this study implicates superoxide radical anion and hydrogen peroxide as key second messengers for phase 2 enzyme induction by dithiolethiones, it is not precluded that reactions and other species do not contribute to the observed actions of these compounds. Dithiolethiones are electrophiles and we have evidence, to be described elsewhere, that they react directly with Keap1. In addition it is possible that other metabolites may have similar or varying activities. The 3-oxo metabolite of 1 is a known phase 2 enzyme inducer, though possibly via an alternative pathway. (62, 63) The dimethylated metabolite of 4 appears to have activity in one cell type, (63) though this was not detected in other systems. (36, 62) The activity of the monomethylated forms of 4, at least one of which has been detected as a cellular metabolite, (36) is presently undocumented.
Acknowledgments
This work was supported in part by NIH CA91032 (J.C.F.).
References
- 1.Roebuck BD, Curphey TJ, Li Y, Baumgartner KJ, Bodreddigari S, Yan J, Gange SJ, Kensler TW, Sutter TR. Evaluation of the cancer chemopreventive potency of dithiolethione analogs of oltipraz. Carcinogenesis. 2003;24:1919–28. doi: 10.1093/carcin/bgg173. [DOI] [PubMed] [Google Scholar]
- 2.Kensler TW. Chemoprevention by inducers of carcinogen detoxication enzymes. Environ Health Perspect. 1997;105:965–970. doi: 10.1289/ehp.97105s4965. [DOI] [PMC free article] [PubMed] [Google Scholar]
- 3.Kensler TW, Groopman JD, Sutter TR, Curphey TJ, Roebuck BD. Development of cancer chemopreventive agents: Oltipraz as a paradigm. Chem Res Tox. 1999;12:113–126. doi: 10.1021/tx980185b. [DOI] [PubMed] [Google Scholar]
- 4.Primiano T, Egner PA, Sutter TR, Kelloff GJ, Roebuck BD, Kensler TW. Intermittent dosing with oltipraz: relationship between chemoprevention of aflatoxin-induced tumorigenesis and induction of glutathione S-transferases. Cancer Res. 1995;55:4319–24. [PubMed] [Google Scholar]
- 5.Kwak MK, Ramos-Gomez M, Wakabayashi N, Kensler TW. Chemoprevention by 1,2-dithiole-3-thiones through induction of NQO1 and other phase 2 enzymes. Methods Enzymol. 2004;382:414–23. doi: 10.1016/S0076-6879(04)82022-6. [DOI] [PubMed] [Google Scholar]
- 6.Guyton KZ, Kensler TW. Prevention of liver cancer. Curr Oncol Rep. 2002;4:464–70. doi: 10.1007/s11912-002-0057-4. [DOI] [PubMed] [Google Scholar]
- 7.Benson AB., 3rd Oltipraz: a laboratory and clinical review. J Cell Biochem Suppl. 1993;17F:278–91. doi: 10.1002/jcb.240531041. [DOI] [PubMed] [Google Scholar]
- 8.Wang JS, Shen X, He X, Zhu YR, Zhang BC, Wang JB, Qian GS, Kuang SY, Zarba A, Egner PA, Jacobson LP, Munoz A, Helzlsouer KJ, Groopman JD, Kensler TW. Protective alterations in phase 1 and 2 metabolism of aflatoxin B1 by oltipraz in residents of Qidong, People's Republic of China. J Natl Cancer Inst. 1999;91:347–54. doi: 10.1093/jnci/91.4.347. [DOI] [PubMed] [Google Scholar]
- 9.Lam S, MacAulay C, Le Riche JC, Dyachkova Y, Coldman A, Guillaud M, Hawk E, Christen MO, Gazdar AF. A randomized phase IIb trial of anethole dithiolethione in smokers with bronchial dysplasia. J Natl Cancer Inst. 2002;94:1001–9. doi: 10.1093/jnci/94.13.1001. [DOI] [PubMed] [Google Scholar]
- 10.Kensler TW, Egner PA, Wang JB, Zhu YR, Zhang BC, Qian GS, Kuang SY, Gange SJ, Jacobson LP, Munoz A, Groopman JD. Strategies for chemoprevention of liver cancer. Eur J Cancer Prev. 2002;11 2:S58–64. [PubMed] [Google Scholar]
- 11.Jirousek L, Starka L. Uber das vorkommen von trithionen(1,2-dithicyclopent-4-en-3-thione)in Brassicapflazen. Naturwissen. 1958;45:386–7. [Google Scholar]
- 12.Marks HS, Leichtweis HC, Stoewsand GS. Analysis of a Reported Organosulfur, Carcinogenesis Inhibitor: 1,2-Dithiole-3-thione in Cabbage. J Agric Food Chem. 1991;39:893–5. [Google Scholar]
- 13.Zhang Y, Munday R. Dithiolethiones for cancer chemoprevention: where do we stand? Mol Cancer Ther. 2008;7:3470–9. doi: 10.1158/1535-7163.MCT-08-0625. [DOI] [PMC free article] [PubMed] [Google Scholar]
- 14.Hayes JD, McMahon M. Molecular basis for the contribution of the antioxidant responsive element to cancer chemoprevention. Cancer Lett. 2001;174:103–13. doi: 10.1016/s0304-3835(01)00695-4. [DOI] [PubMed] [Google Scholar]
- 15.Dinkova-Kostova AT, Holtzclaw WD, Kensler TW. The role of Keap1 in cellular protective responses. Chem Res Toxicol. 2005;18:1779–91. doi: 10.1021/tx050217c. [DOI] [PubMed] [Google Scholar]
- 16.Kensler TW, Primiano T, Sutter TR, Egner PA, Dolan PM, Groopman JD, Curphey TJ, Roebuck BD. Mechanisms of chemoprotection by 1,2-dithiole-3-thiones. Proc Intl Sympos on Natural Antiox. 1996:243–250. [Google Scholar]
- 17.Kwak MK, Itoh K, Yamamoto M, Sutter TR, Kensler TW. Role of transcription factor Nrf2 in the induction of hepatic phase 2 and antioxidative enzymes in vivo by the chemopreventive agent 3H-1,2-dithiole-3-thione. Molec Med. 2001;7:135–45. [PMC free article] [PubMed] [Google Scholar]
- 18.Ramos-Gomez M, Dolan PM, Itoh K, Yamamoto M, Kensler TW. Interactive effects of nrf2 genotype and oltipraz on benzo[a]pyrene-DNA adducts and tumor yield in mice. Carcinogenesis. 2003;24:461–7. doi: 10.1093/carcin/24.3.461. [DOI] [PubMed] [Google Scholar]
- 19.Dinkova-Kostova AT, Holtzclaw WD, Cole RN, Itoh K, Wakabayashi N, Katoh Y, Yamamoto M, Talalay P. Direct evidence that sulfhydryl groups of Keap1 are the sensors regulating induction of phase 2 enzymes that protect against carcinogens and oxidants. Proc Natl Acad Sci (USA) 2002;99:11908–13. doi: 10.1073/pnas.172398899. [DOI] [PMC free article] [PubMed] [Google Scholar]
- 20.Dinkova-Kostova AT, Massiah MA, Bozak RE, Hicks RJ, Talalay P. Potency of Michael reaction acceptors as inducers of enzymes that protect against carcinogenesis depends on their reactivity with sulfhydryl groups. Proc Natl Acad Sci (USA) 2001;98:3404–9. doi: 10.1073/pnas.051632198. [DOI] [PMC free article] [PubMed] [Google Scholar]
- 21.Dinkova-Kostova AT, Holtzclaw WD, Wakabayashi N. Keap1, the sensor for electrophiles and oxidants that regulates the phase 2 response, is a zinc metalloprotein. Biochemistry. 2005;44:6889–99. doi: 10.1021/bi047434h. [DOI] [PubMed] [Google Scholar]
- 22.Wakabayashi N, Dinkova-Kostova AT, Holtzclaw WD, Kang MI, Kobayashi A, Yamamoto M, Kensler TW, Talalay P. Protection against electrophile and oxidant stress by induction of the phase 2 response: fate of cysteines of the Keap1 sensor modified by inducers. Proc Natl Acad Sci U S A. 2004;101:2040–5. doi: 10.1073/pnas.0307301101. [DOI] [PMC free article] [PubMed] [Google Scholar]
- 23.Liebler DC, Hong F, Sekhar KR, Freeman ML. Site-Specific Modification of the Electrophile Sensor Protein Keap1 and Activation of Nrf2-Dependent Gene Expression. Advances in Molecular Toxicology. 2006;1:55–71. [Google Scholar]
- 24.Hong F, Sekhar KR, Freeman ML, Liebler DC. Specific patterns of electrophile adduction trigger Keap1 ubiquitination and Nrf2 activation. J Biol Chem. 2005;280:31768–75. doi: 10.1074/jbc.M503346200. [DOI] [PubMed] [Google Scholar]
- 25.Rachakonda G, Xiong Y, Sekhar KR, Stamer SL, Liebler DC, Freeman ML. Covalent modification at Cys151 dissociates the electrophile sensor Keap1 from the ubiquitin ligase CUL3. Chem Res Toxicol. 2008;21:705–10. doi: 10.1021/tx700302s. [DOI] [PubMed] [Google Scholar]
- 26.Tong KI, Kobayashi A, Katsuoka F, Yamamoto M. Two-site substrate recognition model for the Keap1-Nrf2 system: a hinge and latch mechanism. Biol Chem. 2006;387:1311–20. doi: 10.1515/BC.2006.164. [DOI] [PubMed] [Google Scholar]
- 27.Tong KI, Padmanabhan B, Kobayashi A, Shang C, Hirotsu Y, Yokoyama S, Yamamoto M. Different electrostatic potentials define ETGE and DLG motifs as hinge and latch in oxidative stress response. Mol Cell Biol. 2007;27:7511–21. doi: 10.1128/MCB.00753-07. [DOI] [PMC free article] [PubMed] [Google Scholar]
- 28.Eggler AL, Liu G, Pezzuto JM, van Breemen RB, Mesecar AD. Modifying specific cysteines of the electrophile-sensing human Keap1 protein is insufficient to disrupt binding to the Nrf2 domain Neh2. Proc Natl Acad Sci U S A. 2005;102:10070–5. doi: 10.1073/pnas.0502402102. [DOI] [PMC free article] [PubMed] [Google Scholar]
- 29.Eggler AL, Luo Y, van Breemen RB, Mesecar AD. Identification of the highly reactive cysteine 151 in the chemopreventive agent-sensor Keap1 protein is method-dependent. Chem Res Toxicol. 2007;20:1878–84. doi: 10.1021/tx700217c. [DOI] [PubMed] [Google Scholar]
- 30.Zhang DD, Hannink M. Distinct cysteine residues in Keap1 are required for Keap1-dependent ubiquitination of Nrf2 and for stabilization of Nrf2 by chemopreventive agents and oxidative stress. Mol Cell Biol. 2003;23:8137–51. doi: 10.1128/MCB.23.22.8137-8151.2003. [DOI] [PMC free article] [PubMed] [Google Scholar]
- 31.Largeron M, Martens T, Fleury MB. Reactivity of substituted 1,2-dithiole-3-thiones with sodium ethanethiolate: a convenient route to a novel heterocycle. Tetrahedron Lett. 1987;43:3421–28. [Google Scholar]
- 32.Fleury MB, Largeron M. Studies of the reaction of 1,2-dithiolethiones with nucleophiles. Tetrahedron. 1985;41:3705–3715. [Google Scholar]
- 33.Fleury MB, Largeron M, Martens T. Toward an understanding of the schistosomocidal effect of 4-methyl-5-(2-pyrazinyl)-1,2-dithiole-3-thione. Biochem Parmacol. 1991;41:361–367. doi: 10.1016/0006-2952(91)90532-a. [DOI] [PubMed] [Google Scholar]
- 34.Carey KA, Kensler TW, Fishbein JC. Kinetic constraints for the thiolysis of 4-methyl-5-(pyrazin-2-yl)-1,2-dithiole-3-thione (oltipraz) and related dithiole-3-thiones in aqueous solution. Chem Res Tox. 2001;14:939–45. doi: 10.1021/tx0100340. [DOI] [PubMed] [Google Scholar]
- 35.Kim W, Gates KS. Evidence for thiol-dependent production of oxygen radicals by 4-methyl-5-pyrazinyl-3H-1,2-dithiole-3-thione (oltipraz) and 3H-1,2-dithiole-3-thione: possible relevance to the anticarcinogenic properties of 1,2-dithiole-3-thiones. Chem Res Tox. 1997;10:296–301. doi: 10.1021/tx9601667. [DOI] [PubMed] [Google Scholar]
- 36.Petzer JP, Navamal M, Johnson JK, Kwak MK, Kensler TW, Fishbein JC. Phase 2 enzyme induction by the major metabolite of oltipraz. Chem Res Toxicol. 2003;16:1463–9. doi: 10.1021/tx034154e. [DOI] [PubMed] [Google Scholar]
- 37.Velayutham M, Villamena FA, Navamal M, Fishbein JC, Zweier JL. Glutathione-mediated formation of oxygen free radicals by the major metabolite of oltipraz. Chem Res Toxicol. 2005;18:970–5. doi: 10.1021/tx049687h. [DOI] [PubMed] [Google Scholar]
- 38.Jia Z, Zhu H, Trush MA, Misra HP, Li Y. Generation of superoxide from reaction of 3H-1,2-dithiole-3-thione with thiols: implications for dithiolethione chemoprotection. Mol Cell Biochem. 2008;307:185–91. doi: 10.1007/s11010-007-9598-z. [DOI] [PubMed] [Google Scholar]
- 39.Curphey TJ, Libby AH. Dianions of 3-oxo dithioic acids: preparation and conversion of 3H-1,2-dithiole-3-thiones. Tetrahedron Lett. 2000;41:6977–80. [Google Scholar]
- 40.Navamal M, McGrath C, Stewart J, Blans P, Villamena F, Zweier J, Fishbein JC. Thiolytic chemistry of alternative precursors to the major metabolite of the cancer chemopreventive oltipraz. J Org Chem. 2002;67:9406–13. doi: 10.1021/jo020588n. [DOI] [PubMed] [Google Scholar]
- 41.Maxuitenko YY, Libby AH, Joyner HH, Curphey TJ, MacMillan DL, Kensler TW, Roebuck BD. Identification of dithiolethiones with better chemopreventive properties than oltipraz. Carcinogenesis. 1998;19:1609–1615. doi: 10.1093/carcin/19.9.1609. [DOI] [PubMed] [Google Scholar]
- 42.Egner PA, Kensler TW, Prestera T, Talalay P, Libby AH, Joyner HH, Curphey TJ. Regulation of phase 2 enzyme induction by oltipraz and other dithiolethiones. Carcinogenesis. 1994;15:177–181. doi: 10.1093/carcin/15.2.177. [DOI] [PubMed] [Google Scholar]
- 43.Schonbaum GR, Chance B. The Enzymes. 3d. Vol. 13. New York: 1976. [Google Scholar]
- 44.Vetrano AM, Heck DE, Mariano TM, Mishin V, Laskin DL, Laskin JD. Characterization of the oxidase activity in mammalian catalase. J Biol Chem. 2005;280:35372–81. doi: 10.1074/jbc.M503991200. [DOI] [PubMed] [Google Scholar]
- 45.Velayutham M, Villamena FA, Fishbein JC, Zweier JL. Cancer chemopreventive oltipraz generates superoxide anion radical. Arch Biochem Biophys. 2005;435:83–8. doi: 10.1016/j.abb.2004.11.028. [DOI] [PubMed] [Google Scholar]
- 46.Sankarapandi S, Zweier JL. Bicarbonate is required for the peroxidase function of Cu, Zn-superoxide dismutase at physiological pH. J Biol Chem. 1999;274:1226–32. doi: 10.1074/jbc.274.3.1226. [DOI] [PubMed] [Google Scholar]
- 47.Roubaud V, Sankarapandi S, Kuppusamy P, Tordo P, Zweier JL. Quantitative measurement of superoxide generation and oxygen consumption from leukocytes using electron paramagnetic resonance spectroscopy. Anal Biochem. 1998;257:210–7. doi: 10.1006/abio.1997.2542. [DOI] [PubMed] [Google Scholar]
- 48.Robinson KM, Janes MS, Pehar M, Monette JS, Ross MF, Hagen TM, Murphy MP, Beckman JS. Selective fluorescent imaging of superoxide in vivo using ethidium-based probes. Proc Natl Acad Sci U S A. 2006;103:15038–43. doi: 10.1073/pnas.0601945103. [DOI] [PMC free article] [PubMed] [Google Scholar]
- 49.Zhao H, Kalivendi S, Zhang H, Joseph J, Nithipatikom K, Vasquez-Vivar J, Kalyanaraman B. Superoxide reacts with hydroethidine but forms a fluorescent product that is distinctly different from ethidium: potential implications in intracellular fluorescence detection of superoxide. Free Radic Biol Med. 2003;34:1359–68. doi: 10.1016/s0891-5849(03)00142-4. [DOI] [PubMed] [Google Scholar]
- 50.Schafer FQ, Buettner GR. Redox environment of the cell as viewed through the redox state of the glutathione disulfide/glutathione couple. Free Radic Biol Med. 2001;30:1191–212. doi: 10.1016/s0891-5849(01)00480-4. [DOI] [PubMed] [Google Scholar]
- 51.Halvey PJ, Watson WH, Hansen JM, Go YM, Samali A, Jones DP. Compartmental oxidation of thiol-disulphide redox couples during epidermal growth factor signalling. Biochem J. 2005;386:215–9. doi: 10.1042/BJ20041829. [DOI] [PMC free article] [PubMed] [Google Scholar]
- 52.Hansen JM, Watson WH, Jones DP. Compartmentation of Nrf2 redox control: regulation of cytoplasmic activation by glutathione and DNA binding by thioredoxin-1. Toxicol Sci. 2004;82:308–17. doi: 10.1093/toxsci/kfh231. [DOI] [PubMed] [Google Scholar]
- 53.Kirlin WG, Cai J, Thompson SA, Diaz D, Kavanagh TJ, Jones DP. Glutathione redox potential in response to differentiation and enzyme inducers. Free Radic Biol Med. 1999;27:1208–18. doi: 10.1016/s0891-5849(99)00145-8. [DOI] [PubMed] [Google Scholar]
- 54.Han D, Hanawa N, Saberi B, Kaplowitz N. Hydrogen peroxide and redox modulation sensitize primary mouse hepatocytes to TNF-induced apoptosis. Free Radic Biol Med. 2006;41:627–39. doi: 10.1016/j.freeradbiomed.2006.05.002. [DOI] [PubMed] [Google Scholar]
- 55.Zou J, Salminen WF, Roberts SM, Voellmy R. Correlation between glutathione oxidation and trimerization of heat shock factor 1, an early step in stress induction of the Hsp response. Cell Stress Chaperones. 1998;3:130–41. doi: 10.1379/1466-1268(1998)003<0130:cbgoat>2.3.co;2. [DOI] [PMC free article] [PubMed] [Google Scholar]
- 56.Klatt P, Lamas S. Regulation of protein function by S-glutathiolation in response to oxidative and nitrosative stress. Eur J Biochem. 2000;267:4928–44. doi: 10.1046/j.1432-1327.2000.01601.x. [DOI] [PubMed] [Google Scholar]
- 57.Klatt P, Molina EP, De Lacoba MG, Padilla CA, Martinez-Galesteo E, Barcena JA, Lamas S. Redox regulation of c-Jun DNA binding by reversible S-glutathiolation. Faseb J. 1999;13:1481–90. doi: 10.1096/fasebj.13.12.1481. [DOI] [PubMed] [Google Scholar]
- 58.Jones DP, Carlson JL, Mody VC, Cai J, Lynn MJ, Sternberg P. Redox state of glutathione in human plasma. Free Radic Biol Med. 2000;28:625–35. doi: 10.1016/s0891-5849(99)00275-0. [DOI] [PubMed] [Google Scholar]
- 59.Holland R, Hawkins AE, Eggler AL, Mesecar AD, Fabris D, Fishbein JC. Prospective type 1 and type 2 disulfides of Keap1 protein. Chem Res Toxicol. 2008;21:2051–60. doi: 10.1021/tx800226m. [DOI] [PMC free article] [PubMed] [Google Scholar]
- 60.Pi J, Qu W, Reece JM, Kumagai Y, Waalkes MP. Transcription factor Nrf2 activation by inorganic arsenic in cultured keratinocytes: involvement of hydrogen peroxide. Exp Cell Res. 2003;290:234–45. doi: 10.1016/s0014-4827(03)00341-0. [DOI] [PubMed] [Google Scholar]
- 61.Kraft AD, Johnson DA, Johnson JA. Nuclear factor E2-related factor 2-dependent antioxidant response element activation by tert-butylhydroquinone and sulforaphane occurring preferentially in astrocytes conditions neurons against oxidative insult. J Neurosci. 2004;24:1101–12. doi: 10.1523/JNEUROSCI.3817-03.2004. [DOI] [PMC free article] [PubMed] [Google Scholar]
- 62.O'Dwyer PJ, Clayton M, Halbherr T, Myers CB, Yao K. Cellular kinetics of induction by oltipraz and its keto derivative of detoxication enzymes in human colon adenocarcinoma cells. Clin Cancer Res. 1997;3:783–91. [PubMed] [Google Scholar]
- 63.Ko MS, Lee SJ, Kim JW, Lim JW, Kim SG. Differential effects of the oxidized metabolites of oltipraz on the activation of CCAAT/enhancer binding protein-beta and NF-E2-related factor-2 for GSTA2 gene induction. Drug Metab Dispos. 2006;34:1353–60. doi: 10.1124/dmd.106.009514. [DOI] [PubMed] [Google Scholar]