

Abstract
PDK1 (phosphoinositide-dependent protein kinase-1) catalyzes phosphorylation of Thr-229 in the T-loop of S6K1αII (the 70-kDa 40 S ribosomal protein S6 kinase-1 αII isoform), and Thr-229 phosphorylation is synergistic with C-terminal Thr-389 phosphorylation to activate S6K1αII regulatory functions in protein translation preinitiation complexes. Unlike its common AGC kinase subfamily member S6K1αII, PDK1 does not contain the synergistic C-terminal phosphorylation site, and it has been proposed that phosphorylated Thr-389 in S6K1αII may initially serve to trans-activate PDK1-catalyzed Thr-229 phosphorylation. Herein, we report direct binding and kinetic studies that showed PDK1 to exhibit nearly equal binding affinities and steady-state kinetic turnover numbers toward native (KdS6K1 = 1.2 μm and kcat = 1.1 s−1) and the phosphomimicking T389E mutant S6K1αII (KdS6K1 = 1.5 μm and kcat = 1.2 s−1), although ∼2-fold enhanced specificity was displayed for the T389E mutant (kcat/KmS6K1 = 0.08 μm−1 s−1 compared with 0.04 μm−1 s−1). Considering that transient kinetic binding studies showed all nucleotide and S6K1αII substrates and products to rapidly associate with PDK1 (kon = 1–6 μm−1 s−1), it was concluded that positioning a negative charge at residue Thr-389 reduced ∼2-fold the occurrence of nonproductive binding events that precede formation of a reactive ternary complex for Thr-229 phosphorylation. In addition, steady-state kinetic data were most simply accommodated by an Ordered Bi Bi mechanism with competitive substrate inhibition, where (i) the initially formed PDK1-ATP complex phosphorylates the nucleotide-free form of the S6K1αII kinase and (ii) initial binding of S6K1αII precludes ATP binding to PDK1.
PDK1 (phosphoinositide-dependent protein kinase-1) and the S6K1 (70-kDa 40 S ribosomal protein S6 kinase-1) are members of the AGC subfamily of serine-threonine protein kinases (1). Among these kinases, amino acid sequences are conserved in a segment of the kinase domain known as the activation loop or T-loop as well as in a short segment immediately C-terminal to the kinase domain known as the hydrophobic motif, and phosphorylation sites or acidic residues in these regions play important roles in their catalytic regulation and/or stability. Whereas a single isoform of PDK1 is produced from a single gene, two S6K1 isoforms are produced from a single gene by alternative mRNA splicing and the use of an alternative translational start site (2). The 525-residue S6K1αI isoform contains an N-terminal 23-residue segment that encodes a polybasic nuclear localization motif, whereas the cytoplasmic αII isoform starts at a Met residue equivalent to Met-24 in the αI isoform, and the sequences of both isoforms are identical thereafter.
With combined knowledge from available amino acid sequence alignments and x-ray structures, molecular modeling and biochemical testing now provide strong evidence for a common AGC kinase activation mechanism in which the C-terminal phosphorylated hydrophobic motif interacts with a phosphate binding pocket located in the small N-lobe of the kinase (3). This intramolecular interaction acts synergistically with T-loop phosphorylation to stabilize the active conformation, where a critical Glu residue in the αC-helix forms an ion pair with the catalytic Lys that functions to position the terminal phosphate of ATP for phosphotransfer in the kinase reaction. For the S6K1αI isoform, the phosphorylated residues in the T-loop and hydrophobic motif correspond to Thr-252 and Thr-412, respectively (4), whereas in the S6K1αII isoform, the identical residues correspond to Thr-229 and Thr-389 (5).
PDK1 has been termed the “master kinase” (6) in that it has been shown to phosphorylate the critical residue in the activation loop of AGC kinase family members, including different isoforms of S6K1 (4, 5), 90-kDa 40 S ribosomal protein S6 kinase (7, 8), serum- and glucocorticoid-induced protein kinase (9, 10), cAMP-dependent protein kinase (11), protein kinase B (12–16), Ca2+-activated protein kinase (17–19), and protein kinase N (20, 21). Similar to these and other AGC kinases, PDK1 contains a phosphate binding pocket located in the small N-lobe of the kinase (22, 23). However, PDK1 does not possess a phosphorylated hydrophobic motif C-terminal to its catalytic domain. Given that the catalytically active kinase domain of PDK1 uniquely requires only T-loop (Ser-241) phosphorylation (24), this raises the question of how it achieves catalytic competency to phosphorylate its protein targets.
The common ability of PDK1 to phosphorylate its numerous AGC kinase targets has been explained from the intriguing perspective that PDK1 has the ability to “sense the conformation” of many of its substrates (25). Here, it has been proposed that the phosphate binding pocket located in the small N-lobe of PDK1 is accessible for interaction with the phosphorylated hydrophobic motifs of its AGC kinase targets. Such docking-based recognition of the AGC kinase target would also serve to trans-activate PDK1-catalyzed T-loop phosphorylation of that target. Subsequently, the phosphorylated C-terminal hydrophobic motif of the target kinase would be released from PDK1 to form an intramolecular interaction with its N-lobe pocket, stabilizing its own active conformation (25). Both in vivo and in vitro studies indicated the important role of intermolecular interactions in activating PDK1-catalyzed phosphorylation of S6K1, the 90-kDa 40 S ribosomal protein S6 kinase, and serum- and glucocorticoid-induced protein kinase (3, 26, 27).
With regard to S6K1, an emerging view is that that phosphorylation of Thr-389 in its C-terminal hydrophobic motif is critical to facilitate PDK1-catalyzed Thr-229 phosphorylation of S6K1 (25). Primary support for this model was derived from surface plasmon resonance steady-state binding studies, which showed (i) PDK1 to bind the phosphomimic T389E mutant S6K1 catalytic kinase domain with a Kd of ∼8 μm and (ii) PDK1 to bind the native S6K1 catalytic kinase domain with poor affinity (28). In the latter case, it was not possible to accurately measure Kd due to poor data quality. In addition, it was later inferred from Western analyses that PDK1 in vitro phosphorylated Thr-229 of the native S6K1 kinase domain ∼10-fold less efficiently than its T389E mutant (26). Although x-ray structural and mutagenesis studies have clearly defined phosphate binding pocket residues important to PDK1 reactivity (22, 23), a detailed kinetic study of this process awaits description.
In this paper, we first report generation and characterization of homogeneous preparations of catalytic domain constructs of (i) the Ser-241-monophosphorylated active form of the PDK1 enzyme (His6-PDK1(ΔPH),2 residues 51–359) and (ii) the unphosphorylated inactive forms of both the native and T389E mutant S6K1αII substrate (His6-S6K1αII(ΔAID), residues 1–398). These constructs were used in a suite of direct binding and kinetic studies aimed to (i) quantify the effect that Thr-389 phosphorylation might provide in activating His6-PDK1(ΔPH)-catalyzed Thr-229 phosphorylation of His6-S6K1αII(ΔAID) and (ii) identify the reaction step in which activation takes place. Although kinetic studies were complicated by substrate-substrate (S6K1-ATP) interactions that resulted in a fair degree of apparent substrate inhibition, a number of surprising new insights became clear. Most important, we found that (i) His6-PDK1(ΔPH) only phosphorylated His6-S6K1αII(ΔAID) that was free of bound nucleotide and (ii) that positioning negative charge at residue Thr-389 increased ∼2-fold the probability of achieving a productively bound ternary complex that leads to Thr-229 phosphorylation.
EXPERIMENTAL PROCEDURES
Materials
Radiolabeled [γ-32P]ATP was from MP Biomedical. Mant-ATP was from Invitrogen. The concentration of Mant-ATP was determined from its molar extinction coefficient of either 5800 m−1 cm−1 at 356 nm or 23,000 m−1 cm−1 at 255 nm. The N-terminal fluorescently labeled peptide, 5-carboxytetramethylrhodamine-EPRILSEEEQEMFRDFDYIADWC (tamra-PIF), was from 21st Century Biochemicals, Inc. The concentration of tamra-PIF was determined from its molar extinction coefficient of 82,000 m−1 cm−1 at 550 nm. All other chemicals, salts, and buffers were from Sigma.
PDK1 and S6K1 Preparation and Characterization
The catalytic kinase domains of PDK1 (His6-PDK1(ΔPH), residues 51–359) and S6K1αII (native and T389E mutant His6-S6K1αII(ΔAID), residues 1–398), each containing an N-terminal His6 tag (HHHHHH) followed by a PreScission protease recognition sequence (LEVLFQGP), were expressed using the Bac-to-Bac® baculovirus expression system (Invitrogen) and His6 affinity-purified as described (29). The Thr-229-phosphorylated product forms of His6-S6K1αII(ΔAID) were generated in the same manner except that (i) Sf9 insect cells were coinfected with recombinant baculovirus expressing His6-PDK1(ΔPH), and (ii) His6-S6K1αII(ΔAID) was resolved from His6-PDK1(ΔPH) by MonoQ ion exchange chromatography as described (29). In all cases, high molecular weight protein impurities were removed by heparin-Sepharose chromatography. Analyses of (i) protein concentration, (ii) SDS-PAGE, (iii) Western blot, (iv) electrospray ionization-time of flight mass spectrometry (ESI-TOF), (v) 32P-phosphopeptide mapping, (vi) progress curves of His6-PDK1(ΔPH)-catalyzed Thr-229 phosphorylation of His6-S6K1αII(ΔAID), and (vii) initial velocity measurements of His6-S6K1αII(ΔAID)-catalyzed phosphorylation of Ser-6 (underlined) of the commercially available S6K/RSK2 model peptide substrate 1 (RRRLSSLRA; Upstate Biotechnology, Inc.) were carried out as described (29). For all binding and kinetic studies, “reaction buffer” refers to 40 mm MOPS buffer, pH 7, 0.1% 2-mercaptoethanol, and 10 mm MgCl2.
Equilibrium Titration Binding Studies
The KinTek model SF-2004 stopped-flow apparatus equipped with a KinTek TMX titration module was used to continuously monitor fluorescence changes associated with binding of His6-PDK1(ΔPH) enzyme to either fluorescently labeled Mant-ATP or tamra-PIF at 25 °C. In direct binding experiments, 20 μl of 40 μm His6-PDK1(ΔPH) enzyme was slowly and continuously titrated at 1 μl/min into 200 μl of reaction buffer (see above) containing either 0.5 μm Mant-ATP or 0.5 μm tamra-PIF. By using a fixed limiting amount of fluorescently labeled ligand, it was not necessary to correct for any inner filter effects. Binding of Mant-ATP was monitored by excitation of Trp residues in His6-PDK1(ΔPH) at 290 nm and continuously recording emission intensity of Mant-ATP at 450 nm; binding of tamra-PIF was monitored by its direct excitation at 425 nm and continuously recording its emission intensity at 560 nm. 1000 data points were collected for each titration. Equilibrium binding of (i) ATP and ADP and (ii) Thr-229-unphosphorylated and Thr-229-phosphorylated His6-S6K1αII(ΔAID) were carried out exactly as for either (i) Mant-ATP or (ii) tamra-PIFTide, respectively, except a 10 μm concentration of the designated unlabeled ligand was included in the cuvette with the labeled ligand.
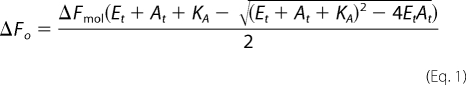
Equilibrium titration data for binding of His6-PDK1(ΔPH) enzyme to either Mant-ATP or tamra-PIF were analyzed according to a single-step binding mechanism (E + A ↔ *EA); where E, A, and *EA indicate enzyme, fluorescently labeled ligand, and the enzyme-bound ligand species with increased positive ΔF, respectively. The base-line intensity of the free ligand A was subtracted from the data, and its molar fluorescence intensity was taken to be zero. Therefore, the molar fluorescence change (ΔFmol) and the dissociation constant for the fluorescently labeled bound ligand (KA) were obtained by nonlinear least square fits of the subtracted data (ΔFo; 1000 points) as a function of both the total concentrations of enzyme (Et; 1000 points) and fluorescently labeled ligand (At; 1000 points), using GraFit version 4.0 software (Erithacus Software), to Equation 1.
 |
Equilibrium titration data for binding of His6-PDK1(ΔPH) enzyme to fluorescently labeled ligand in the presence of unlabeled ligand were analyzed according to a competitive single-step binding mechanism (E + A ↔ *EA and E + B ↔ EB), where B and EB further indicate unlabeled ligand and the enzyme complex with the unlabeled ligand, respectively. As above, the base-line intensity of the free fluorescently labeled ligand A was subtracted from the data, and its molar fluorescence intensity was taken to be zero. The measured KA value of the fluorescently labeled ligand was fixed, and fitted values of the molar fluorescence change (ΔFmol) and the dissociation constant for the unlabeled ligand (KB) were obtained by nonlinear least square fits of the data (ΔFo) as a function of the total concentrations of enzyme (Et), the fluorescently labeled ligand (At), and the unlabeled ligand (Bt), using GraFit version 4.0 software (Erithacus Software), to Equation 2 (30),
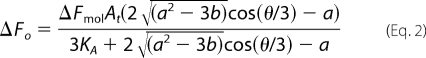 |
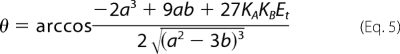
where the terms a, b, and θ are defined by the following expressions.
 |
Stopped-flow Kinetic Binding Studies
The KinTek model SF-2004 stopped-flow apparatus was used to monitor transient fluorescence changes associated with binding of His6-PDK1(ΔPH) enzyme to either fluorescently labeled Mant-ATP or tamra-PIF at 25 °C. In this case, 20 μl of varying concentrations of His6-PDK1(ΔPH) (2, 4, 6, 10, 14, or 20 μm) was rapidly mixed with 20 μl of a fixed concentration of either Mant-ATP (1 μm) or tamra-PIF (1 μm). Stopped-flow kinetics of binding of either ATP or ADP were carried out exactly as for Mant-ATP, and stopped-flow kinetics of binding of Thr-229-unphosphorylated and Thr-229-phosphorylated His6-S6K1αII(ΔAID) were carried out exactly as for tamra-PIF, except in these cases, a 20 μm concentration of the unlabeled ligand was included in the same syringe as the labeled ligand. For each given reaction condition, 150 μl were loaded into each syringe, seven reaction traces were collected, and the final five reaction traces were averaged.
Stopped-flow kinetic binding data were analyzed using DynaFit version 3.28 software (BioKin, Ltd., Pullman, WA) (31), and the computational scripts are provided in the supplemental material. For single-step binding of the enzyme to only the fluorescently labeled ligand, ΔFo versus time data were fitted to obtain ΔFmol as well as the microscopic rate constants for association (kon) and dissociation (koff). For competitive single-step binding of the enzyme to either the fluorescently labeled or unlabeled ligand, the kon and koff values measured for the labeled ligand were fixed. In this case, ΔFo versus time data were fitted to obtain the microscopic rate constants for association (kon) and dissociation (koff) of the unlabeled ligand as well as ΔFmol.
Steady-state Kinetic Assays
Radiometric steady-state kinetic assays were carried out for His6-PDK1(ΔPH)-catalyzed Thr-229 phosphorylation of either native or T389E mutant His6-S6K1αII(ΔAID) using [γ-32P]ATP (∼500–1000 cpm/pmol). The 100-μl protein phosphorylation reactions were performed at 25 °C in reaction buffer, and the assays were initiated by the addition of 1–5 nm kinase. For all kinase assays, 20-μl aliquots were removed at different times and mixed with 20 μl of 75 mm phosphoric acid and applied to P81 phosphocellulose paper (2 × 2 cm). After 30 s, the papers were washed (three times) in 1 liter of fresh 75 mm phosphoric acid for 10 min and then rinsed with 50 ml of acetone and placed in the hood to dry. The specific radioactivity of 32P-labeled Thr-229 His6-S6K1αII(ΔAID) (SAS6K1; cpm/pmol) was determined from radioactivity detected by scintillation counting of the known amount of His6-S6K1αII(ΔAID) that was applied to the P81 paper, and the concentration of phosphorylated His6-S6K1αII(ΔAID) product formed at each time point was determined by reference to the specific radioactivity of [γ-32P]ATP (SAATP; ∼500–1000 cpm/pmol) and the volume of the aliquot removed for quenching (20 μl).
Initial velocities (v; μm s−1) for each reaction condition were determined from the average measured initial velocities of all quenched aliquots in which total product represented ≤10% of the initial concentration of the limiting substrate. Initial velocities were normalized to His6-PDK1(ΔPH) enzyme concentration to yield apparent first order rate constants, k (s−1) = v/[Etot]. Control assays in the absence of either the His6-PDK1(ΔPH) enzyme or His6-S6K1αII(ΔAID) substrate were always ≤5% of the activity measured in the presence of both the lower and upper bound concentrations of these reagents. In addition, retention of S6K1 protein on the P81 paper (∼88–90%) was shown to be constant over the [S6K1]total titration range (see supplemental material). Radioactivity was corrected for cpm background and protein retention amounts determined in control assays.
Determination of Free ATP and His6-S6K1αII(ΔAID) Substrate Concentrations
The ATP substrate was approximated to bind both the native (Kd = 75 μm) and T389E mutant His6-S6K1αII(ΔAID) (Kd = 60 μm) (Schemes 1 and 2; B + A ↔ BA). As such, the effective concentrations of the free forms of both the nucleotide and protein substrates systematically decrease upon titration with one given substrate. Regarding the titrated substrate, the free concentrations of either ATP (Af = At − BA) or His6-S6K1αII(ΔAID) (Bf = Bt − BA) at each given assay condition were calculated by subtracting the concentration of S6K1-ATP complex (BA) from their given total concentrations (At or Bt). Values of BA were calculated according to Equation 6,
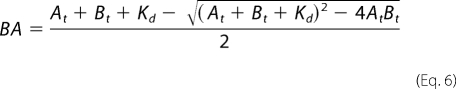 |
where Kd is the equilibrium dissociation constant for ATP binding with the designated His6-S6K1αII(ΔAID) construct.
SCHEME 1.

Rapid equilibrium Random Bi Bi mechanism.
SCHEME 2.

Steady-state Ordered Bi Bi mechanism with competitive substrate inhibition.
Regarding the concentration of the free form of the “fixed” substrate, Equations 7 and 8 were used to calculate the total concentrations of either ATP (At) or His6-S6K1αII(ΔAID) (Bt) needed to maintain its designated fixed concentration during titration with the other substrate.
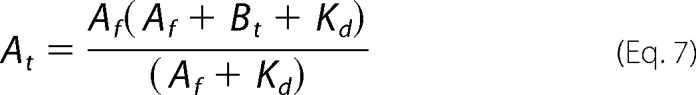 |
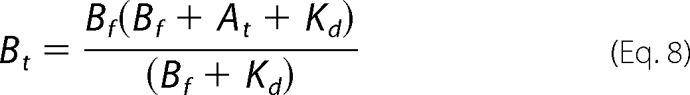 |
Equations 7 and 8 were derived by substituting Equation 6 for BA in either At = Af + BA or Bt = Bf + BA and then solving for either At or Bt.
Steady-state Kinetic Data Analysis
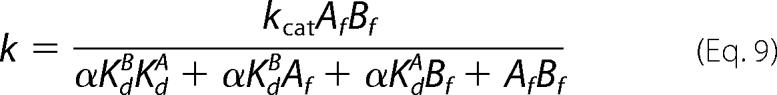
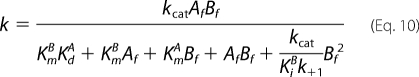
Initial rates determined as a function of the concentrations of the free forms of ATP (Af) and His6-S6K1αII(ΔAID) (Bf) in the assay were comparatively analyzed according to general velocity Equations 9 and 10.
 |
 |
Equation 9 is the general velocity equation derived for a rapid equilibrium Random Bi Bi mechanism (Scheme 1) (32). Equilibrium dissociation constants for binary complex formation of His6-PDK1(ΔPH) with ATP (KdA = 1.4 μm) and either native (KdB = 1.2 μm) or T389E mutant His6-S6K1αII(ΔAID) (KdB = 1.5 μm) were fixed according to their directly measured values, and the data were globally fitted to obtain values of (i) the turnover number (kcat; s−1) and (ii) the proportionality constant α. The symbol α quantifies the degree that the binding of one substrate either increases (α < 1) or decreases (α > 1) the affinity of the enzyme for the other substrate. Equation 9 is mathematically identical to the general velocity equation derived for a steady-state Ordered Bi Bi mechanism, where (i) KdA is the dissociation constant for the first binding substrate, and (ii) αKdA and αKdB designate the Michaelis constants of the first (KmA) and second binding substrates (KmA), respectively (32).
Equation 10 is the general velocity equation derived for a steady-state Ordered Bi Bi mechanism with competitive substrate inhibition (Scheme 2). In this mechanism, the enzyme can engage a binary complex with the second binding substrate (B), which competitively inhibits initial binding of the first substrate (A). The kinetic formulation of the mechanism in Scheme 2 is fully described in the supplemental material. Equation 10 is identical to the equation derived for a standard Ordered Bi Bi mechanism (Scheme 2; steps 1–5), except that (i) KmA is modified according to Equation 19 (see below), and (ii) kcatBf2/(KiBk+1) is an additional term in the denominator, where kcat/(KiBk+1) represents the coefficient of Bf2 (KBB). In Equation 10, Af and Bf are the free concentrations of the first (ATP) and second binding substrates (His6-S6K1αII(ΔAID)), respectively. Equilibrium dissociation constants for binary complex formation of His6-PDK1(ΔPH) with ATP (KdA = 1.4 μm) and either native (KiB = 1.2 μm) or T389E mutant His6-S6K1αII(ΔAID) (KiB = 1.5 μm), as well as the rate constant for association of PDK1 with ATP (k+1 = 4.8 μm−1 s−1), were fixed according to their directly measured values, and the data were globally fitted to obtain values of (i) the turnover number (kcat; s−1), (ii) the Michaelis constant of ATP (KmA; μm), and (iii) the Michaelis constant of His6-S6K1αII(ΔAID) (KmB; μm).
RESULTS
Purification of His6-PDK1(ΔPH) and His6-S6K1αII(ΔAID) Constructs
Fig. 1 shows SDS-PAGE of purification of the His6-PDK1(ΔPH) enzyme and the native and T389E mutant His6-S6K1αII(ΔAID) protein substrates from Sf9 insect cells. Whereas His6-PDK1(ΔPH) (Fig. 1A, lane 2) and T389E mutant His6-S6K1αII(ΔAID) (Fig. 1C, lane 2) were His6 affinity-purified to ≥95% and ∼85% homogeneity, respectively, native His6-S6K1αII(ΔAID) (Fig. 1B, lane 2) was His6-purified to only ∼10%. By subjecting the His6 affinity-purified fractions of native and T389E mutant His6-S6K1αII(ΔAID) to heparin-Sepharose chromatography, ≥95% homogeneous preparations of these constructs were obtained (Fig. 1, B (lane 3) and C (lane 3)).
FIGURE 1.

Purification of His6-PDK1(ΔPH) and His6-S6K1αII(ΔAID) catalytic kinase domain constructs after baculovirus-mediated expression in Sf9 insect cells. Shown is SDS-PAGE analysis with Coomassie staining of His6-PDK1(ΔPH) (A), native His6-S6K1αII(ΔAID) (B), and T389E mutant His6-S6K1αII(ΔAID) (C). Lane 1, total soluble lysate; lane 2, proteins eluted from the HisTrap column; lane 3, S6K1 fractions resolved by heparin-Sepharose chromatography. D, ESI-TOF-reconstructed mass spectra of purified His6-PDK1(ΔPH) (Mobs = 36,934 Da; Mcalc = 36,943 Da), native His6-S6K1αII(ΔAID) (Mobs = 46,531 Da; Mcalc = 46,540 Da), and T389E mutant His6-S6K1αII(ΔAID) (Mobs = 46,559 Da; Mcalc = 46,568 Da).
To further examine the homogeneity and integrity of the purified kinase constructs, ESI-TOF analysis was carried out (Fig. 1D). Electrospray on an intact protein determines the mass by multiply charging the molecule such that a charge envelope is seen in the spectrum. This charge envelope is then deconvoluted back to the original intact mass through an algorithm in the software that seeks the common numerator, and a reconstructed mass spectrum is generated. For purified His6-PDK1(ΔPH), the reconstructed mass spectrum showed a predominant species of 36,934 ± 10 Da, which corresponds well with the calculated molecular mass of monophosphorylated His6-PDK1(ΔPH) (36,943 Da (= 36,863 + 80 Da)). Western blotting with the phospho-PDK1 (Ser-241) antibody confirmed Ser-241 phosphorylation. A very small amount of a diphosphorylated His6-PDK1(ΔPH) species was also observed (37,023 Da (= 36,863 + 160 Da)). For the purified native and T389E mutant His6-S6K1αII(ΔAID) substrates, reconstructed mass spectra showed predominant species of 46,531 ± 10 Da and 46,559 ± 10 Da, respectively, which correspond well with the calculated molecular masses of 46,540 and 46,568 Da, respectively, for their unphosphorylated forms. In addition, the observed 28 Da-increased mass of the T389E mutant confirmed proper amino acid substitution.
His6-PDK1(ΔPH) Reactivities with Native and T389E Mutant His6- S6K1αII(ΔAID)
With homogeneous preparations of the unphosphorylated forms of native and T389E mutant His6-S6K1αII(ΔAID), we next tested their relative abilities to undergo in vitro His6-PDK1(ΔPH)-catalyzed Thr-229 phosphorylation. Fig. 2A shows the full time progress curves, where 10 nm His6-PDK1(ΔPH) enzyme was used to phosphorylate a 10 μm concentration of either native or T389E mutant His6-S6K1αII(ΔAID), using 200 μm [γ-32P]ATP in reaction buffer at 25 °C. The progress curves were well fitted to a single exponential, yielding limiting values of 10.6 ± 0.2 and 10.6 ± 0.2 μm phosphorylated S6K1 and pseudo-first order rate constants of (1.3 ± 0.1) × 10−3 s−1 and (1.8 ± 0.1) × 10−3 s−1 for native and T389E mutant His6-S6K1αII(ΔAID), respectively.
FIGURE 2.

Reactivity of His6-PDK1(ΔPH) with the native and T389E mutant forms of His6-S6K1αII(ΔAID). A, progress curves for His6-PDK1(ΔPH)-catalyzed Thr-229 phosphorylation of native His6-S6K1αII(ΔAID) (top; T389) and T389E mutant His6-S6K1αII(ΔAID) (bottom; E389). In both cases, 10 μm S6K1 construct was incubated at 25 °C with 10 nm active His6-PDK1(ΔPH) and 200 μm [γ-32P]ATP in kinase reaction buffer, and small aliquots were removed for determination of protein phosphorylation. B, after 30 min, each of the remaining reaction mixtures were subjected to proteolytic digestion with trypsin, and the resulting peptides were resolved by reversed-phase HPLC. For both native and T389E mutant His6-S6K1αII(ΔAID), scintillation counting of the individual fractions detected one major 32P-labeled peptide, which Edmond degradation determined to be the monophosphorylated tryptic peptide containing 32P-labeled Thr-229. C, after a 30-min incubation at 25 °C of either native or T389E mutant His6-S6K1αII(ΔAID) with 10 nm active His6-PDK1(ΔPH) and 200 μm cold ATP in kinase reaction buffer, the reaction products were analyzed by ESI-TOF mass spectrometry. The reconstructed mass spectrum of the native His6-S6K1αII(ΔAID) reaction product showed one large peak corresponding to the Thr(P)-229-monophosphorylated enzyme (Mobs = 46,611 Da; Mcalc = 46,620 Da) and one small peak corresponding to unphosphorylated enzyme. The reconstructed mass spectrum of the T389E mutant His6-S6K1αII(ΔAID) reaction product showed one large peak corresponding to the Thr(P)-229-monophosphorylated enzyme (Mobs = 46,639 Da; Mcalc = 46,648 Da) and one small peak corresponding to diphosphorylated enzyme. D, activity measurement and Western blotting of native and T389E mutant His6-S6K1αII(ΔAID) both before and after a 30-min incubation at 25 °C with 10 nm active His6-PDK1(ΔPH) and 200 μm cold ATP in kinase reaction buffer. Activity is plotted on a logarithmic scale, and one unit (U) of activity is defined as 1 nmol/min phosphorylation of the S6K/RSK2 model peptide 1 substrate. Native His6-S6K1αII(ΔAID) was probed with both Thr-229 and Thr-389 phospho-S6K1 antibodies, whereas T389E mutant His6-S6K1αII(ΔAID) was probed with only Thr-229 phospho-S6K1 antibody.
For PDK1-catalyzed phosphorylation of both native and T389E mutant His6-S6K1αII(ΔAID), 32P-phosphopeptide mapping further revealed the stoichiometric amount of radioactivity to elute in the tryptic peptide containing Thr-229 (Fig. 2B). Control reactions showed no amount of S6K1 autophosphorylation, an observation consistent with both native and T389E mutant His6-S6K1αII(ΔAID) being purified in their unphosphorylated forms. Thus, His6-PDK1(ΔPH) effectively phosphorylated Thr-229, regardless of whether a negative charge was localized at residue 389. On a final note, the observed stoichiometric Thr-229 phosphorylation indicated that chemical phosphorylation is essentially irreversible.
The phosphorylation reactions were also carried out under identical conditions, except using 200 μm unlabeled ATP. After 30 min, the reaction products were subjected to ESI-TOF analysis. The reconstructed mass spectra of the native and T389E mutant His6-S6K1αII(ΔAID) reaction products showed predominant species of 46,611 ± 10 and 46,639 ± 10 Da, respectively (Fig. 2C). These values correspond well with the calculated molecular masses of Thr-229-monophosphorylated native His6-S6K1αII(ΔAID) (46,620 Da (= 46,540 + 80 Da)) and T389E mutant His6-S6K1αII(ΔAID) (46,648 Da (= 46,568 + 80 Da)). For native His6-S6K1αII(ΔAID), a small amount of its unreacted unphosphorylated form was also observed, whereas for T389E mutant His6-S6K1αII(ΔAID), no amount of its unreacted unphosphorylated form was detected, consistent with its slightly increased observed rate constant. Rather, a small amount of its diphosphorylated form was also observed in the ESI-TOF spectrum, indicating that the small amount of monophosphorylation in the purified enzyme does not occur at Thr-229 (Fig. 1D, bottom).
The native and T389E mutant His6-S6K1αII(ΔAID) constructs, both before and 30 min after reacting with His6-PDK1(ΔPH) and cold ATP, were further subjected to (i) Western analysis using either the Thr-229 or Thr-389 phospho-S6K1 antibody and (ii) activity analysis using the S6K/RSK2 model peptide substrate 1 (Fig. 2D). For both the native (lanes 1 and 2) and T389E mutant His6-S6K1αII(ΔAID) constructs (lanes 3 and 4), Western blotting detected Thr-229 phosphorylation only after reacting with PDK1, and no Thr-389 phosphorylation was detected in native His6-S6K1αII(ΔAID) either before or after reacting with PDK1 (lanes 1 and 2). The native His6-S6K1αII(ΔAID) activities were 1.5 units/mg before and 9.5 units/mg after reacting with His6-PDK1(ΔPH), and the T389E mutant activities were 11 units/mg before and 215 units/mg after reacting with His6-PDK1(ΔPH). Thus, the most significant effect of the phosphomimicking T389E mutation was to generate the catalytically active form of S6K1.
Equilibrium Titration Binding Studies
Although native and T389E mutant His6-S6K1αII(ΔAID) reacted nearly equally as well with His6-PDK1(ΔPH) (Fig. 2A), it was important to next determine the binding affinities that His6-PDK1(ΔPH) exhibits toward both the substrate and product forms of nucleotide, native His6-S6K1αII(ΔAID), and T389E mutant His6-S6K1αII(ΔAID). With this information, it would be possible to design stopped-flow kinetic studies of such binding steps. In order to pursue these interests, fluorescence detection assays were utilized.
For studies of nucleotide binding, fluorescently labeled Mant-ATP was chosen for use in competitive binding assays with either ATP or ADP. Since Mant-ATP did not exhibit any significant difference in fluorescence emission intensity between its free and its His6-PDK1(ΔPH)-bound form, protein binding was monitored by excitation of Trp residues in His6-PDK1(ΔPH) at 290 nm and continuously recording emission intensity of Mant-ATP at 450 nm.
First, a KinTek stopped-flow apparatus equipped with the TMX titration module was used to slowly and continuously titrate increasing concentrations of His6-PDK1(ΔPH) (1–3.6 μm) to a limiting fixed concentration of 0.5 μm Mant-ATP (Fig. 3A, trace a). Global fitting of the equilibrium titration data to Equation 1, derived for single-step binding, yielded a Kd of 1.6 μm for fluorescently labeled Mant-ATP (Table 1). Next, His6-PDK1(ΔPH) (1–3.6 μm) was slowly and continuously titrated into the cuvette containing 0.5 μm Mant-ATP in the presence of either 10 μm ATP substrate (Fig. 3A, trace b) or 10 μm ADP product (Fig. 3A, trace c). In these cases, global fitting of the data to Equation 2, derived for competitive single-step binding, showed the affinity of ATP (Kd = 1.4 μm) to be slightly higher than that of ADP (Kd = 3.3 μm) (Table 1).
FIGURE 3.

Fluorescence-based assays for equilibrium binding reactions of His6-PDK1(ΔPH). Using a KinTek TMX titration module, 20 μl of 40 μm His6-PDK1(ΔPH) was slowly and continuously titrated into 200 μl of kinase reaction buffer containing either 0.5 μm Mant-ATP (A, trace a) or 0.5 μm tamra-PIF (B and C, trace a). By using a fixed and limiting amount of fluorescently labeled ligand, significant increases in fluorescence intensity were observed (gray traces), and it was not necessary to correct for any inner filter effects. The base-line intensity of the free ligand was subtracted from the data, and the resulting fluorescence changes of ΔF450 nm (A, trace a) and ΔF560 nm (B and C, trace a) were plotted and analyzed. The solid lines (trace a) indicate fits of the equilibrium titration data to Equation 1 for a single-step binding mechanism, which yielded values of the corresponding molar fluorescence change (ΔFmol) and the equilibrium dissociation constant for the fluorescently labeled ligand (Kd) (Table 1). Equilibrium binding of ATP (A, trace b) and ADP (A, trace c); Thr-229 (unphosphorylated) (B, trace b) and Thr(P)-229 (phosphorylated) native His6-S6K1αII(ΔAID) (B, trace c); and Thr-229 (C, trace b) and Thr(P)-229 T389E mutant His6-S6K1αII(ΔAID) (C, trace c) were carried out exactly as for either Mant-ATP (A) or tamra-PIF (B and C), except in the presence of a 10 μm concentration of the designated unlabeled ligand. In these cases, the equilibrium titration data (traces b and c) were fitted to Equation 2 for a competitive single-step binding mechanism. Here, the measured Kd value of the fluorescently labeled ligand was fixed, and ΔFmol and the Kd value for the unlabeled ligand were obtained (Table 1).
TABLE 1.
Equilibrium and microscopic rate constants for His6-PDK1(ΔPH) binding to nucleotide and S6K1 substrates and products
| Ligand | Kd | kon | koff | koff/kon |
|---|---|---|---|---|
| μm | μm−1 s−1 | s−1 | μm | |
| Fluorescent ligands | ||||
| Mant-ATP | 1.6 ± 0.1 | 4.4 ± 0.1 | 6.6 ± 0.1 | 1.5 |
| tamra-PIF | 1.8 ± 0.1 | 14 ± 0.1 | 22 ± 0.1 | 1.6 |
| Nucleotides | ||||
| ATP | 1.4 ± 0.1 | 4.8 ± 0.1 | 5.9 ± 0.1 | 1.2 |
| ADP | 3.3 ± 0.1 | 5.9 ± 0.1 | 17 ± 0.2 | 2.9 |
| His6-S6K1αII(ΔAID) | ||||
| Thr-229 native | 1.2 ± 0.1 | 5.2 ± 0.1 | 7.4 ± 0.1 | 1.4 |
| Thr(P)-229 native | 9.3 ± 0.1 | 1.2 ± 0.1 | 10 ± 0.1 | 8.3 |
| Thr-229 T389E | 1.5 ± 0.1 | 4.0 ± 0.1 | 5.8 ± 0.1 | 1.5 |
| Thr(P)-229 T389E | 11 ± 0.1 | 0.90 ± 0.1 | 9.0 ± 0.2 | 10 |
Some time ago, Alessi and co-workers (33) reported that the kinase domain of PDK1 tightly associates with a short C-terminal peptide region of the PRK2 protein kinase, and they termed this region the PDK1-interacting fragment (PIF). The C-terminal 24 residues were synthesized and termed PIFtide (EPRILSEEEQEMFRDFDYIADWC), and surface plasmon resonance experiments showed PIFtide to bind PDK1 with Kd = 1.5 μm (33). The PIF region in PRK2 contains a short stretch of amino acids (FRDFDY) that resembles the Thr-389 phosphorylated hydrophobic motif region of S6K1 (FLGFpTY) (1), and early mutagenesis studies demonstrated interaction of such residues with a small pocket in the N-lobe of the kinase domain of PDK1 termed the PIF pocket (22). In addition, PIFtide directly inhibited PDK1-catalyzed Thr-229 phosphorylation of S6K1 (26).
With such prior knowledge, we synthesized the N-terminal fluorescently labeled PIFtide, 5-carboxytetra-methylrhodamine-EPRILSEEEQEMFRDFDYIADWC (tamra-PIF) and tested its use in direct and competitive binding assays with either the Thr-229-unphosphorylated or Thr-229-phosphorylated (Thr(P)-229) forms of native (Fig. 3B) and T389E mutant His6-S6K1αII(ΔAID) (Fig. 3C). In these cases, a significant increase in the fluorescence emission intensity at 560 nm of the N-terminal tamra label occurred upon binding of tamra-PIF to His6-PDK1(ΔPH) with its direct excitation at 425 nm. All measured Kd values are listed in Table 1. In summary, His6-PDK1(ΔPH) exhibited approximately equally high affinities toward the Thr-229 unphosphorylated substrate forms of native (Kd = 1.2 μm) and T389E mutant His6-S6K1αII(ΔAID) (Kd = 1.5 μm). Affinities toward the Tyr(P)-229 product forms were approximately equally weaker (Kd = 9–11 μm).
Stopped-flow Kinetic Binding Studies
In order to more fully characterize substrate and product binding, a stopped-flow apparatus was used to first measure time progressions for fluorescence changes that occurred upon binding of limiting Mant-ATP to varying excess His6-PDK1(ΔPH) (Fig. 4A). Global fitting of the concentration-dependent kinetic traces to a single-step mechanism yielded the association (kon; μm−1 s−1) and dissociation (koff; s−1) rate constants (Table 1). When His6-PDK1(ΔPH) was rapidly mixed with Mant-ATP in the presence of either ATP (Fig. 4B) or ADP (Fig. 4C), global fitting to a competitive single-step mechanism further yielded the association and dissociation rate constants of the unlabeled ligand (Table 1), and the koff/kon ratio measured for each nucleotide agreed well with each Kd value measured in equilibrium titrations (Fig. 3A and Table 1). This analysis showed similar association rate constants for His6-PDK1(ΔPH) binding to either ATP substrate (kon = 4.8 μm−1 s−1) or ADP product (kon = 5.9 μm−1 s−1). Most notably, the dissociation rate constant of ADP (koff = 17 s−1) exceeded that of ATP (koff = 5.9 s−1) by ∼3-fold, which accounts for its slightly weaker affinity.
FIGURE 4.

Stopped-flow kinetic studies of His6-PDK1(ΔPH) binding with nucleotides. Using a KinTek model SF-2004 stopped-flow apparatus, 20 μl of Mant-ATP (A) was mixed with 20 μl of His6-PDK1(ΔPH). The final concentrations after mixing were 0.5 μm Mant-ATP and either 1 (a), 2 (b), 3 (c), 5 (d), 7 (e), and 10 μm (f) His6-PDK1(ΔPH). The gray traces indicate that the time progress increases in fluorescence change (ΔF450 nm) that occurred on enzyme-ligand complex formation, and the solid lines indicate global fits of these progress curves to a single-step binding mechanism obtained with the DynaFit version 3.28 software, which yielded values of ΔFmol and the microscopic rate constants for association (kon) and dissociation (koff) (Table 1). Stopped-flow kinetics of binding of ATP (B) and ADP (C) were carried out exactly as for Mant-ATP. Except in these cases, the unlabeled nucleotide was included in the same syringe as Mant-ATP, yielding a final concentration of 10 μm. Each data set was globally analyzed with the DynaFit version 3.28 software according to a competitive single-step binding mechanism. The measured values of kon and koff for Mant-ATP were fixed, and fitted values of ΔFmol, kon, and koff were obtained for either ATP or ADP.
In analogous fashion, the stopped-flow apparatus was used to first measure the time progressions for fluorescence changes that occurred upon binding of limiting tamra-PIF to varying excess His6-PDK1(ΔPH) (Fig. 5A). Global fitting of these concentration-dependent kinetic traces to a single-step mechanism yielded the association (kon = 14 μm−1 s−1) and dissociation rate constants (koff = 22 s−1) (Table 1). Next, the same concentration-dependent reactions were carried out in the presence of a fixed amount of either the Thr-229 substrate or Thr(P)-229 product forms of (i) native (Fig. 5B) and (ii) T389E mutant His6-S6K1αII(ΔAID) (Fig. 5C). In contrast to the monophasic or single-exponential kinetic traces exhibited upon PDK1 binding to tamra-PIF alone (Fig. 5A), apparently biphasic kinetic traces were observed upon His6-PDK1(ΔPH) binding to tamra-PIF in the presence of either the native (Fig. 5B) or T389E mutant His6-S6K1αII(ΔAID) (Fig. 5C). Such behavior results from more rapid association of His6-PDK1(ΔPH) with fluorescent tamra-PIF compared with the given unlabeled S6K1 construct, where an initial maximum fluorescence occurs before subsequently decreasing due to partial displacement of tamra-PIF by S6K1 as equilibrium is approached.
FIGURE 5.

Stopped-flow kinetic studies of His6-PDK1(ΔPH) binding with His6-S6K1αII(ΔAID). Using a KinTek model SF-2004 stopped-flow apparatus, 20 μl of tamra-PIFTide (A) was mixed with 20 μl of His6-PDK1(ΔPH). The final concentrations after mixing were 0.5 μm tamra-PIFTide and either 1 (a), 2 (b), 3 (c), 5 (d), 7 (e), and 10 μm (f) His6-PDK1(ΔPH). The gray traces indicate the time progress increases in fluorescence change (ΔF560 nm) that occurred upon enzyme-ligand complex formation, and the solid lines indicate global fits of these progress curves to a single-step binding mechanism obtained with the DynaFit 3.28 software, which yielded values of ΔFmol and the microscopic rate constants for association (kon) and dissociation (koff) (Table 1). Stopped-flow kinetics of binding of the Thr-229 substrate (B, top) and Thr(P)-229 product (B, bottom) forms of native His6-S6K1αII(ΔAID) and the Thr-229 substrate (C, top) and Thr(P)-229 product (C, bottom) forms of T389E mutant His6-S6K1αII(ΔAID) were carried out exactly as for tamra-PIF, except in these cases, unlabeled His6-S6K1αII(ΔAID) was included in the same syringe as tamra-PIF, yielding a final concentration of 10 μm. Each data set was globally analyzed with the DynaFit version 3.28 software according to a competitive single-step binding mechanism. The measured values of kon and koff for tamra-PIFTide were fixed, and fitted values of ΔFmol, kon, and koff were obtained for either the Thr-229 substrate or Thr(P)-229 product forms of native and T389E mutant His6-S6K1αII(ΔAID).
The association and dissociation rate constants obtained from global fitting of each data set to a competitive single-step mechanism are further summarized in Table 1. The koff/kon ratios for binding of all ligands agreed well with the binding constants measured in equilibrium titrations (Fig. 3 and Table 1). This analysis showed similar association and dissociation rate constants for His6-PDK1(ΔPH) binding with the native and T389E mutant His6-S6K1αII(ΔAID) substrate forms (kon = 4.0–5.2 μm−1 s−1; koff = 5.8–7.4 s−1). Interestingly, the weaker affinities for the Thr(P)-229 product forms largely derived from decreased values of the association rate constants (kon = 0.9–1.2 μm−1 s−1; koff = 9–10 s−1).
Substrate-Substrate (S6K1-ATP) Interactions in Two-substrate Steady-state Kinetics
To date, the ability of protein kinase enzymes to catalyze phosphorylation has largely been studied using model peptide substrates or intact downstream protein targets that are not protein kinases. In these cases, complications are avoided in which the downstream peptide or phosphate accepting group does not compete with the kinase enzyme for binding the ATP substrate. However, the Thr-229-unphosphorylated substrate form of both native and T389E mutant His6-S6K1αII(ΔAID) exhibited residual catalytic activity toward the model S6K/RSK peptide substrate 1 (Fig. 2D). Therefore, the native and T389E mutant His6-S6K1αII(ΔAID) constructs were each titrated with [γ-32P]ATP at saturating peptide concentrations, and steady-state kinetic KmATP values of 75 ± 9 and 60 ± 8 μm were obtained, respectively. As such, it was likely that both the native and T389E mutant His6-S6K1αII(ΔAID) substrates could bind and deplete the pool of ATP during substrate titrations in steady-state kinetic studies, which would result in kinetic plots that resemble substrate inhibition.
As expected, systematic degrees of apparent substrate inhibition were observed in our initial two-substrate steady-state kinetic studies (supplemental Figs. S1A and S2A). Here, His6-PDK1(ΔPH) was titrated with varying total concentrations of His6-S6K1αII(ΔAID) (2, 5, 10, 20, 30, 50, and 100 μm) at different fixed total concentrations of ATP (2, 5, 10, 20, 30, 50, and 100 μm), and initial rates were measured. Data collection in this manner allowed construction of companion plots of the two varied substrates. Control experiments showed that the varying degrees of substrate inhibition are not due to technical limitations of the assay, such as filter saturation at higher protein substrate levels (supplemental Table S3).
The extent to which the S6K1-ATP substrate-substrate interaction occurred is best illustrated by comparing the total values of (i) [ATP]total and [T389]total (supplemental Fig. S1A) and (ii) [ATP]total and [E389]total (supplemental Fig. S2A) with the calculated values of (i) [ATP]free and [T389]free (supplemental Fig. S1B) and (ii) [ATP]free and [E389]free (supplemental Fig. S2B). Inspection of the data points in the upper panels shows that the calculated free substrate concentrations approximate those of the corresponding total concentrations. However, comparison of the data points in progressively lower panels shows that corrections become increasingly severe as the concentration of the “fixed” substrate is increased.
Even after correcting for the free concentration of the titrated substrate, the kinetic data remained nonhyperbolic. As expected, such apparent substrate inhibition upon titrating with His6-S6K1αII(ΔAID) becomes most pronounced with decreasing fixed total concentrations of ATP (supplemental Figs. S1B and S2B, upper right panels). Since the His6-S6K1αII(ΔAID) substrate exhibits affinity for the ATP substrate, the amount of apparently fixed [ATP]free is increasingly decreased from truly fixed [ATP]total as the designated His6-S6K1αII(ΔAID) substrate concentration is increased, and the fractional amount of ATP depletion is increasingly severe with decreasing [ATP]total.
More revealing is the observed apparent substrate inhibition upon titrating ATP, which again becomes most pronounced with decreasing fixed total concentrations of His6-S6K1αII(ΔAID) (supplemental Figs. S1B and S2B, left panels). In a similar fashion, the amount of apparently fixed [S6K1]free is increasingly decreased from truly fixed [S6K1]total as [ATP] is increased, and the fractional amount of S6K1 depletion is increasingly severe with decreasing [S6K1]total. This remarkable observation implies that His6-PDK1(ΔPH) enzyme does not readily phosphorylate the nucleotide-bound form of His6-S6K1αII(ΔAID). If PDK1 could equally phosphorylate either the nucleotide-free or nucleotide-bound form of His6-S6K1αII(ΔAID), then hyperbolic kinetics would be observed, since the effective concentration of the reactive species would remain at its fixed [S6K1]total.
In order to fit such data to general velocity equations derived for two-substrate kinetic mechanisms (Schemes 1 and 2), the concentration of the free forms of ATP and His6-S6K1αII(ΔAID) in each reaction assay were calculated from their total concentrations using Equation 6 and KdBA values of 75 and 60 μm for native and T389E mutant His6-S6K1αII(ΔAID), respectively. Here, the KdBA values were assumed to approximate the measured KmATP values exhibited by native and T389E mutant His6-S6K1αII(ΔAID). This assumption was made on the basis of our previous studies, which showed KmATP ≈ KdATP in the mechanism of fully activated His6-S6K1αII(ΔAID) (34). As further described below, the substrate inhibition observed when kinetic data were plotted as a function of total substrate concentration were well accommodated when the data were fitted to the calculated free concentrations.
Two-substrate Steady-state Kinetic Data Analysis
Inspection of the kinetic data in supplemental Figs. S1 and S2 further revealed that apparent Km values of (i) ATP (Km(app)A) and (ii) either native or T389E mutant and His6-S6K1αII(ΔAID) (Km(app)B) similarly increased with increasing “fixed” substrate concentrations. In light of the detection of rapid, high affinity binding of His6-PDK1(ΔPH) with both ATP and His6-S6K1αII(ΔAID) (Table 1), this appeared routinely consistent with a rapid equilibrium Random Bi Bi mechanism with negative substrate binding synergism (Scheme 1, α > 1).
Upon further consideration of such behavior, we deduced that the apparently negative binding synergism may as likely be accommodated by an Ordered Bi Bi mechanism with competitive substrate inhibition (Scheme 2). Similar to the Random Bi Bi mechanism (Scheme 1), the His6-PDK1(ΔPH) enzyme may form a binary complex with either ATP or His6-S6K1αII(ΔAID). However, in the Scheme 2 mechanism, initial binding of His6-S6K1αII(ΔAID) precludes subsequent ATP binding in a competitive manner. The kinetic formulation of this mechanism is outlined in the supplemental material.
Thus, the initial rate data in supplemental Figs. S1 and S2 were comparatively fitted to the general velocity Equations 9 (Scheme 1) and 10 (Scheme 2) while using the calculated free concentrations of ATP and His6-S6K1αII(ΔAID). The globally fitted lines are indicated for each mechanism, and the results for the reactions with native and T389E mutant His6-S6K1αII(ΔAID) are given in supplemental Table S1. Although it was difficult to distinguish between mechanisms on the basis of the goodness of fits, the fitted lines tended to deviate in titrations of His6-S6K1αII(ΔAID) at low fixed concentrations of ATP (supplemental Figs. S1 and S2, upper right panels). Here, the fitted solid line to the Scheme 2 mechanism exhibited a greater degree of downward curvature, which derives from true competitive substrate inhibition occurring in addition to the apparent inhibition due to the S6K1-ATP substrate-substrate interactions.
In order to better determine the occurrence of true competitive substrate inhibition as well as further test calculations of [ATP]free and [S6K1]free, a second set of two-substrate steady-state kinetic studies was carried out (Fig. 6). Here, total substrate concentrations were calculated (Equation 7 or 8) and adjusted so as to hold constant the concentration of the free form of one substrate during titration with the other substrate. In doing so, the systematic degrees of apparent substrate inhibition were essentially eliminated, yielding confidence in the calculated values of [ATP]free and [S6K1]free (A and B in Schemes 1 and 2). Moreover, a downward curvature of the initial rate data remained apparent in titrations of [E389]free at low fixed [ATP]free (Fig. 6B, upper right panels), suggestive of the competitive substrate inhibition predicted by Scheme 2.
FIGURE 6.

Two-substrate steady-state kinetics. His6-PDK1(ΔPH)-catalyzed Thr-229 phosphorylation of native His6-S6K1αII(ΔAID) (A) and T389E mutant His6-S6K1αII(ΔAID) (B) was performed at 25 °C. In both A and B, initial rates, k, were measured and directly plotted for (i) increasing concentrations of free ATP while maintaining a fixed free concentration of S6K1 (left) and (ii) increasing concentrations of free S6K1 while maintaining a fixed free concentration of ATP (right). The fixed free concentrations of either ATP or S6K1 were 2 (●), 5 (○), 10 (■), 20 (□), 30 (▴), 50 (▵), and 100 μm (▾). Dashed and solid lines indicate global fits of the data to Equations 9 (Scheme 1) and 10 (Scheme 2), respectively (Table 2).
Thus, the initial rate data of the second steady-state kinetic experiment (Fig. 6) were comparatively fitted to general velocity Equations 9 (Scheme 1) and 10 (Scheme 2) while using the calculated free concentrations of ATP and His6-S6K1αII(ΔAID). The globally fitted lines are indicated for each mechanism, and the results for the reactions with native and T389E mutant His6-S6K1αII(ΔAID) are given in Table S2. The fitted parameters from the two different steady-state kinetic experiments were in good agreement, and their averaged values and associated errors obtained for data analysis according to both Schemes 1 and 2 are listed in Table 2.
TABLE 2.
Comparison of steady-state kinetic constants obtained for His6-PDK1(ΔPH)-catalyzed Thr-229 phosphorylation of native and T389E mutant His6-S6K1αII(ΔAID)
The kinetic parameters are averaged values taken from the two different steady-state kinetic experiments (supplemental Tables S1 and S2), and the S.E. represents the square of the sum of squared S.E. for the two experiments.
| Kinetic constant | Native His6-S6K1αII(ΔAID) |
T389E His6-S6K1αII(ΔAID) |
||
|---|---|---|---|---|
| Scheme 1a | Scheme 2b | Scheme 1a | Scheme 2b | |
| kcat (s−1) | 1.0 ± 0.1 | 1.1 ± 0.1 | 1.1 ± 0.1 | 1.2 ± 0.1 |
| αKdA or KmA(μm) | 28 | 25 ± 4 | 14 | 15 ± 2 |
| αKdB or KmB (μm) | 24 | 27 ± 4 | 15 | 15 ± 2 |
| α (Km/Kd) | 20 ± 4 | na | 10 ± 2 | na |
| kcat/KmA (μm−1 s−1) | 0.036 | 0.044 | 0.078 | 0.080 |
| kcat/KmB (μm−1 s−1) | 0.042 | 0.041 | 0.073 | 0.080 |
a Equilibrium dissociation constants for binary complex formation of His6-PDK1(ΔPH) with ATP (KdA = 1.4 μm) and either native (KdB = 1.2 μm) or T389E mutant His6-S6K1αII(ΔAID) (KdB = 1.5 μm) were fixed according to their directly measured values, and the data were globally fitted to obtain values of kcat and α. Values of αKdA = KmA, αKdB = KmB, kcat/KmA, and kcat/KmB were calculated accordingly.
b Equilibrium dissociation constants for binary complex formation of His6-PDK1(ΔPH) with ATP (KdA = 1.4 μm) and either native (KiB = 1.2 μm) or T389E mutant His6-S6K1αII(ΔAID) (KiB = 1.5 μm) were fixed according to their directly measured values, and the data were globally fitted to obtain values of (i) the turnover number (kcat), (ii) the Michaelis constant of ATP (KmA), and (iii) the Michaelis constant of His6-S6K1αII(ΔAID) (KmB). Values of kcat/KmA and kcat/KmB were calculated accordingly.
Regardless of whether the reaction is analyzed according to either Scheme 1 or 2, it is foremost concluded that His6-PDK1(ΔPH) exhibits ∼2-fold increased specificity for the T389E mutant (kcat/KmA and kcat/KmB ∼0.08 μm−1 s−1) compared with native His6-S6K1αII(ΔAID) (kcat/KmA and kcat/KmB ∼0.04 μm−1 s−1). The ∼2-fold enhanced specificity derives primarily from lowered substrate Km values, since similar values of kcat = 1.0–1.2 s−1 were measured for the reactions with native and T389E mutant His6-S6K1αII(ΔAID) (Table 2).
Model Discrimination
Since it was again difficult to distinguish between mechanisms on the basis of the goodness of fits, the observed deviations in the fits were further explored. As mentioned above, the downward curvature of initial rate data on varying [E389]free at low fixed [ATP]free (Fig. 6B, upper right panels) is uniquely accommodated by the Scheme 2 mechanism. Such substrate inhibition diminishes with increasing fixed concentrations of ATP according to Equation 11,
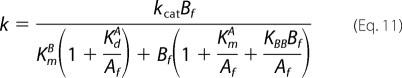 |
where Bf and Af represent [E389]free and [ATP]free, respectively (see supplemental material). For the rapid equilibrium Random Bi Bi mechanism (Scheme 1), no downward curvature can be accommodated in that such plots follow Michaelis-Menten kinetics.
Alternatively, the mechanisms of Schemes 1 and 2 may be further discerned by considering the behavior of initial rate data on varying [ATP]free at different fixed [S6K1]free (Fig. 6, A and B, left panels). In this case, Michaelis-Menten or hyperbolic kinetics are predicted for both mechanisms, but the secondary plot of Km(app)A versus [S6K1]free behaves differently. Therefore, the initial rate data obtained on varying [ATP]free at different fixed [S6K1]free (Fig. 6, A and B, left panels) were individually fitted to the standard Michaelis-Menten equation to obtain apparent values of kcat(app) and Km(app)A, and secondary plots of these values ± S.E. are shown in Fig. 7. The dashed and solid lines were generated using the designated secondary expression with the globally fitted kinetic parameters obtained for either the Scheme 1 or Scheme 2 mechanism (Fig. 6 and Table 2), respectively.
FIGURE 7.

Secondary plots from two-substrate steady-state kinetics. The steady-state kinetic data for titration of ATP at each different fixed concentration of either native (Fig. 6A, left) or T389E mutant His6-S6K1αII(ΔAID) (Fig. 6B, left) were individually fitted to the Michaelis-Menten equation to obtain apparent values of kcat(app) and Km(app)ATP. For plots of (i) kcat(app) (●) and Km(app)ATP (○) versus [T389]free and (ii) kcat(app) (■) and Km(app)ATP (□) versus [E389]free, the dashed lines were generated using the kinetic constants determined from the global fit of the data to Equation 9 (Scheme 1) and either Equation 12 (● and ■) or Equation 14 (○ and □), and the solid lines were generated using the kinetic constants determined from the global fit of the data to Equation 10 (Scheme 2) and either Equation 13 (● and ■) or Equation 15 (○ and □).
Whereas the secondary expressions for kcat(app) versus Bf ([S6K1]free) yield similar hyperbolic plots according to Equation 12 (Scheme 1) and Equation 13 (Scheme 2),
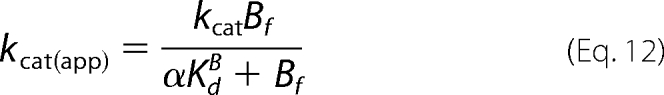 |
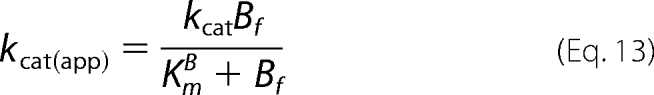 |
the secondary expressions of Km(app)A versus Bf differ according to Equation 14 (Scheme 1) and Equation 15 (Scheme 2).
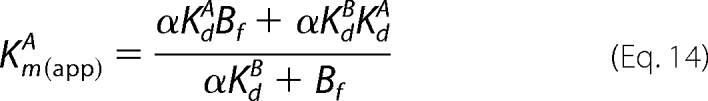 |
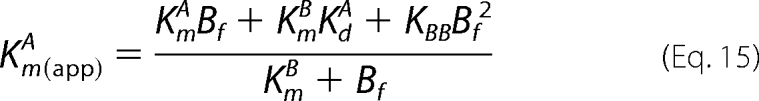 |
In the Scheme 2 mechanism, values of Km(app)A do not approach a limiting value but continually increase due to the additional Bf2 term in the numerator of Equation 15. Consistent with the deviations observed in the global fits (Fig. 6, A and B, lower left panels), the solid lines of the Scheme 2 mechanism in the secondary plots in Fig. 7 more closely approximate the increasing Km(app)A values, especially with respect to the reaction with the T389E mutant.
DISCUSSION
The initial aim of this study was to characterize the extent to which His6-PDK1(ΔPH)-catalyzed Thr-229 phosphorylation of His6-S6K1αII(ΔAID) was enhanced by the phosphomimicking T389E mutation in the conserved C-terminal hydrophobic motif of S6K1αII. From a number of previous accounts (25–28), it seemed rather clear that the recombinant His6-PDK1(ΔPH) catalytic domain construct would exhibit at least a 10-fold higher affinity and reactivity toward the T389E mutant over the native His6-S6K1αII(ΔAID). But to our surprise, we found that native and T389E mutant His6-S6K1αII(ΔAID) formed nearly equal high affinity complexes with PDK1 and underwent Thr-229 phosphorylation with nearly equal propensity.
We believe that the previously reported apparent inability of native His6-S6K1αII(ΔAID) to bind and undergo Thr-229 phosphorylation by His6-PDK1(ΔPH) (25–28) most simply resulted from impurities that co-purified with the native His6-S6K1αII(ΔAID) (Fig. 1B, lane 2). To a much lesser degree, this was observed for T389E mutant His6-S6K1αII(ΔAID) (Fig. 1C, lane 2). Fortunately, both native and T389E His6-S6K1αII(ΔAID) could be dissociated from such complexes by heparin-Sepharose chromatography, and the resulting purified constructs remained soluble and functionally stable at the concentrations required for binding and kinetic studies, albeit no higher than 25 °C.
Given the clear indication of the phosphate binding pocket in the x-ray structure of PDK1(ΔPH) (23), as well as its proposed activating role inferred from molecular modeling studies (3), we remained open to the possibility that the T389E mutation retained an ability to bind and activate Thr-229 chemical phosphorylation. In this case, the observed nearly equal steady-state turnover of native and T389E His6-S6K1αII(ΔAID) might simply be a consequence of equal rates of subsequent release of products. Thus, characterization of the substrate and product binding steps ensued. As demonstrated in Table 1, His6-PDK1(ΔPH) exhibited nearly equal affinities as well as nearly equal microscopic association and dissociation rate constants for binary complex formation with the substrate and product forms of native and T389E His6-S6K1αII(ΔAID). Since we have yet to devise effective assays for measuring binding events leading to formation of the ternary complex, kinetic methods were next employed to identify internal reaction steps sensitive to the T389E perturbation.
Since the purified Thr-229 unphosphorylated native and T389E His6-S6K1αII(ΔAID) constructs retained abilities to bind ATP, we devised two approaches for steady-state kinetic characterization of His6-PDK1(ΔPH)-catalyzed Thr-229 phosphorylation of His6-S6K1αII(ΔAID). In the first approach (supplemental Figs. S1 and S2), titrations of one substrate were carried out at different fixed total concentrations of the other substrate. In this way, it was possible to demonstrate the relative ability of a given substrate in a substrate-substrate interaction to bind and react with PDK1 enzyme. As expected, depletion of ATP upon titrating with His6-S6K1αII(ΔAID) resulted in the predicted amount of apparent substrate inhibition. But remarkably unexpected was the observation that ATP binding to His6-S6K1αII(ΔAID) precluded reactivity with PDK1 enzyme. This was confirmed by the second approach of calculating and adjusting total concentrations of the nontitrated substrate so as to maintain a fixed free concentration, which indeed yielded hyperbolic plots (Fig. 6).
In final consideration, steady-state kinetic characterization of T389E mutant His6-S6K1αII(ΔAID) revealed some degree of true substrate inhibition, which raised suspicions that His6-S6K1αII(ΔAID) binding to PDK1 enzyme precludes ATP binding. Regardless of by which mechanism the kinetic data were analyzed, His6-PDK1(ΔPH) exhibited a ∼2-fold enhanced specificity for the T389E mutant compared with native His6-S6K1αII(ΔAID), which derived predominantly from effects on substrate Km values. Since the substrate Km values were elevated 10–20-fold over their Kd values and approached the S6K1-ATP Kd values, it was not possible to achieve sufficient enzyme saturation levels required for pre-steady-state kinetic detection of (i) chemical phosphorylation and/or (ii) a possible rate-limiting step thereafter.
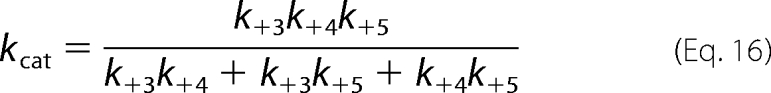
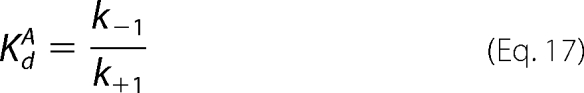
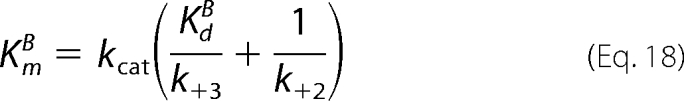
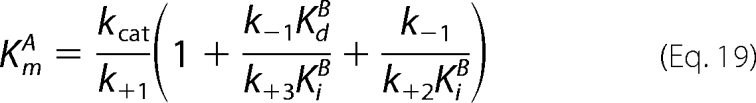
As the name implies, the rapid equilibrium Random Bi Bi mechanism is interpreted with respect to only the enzyme-substrate equilibrium binding affinities and overall turnover number, kcat (Scheme 1). But as elaborated in the supplemental material, King-Altman derivation and the rules of Cleland yielded explicit expressions for the measured steady-state kinetic constants in the Ordered Bi Bi mechanism with competitive substrate inhibition (Scheme 2), which are defined by Equations 16–20.
 |
 |
 |
 |
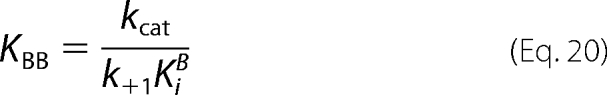 |
In these equations, KdB = k−2/k+2, and KiB = k−6/k+6; and the expressions derived for kcat (Equation 16), KdA (Equation 17), and KmB (Equation 18) are identical to those derived for the standard Ordered Bi Bi mechanism (Scheme 2; steps 1–5). With regard to the expression of KmA (Equation 19), the terms in parentheses are additional terms that distinguish the expression for KmA in the Ordered Bi Bi mechanism with competitive substrate inhibition from the standard Ordered Bi Bi mechanism (KmA = kcat/k+1). In final consideration, Equation 10 contains the one additional coefficient × concentration term, KBBBf2, and the unitless coefficient is defined by Equation 20.
With such equations in hand, it is possible to further pinpoint the reaction step for which Thr-389 phosphorylation might provide advantage (Fig. 8). Since the measured kcat values for the reactions with native and T389E mutant His6-S6K1αII(ΔAID) were approximately equal, the activating effect does not reside in reaction steps comprising chemical phosphorylation (k+3) and subsequent release of products (k+4, k+5) (Equation 16). Further noting (i) that ATP binding (k+1, k−1) is common to both reactions and (ii) that inhibitory binary complexes of His6-PDK1(ΔPH) with the native and T389E mutant His6-S6K1αII(ΔAID) were nearly equal (k+6, k−6), the activating effect must reside completely in the ability to form the reactive ternary complex (k+2, k−2) (Fig. 8).
FIGURE 8.

Comparison of reaction constants for His6-PDK1(ΔPH)-catalyzed Thr-229 phosphorylation of native and T389E mutant His6-S6K1αII(ΔAID). The microscopic rate constants are indicated for association (μm−1 s−1) and dissociation (s−1) of His6-PDK1(ΔPH) to and from its binary complexes with the substrate and product forms of the nucleotide (A and Q, vertical equilibria) and either native (B and P, left side equilibria) or T389E mutant His6-S6K1αII(ΔAID) (B and P, right side equilibria) (Table 1). Also, the equilibrium dissociation constants, KdBA (μm), are indicated for the complex of ATP with either the native or T389E mutant His6-S6K1αII(ΔAID) (BA, top diagonal equilibria). The kinetic and equilibria constants are depicted in the Ordered Bi Bi mechanism with competitive substrate inhibition (Scheme 2). In this mechanism, (i) His6-PDK1(ΔPH) cannot phosphorylate His6-S6K1αII(ΔAID) that is bound with ATP (BA), and (ii) the specificity for phosphorylation of the nucleotide-free form of His6-S6K1αII(ΔAID) is increased ∼2-fold upon positioning a negative charge at residue Thr-389. Such activation results from increasing the probability of achieving a productively bound ternary complex that leads to Thr-229 phosphorylation (EA ↔ EAB).
Since the product dissociation rate constant of ADP (k+5 = 17 s−1) exceeded kcat by ∼17-fold, the rate-limiting step can be either chemical phosphorylation (k+3) or release of Thr(P)-229 His6-S6K1αII(ΔAID) (k+4). In the case that chemistry is rate-limiting (k+3 ≈ kcat), the expressions for KmB (Equation 18) and KmA (Equation 19) each converge to KdB (= k−2/k+2). In the case that fast chemistry precedes rate-limiting product release (k+3 ≫ kcat; k+4 ≈ kcat), the expressions for KmB (Equation 18) and KmA (Equation 19) each converge to kcat/k+2. In either case, the KmA and KmB values are predicted to be nearly equal, and this is what made it difficult to discern from the rapid equilibrium Random Bi Bi mechanism. Since KdA ≈ KdB, negative binding synergism results in αKdA ≈ αKdB.
Regardless of whether the ∼2-fold activating effect on Km values by the T389E mutation occurs in either rapid equilibrium (k+3 ≈ kcat) or steady-state (k+3 ≫ kcat), both imply that binding of the second substrate occurs many times before chemistry takes place. For example, the specificity constant values (Table 2, kcat/Km ≈ 0.04 μm−1 s−1 for native and kcat/Km ≈ 0.08 μm−1 s−1 for T389E) were ∼100- and ∼50-fold lower than the microscopic association rate constants measured for binary complex formation of His6-PDK1(ΔPH) with either ATP or His6-S6K1αII(ΔAID) (Table 1) (kon = 4–5 μm−1 s−1). The fractional amount by which the specificity constant values were decreased may be considered to approximate the fractional amount of times that nonproductive binding events preclude reactive chemistry from occurring. Thus, we conclude overall that positioning a negative charge at residue Thr-389 minimizes nonproductive binding events and thereby increases the probability of achieving a productively bound ternary complex that leads to Thr-229 phosphorylation of His6-S6K1αII(ΔAID) (Fig. 8).
The Ordered Bi Bi mechanism with competitive substrate inhibition (Scheme 2 and Fig. 8) must only be regarded as the simplest mechanism that accommodates the in vitro binding and kinetic data for the isolated catalytic kinase domains of PDK1 and S6K1. Accordingly, the observation of dual substrate inhibition by both ATP and His6-S6K1αII(ΔAID) may yet be a consequence of more elaborate forms of Scheme 2. For example, an additional inhibited complex may form between the nucleotide-bound forms of both His6-PDK1(ΔPH) and His6-S6K1αII(ΔAID) (i.e. EA + BA ↔ EABA). Here, ATP binding to His6-S6K1αII(ΔAID) might either (i) simply alter accessibility of Thr-229 in the S6K1 T-loop or (ii) induce more diffuse structural changes in the overall catalytic complex. Less likely, a fair number of inhibited complexes could potentially exist in which ATP binds secondary sites on either His6-PDK1(ΔPH) or His6-S6K1αII(ΔAID).
To the extent that the in vitro studies showed a requirement for the nucleotide-free form of His6-S6K1αII(ΔAID) to be Thr-229-phosphorylated, it certainly appears to put constraints on the in vivo activity of PDK1, especially given the high levels of ATP/ADP in the cell. As such, a number of scenarios may be envisioned. For example, it has been shown that the C-terminal autoinhibitory domain of S6K1αII (AID; residues 399–502) suppresses catalytic activation by blocking the upstream kinase-mediated Thr-229 and Thr-389 phosphorylation events (4, 5), and further studies showed upstream kinase-mediated multisite Ser-Thr phosphorylation of AID (Ser-411, Ser-418, Thr-421, and Ser-424) to promote S6K1 T-loop and hydrophobic motif phosphorylation (35–39). We surmise that the C-terminal phosphorylated AID in full-length S6K1 may serve to either (i) abrogate nucleotide binding to S6K1 or (ii) correctly position Thr-229 for phosphorylation in a nucleotide-bound form of S6K1. The current formulation of the in vitro binding and kinetic data for the isolated catalytic kinase domains of PDK1 and S6K1 (Scheme 2 and Fig. 8) now provides an essential framework on which to test and more clearly understand how AID phosphorylation might promote the Thr-389 and Thr-229 activating phosphorylations of the S6K1 kinase domain.
In other precautionary notes, the T389E mutation activated Thr(P)-229-monophosphorylated His6-S6K1αII(ΔAID) ∼20-fold (Fig. 2D, lanes 2 and 4), indicating that the single negative charge (Glu) mimicked to some degree the intramolecular activating effect of Thr(P)-389. In contrast, the T389E mutation provided only ∼2-fold intermolecular activation of His6-PDK1(ΔPH)-catalyzed Thr-229 phosphorylation of His6-S6K1αII(ΔAID). Since we have yet to generate Thr(P)-389-monophosphorylated His6-S6K1αII(ΔAID) due to technical issues, we cannot rule out the possibility that the T389E mutant may not be an adequate Thr(P)-389 mimic. In any case, it is clear that pinpointing the reaction step where S6K1 productively binds to PDK1-ATP provides a new focus for future studies aimed to understand the Thr-229 specificity of this reaction as well as PDK1 specificity of T-loop phosphorylation of its other downstream AGC kinases. In this regard, the mechanistic approaches and considerations presented in this paper should be applicable and useful for study of other kinase → kinase activation reactions.
Supplementary Material
This work was supported, in whole or in part, by National Institutes of Health, NIGMS, Grant GM69868 (to T. K. H.). This work was also supported by a Maytag Fellowship (to M. M. K.).

The on-line version of this article (available at http://www.jbc.org) contains supplemental Scheme S1, Equations S1–S19, Figs. S1 and S2, and Tables S1–S3.
- His6-PDK1(ΔPH)
- N-terminal His6 affinity-tagged recombinant catalytic domain (residues 51–359) of PDK1 with deletion of C-terminal pleckstrin homology domain residues 360–556
- His6-S6K1αII(ΔAID)
- N-terminal His6 affinity-tagged recombinant catalytic domain of the αII isoform of S6K1 with deletion of C-terminal autoinhibitory domain residues 399–502
- Mant-ATP
- fluorescently labeled N-methylanthraniloyl-adenosine triphosphate
- ESI-TOF
- electrospray ionization-time of flight mass spectrometry
- PIF
- PDK1-interacting fragment
- tamra-PIF
- N-terminal fluorescently labeled peptide, 5-carboxytetramethylrhodamine-EPRILSEEEQEMFRDFDYIADWC
- MOPS
- 4-morpholinepropanesulfonic acid
- AID
- autoinhibitory domain.
REFERENCES
- 1.Peterson R. T., Schreiber S. L. (1999) Curr. Biol. 9,R521–R524 [DOI] [PubMed] [Google Scholar]
- 2.Grove J. R., Banerjee P., Balasubramanyam A., Coffer P. J., Price D. J., Avruch J., Woodgett J. R. (1991) Mol. Cell Biol. 11,5541–5550 [DOI] [PMC free article] [PubMed] [Google Scholar]
- 3.Frödin M., Antal T. L., Dümmler B. A., Jensen C. J., Deak M., Gammeltoft S., Biondi R. M. (2002) EMBO J. 21,5396–5407 [DOI] [PMC free article] [PubMed] [Google Scholar]
- 4.Alessi D. R., Kozlowski M. T., Weng Q. P., Morrice N., Avruch J. (1998) Curr. Biol. 8,69–81 [DOI] [PubMed] [Google Scholar]
- 5.Pullen N., Dennis P. B., Andjelkovic M., Dufner A., Kozma S. C., Hemmings B. A., Thomas G. (1998) Science 279,707–710 [DOI] [PubMed] [Google Scholar]
- 6.Mora A., Komander D., van Aalten D. M., Alessi D. R. (2004) Semin. Cell Dev. Biol. 15,161–170 [DOI] [PubMed] [Google Scholar]
- 7.Jensen C. J., Buch M. B., Krag T. O., Hemmings B. A., Gammeltoft S., Frödin M. (1999) J. Biol. Chem. 274,27168–27176 [DOI] [PubMed] [Google Scholar]
- 8.Richards S. A., Fu J., Romanelli A., Shimamura A., Blenis J. (1999) Curr. Biol. 9,810–820 [DOI] [PubMed] [Google Scholar]
- 9.Kobayashi T., Cohen P. (1999) Biochem. J. 339,319–328 [PMC free article] [PubMed] [Google Scholar]
- 10.Kobayashi T., Deak M., Morrice N., Cohen P. (1999) Biochem. J. 344,189–197 [PMC free article] [PubMed] [Google Scholar]
- 11.Cheng X., Ma Y., Moore M., Hemmings B. A., Taylor S. S. (1998) Proc. Natl. Acad. Sci. U.S.A. 95,9849–9854 [DOI] [PMC free article] [PubMed] [Google Scholar]
- 12.Alessi D. R., James S. R., Downes C. P., Holmes A. B., Gaffney P. R., Reese C. B., Cohen P. (1997) Curr. Biol. 7,261–269 [DOI] [PubMed] [Google Scholar]
- 13.Alessi D. R., Deak M., Casamayor A., Caudwell F. B., Morrice N., Norman D. G., Gaffney P., Reese C. B., MacDougall C. N., Harbison D., Ashworth A., Bownes M. (1997) Curr. Biol. 7,776–789 [DOI] [PubMed] [Google Scholar]
- 14.Stokoe D., Stephens L. R., Copeland T., Gaffney P. R., Reese C. B., Painter G. F., Holmes A. B., McCormick F., Hawkins P. T. (1997) Science 277,567–570 [DOI] [PubMed] [Google Scholar]
- 15.Stephens L., Anderson K., Stokoe D., Erdjument-Bromage H., Painter G. F., Holmes A. B., Gaffney P. R., Reese C. B., McCormick F., Tempst P., Coadwell J., Hawkins P. T. (1998) Science 279,710–714 [DOI] [PubMed] [Google Scholar]
- 16.Walker K. S., Deak M., Paterson A., Hudson K., Cohen P., Alessi D. R. (1998) Biochem. J. 331,299–308 [DOI] [PMC free article] [PubMed] [Google Scholar]
- 17.Dutil E. M., Toker A., Newton A. C. (1998) Curr. Biol. 8,1366–1375 [DOI] [PubMed] [Google Scholar]
- 18.Le Good J. A., Ziegler W. H., Parekh D. B., Alessi D. R., Cohen P., Parker P. J. (1998) Science 281,2042–2045 [DOI] [PubMed] [Google Scholar]
- 19.Chou M. M., Hou W., Johnson J., Graham L. K., Lee M. H., Chen C. S., Newton A. C., Schaffhausen B. S., Toker A. (1998) Curr. Biol. 8,1069–1077 [DOI] [PubMed] [Google Scholar]
- 20.Dong L. Q., Landa L. R., Wick M. J., Zhu L., Mukai H., Ono Y., Liu F. (2000) Proc. Natl. Acad. Sci. U.S.A. 97,5089–5094 [DOI] [PMC free article] [PubMed] [Google Scholar]
- 21.Torbett N. E., Casamassima A., Parker P. J. (2003) J. Biol. Chem. 278,32344–32351 [DOI] [PubMed] [Google Scholar]
- 22.Biondi R. M., Cheung P. C., Casamayor A., Deak M., Currie R. A., Alessi D. R. (2000) EMBO J. 19,979–988 [DOI] [PMC free article] [PubMed] [Google Scholar]
- 23.Biondi R. M., Komander D., Thomas C. C., Lizcano J. M., Deak M., Alessi D. R., van Aalten D. M. (2002) EMBO J. 21,4219–4228 [DOI] [PMC free article] [PubMed] [Google Scholar]
- 24.Casamayor A., Morrice N. A., Alessi D. R. (1999) Biochem. J. 342,287–292 [PMC free article] [PubMed] [Google Scholar]
- 25.Biondi R. M. (2004) Trends Biochem. Sci. 29,136–142 [DOI] [PubMed] [Google Scholar]
- 26.Biondi R. M., Kieloch A., Currie R. A., Deak M., Alessi D. R. (2001) EMBO J. 20,4380–4390 [DOI] [PMC free article] [PubMed] [Google Scholar]
- 27.Frödin M., Jensen C. J., Merienne K., Gammeltoft S. (2000) EMBO J. 19,2924–2934 [DOI] [PMC free article] [PubMed] [Google Scholar]
- 28.Balendran A., Currie R., Armstrong C. G., Avruch J., Alessi D. R. (1999) J. Biol. Chem. 274,37400–37406 [DOI] [PubMed] [Google Scholar]
- 29.Keshwani M. M., Ross D. B., Ragan T. J., Harris T. K. (2008) Protein Expr. Purif. 58,32–41 [DOI] [PMC free article] [PubMed] [Google Scholar]
- 30.Wang Z. X. (1995) FEBS Lett. 360,111–114 [DOI] [PubMed] [Google Scholar]
- 31.Kuzmic P. (1996) Anal. Biochem. 237,260–273 [DOI] [PubMed] [Google Scholar]
- 32.Segal I. H. (1975) Enzyme Kinetics, John Wiley & Sons, Inc., New York [Google Scholar]
- 33.Balendran A., Casamayor A., Deak M., Paterson A., Gaffney P., Currie R., Downes C. P., Alessi D. R. (1999) Curr. Biol. 9,393–404 [DOI] [PubMed] [Google Scholar]
- 34.Keshwani M. M., Harris T. K. (2008) J. Biol. Chem. 283,11972–11980 [DOI] [PMC free article] [PubMed] [Google Scholar]
- 35.Weng Q. P., Andrabi K., Kozlowski M. T., Grove J. R., Avruch J. (1995) Mol. Cell Biol. 15,2333–2340 [DOI] [PMC free article] [PubMed] [Google Scholar]
- 36.Weng Q. P., Kozlowski M., Belham C., Zhang A., Comb M. J., Avruch J. (1998) J. Biol. Chem. 273,16621–16629 [DOI] [PubMed] [Google Scholar]
- 37.Ferrari S., Bannwarth W., Morley S. J., Totty N. F., Thomas G. (1992) Proc. Natl. Acad. Sci. U.S.A. 89,7282–7286 [DOI] [PMC free article] [PubMed] [Google Scholar]
- 38.Mukhopadhyay N. K., Price D. J., Kyriakis J. M., Pelech S., Sanghera J., Avruch J. (1992) J. Biol. Chem. 267,3325–3335 [PubMed] [Google Scholar]
- 39.Cheatham L., Monfar M., Chou M. M., Blenis J. (1995) Proc. Natl. Acad. Sci. U.S.A. 92,11696–11700 [DOI] [PMC free article] [PubMed] [Google Scholar]
Associated Data
This section collects any data citations, data availability statements, or supplementary materials included in this article.