Abstract
To evaluate the rate enhancements produced by representative kinases and their thermodynamic basis, rate constants were determined as a function of changing temperature for 1) the spontaneous methanolysis of ATP and 2) reactions catalyzed by kinases to which different mechanisms of action have been ascribed. For each of these enzymes, the minor effects of changing viscosity indicate that kcat/Km is governed by the central chemical events in the enzyme-substrate complex rather than by enzyme-substrate encounter. Individual Arrhenius plots, obtained at intervals between pH 4.8 and 11.0, yielded ΔH‡ and TΔS‡ for the nonenzymatic methanolysis of ATP2−, ATP3−, and ATP4− in the absence of Mg2+. The addition of Mg2+ led to partly compensating changes in ΔH‡ and TΔS‡, accelerating the nonenzymatic methanolysis of ATP 11-fold at pH 7 and 25 °C. The rate enhancements produced by yeast hexokinase, homoserine kinase, and N-acetylgalactosamine kinase (obtained by comparison of their kcat/Km values in the presence of saturating phosphoryl acceptor with the second order rate constant for methanolysis of MgATP) ranged between 1012- and 1014-fold. Their nominal affinities for the altered substrates in the transition state were 2.1 × 10⁻¹⁶ m for N-acetylgalactosamine kinase, 7.4 × 10⁻¹⁷ m for homoserine kinase, and 6.4 × 10⁻¹⁸ m for hexokinase. Compared with nonenzymatic phosphoryl transfer, all three kinases were found to produce major reductions in the entropy of activation, in accord with the likelihood that substrate juxtaposition and desolvation play prominent roles in their catalytic action.
A common property shared by enzymes catalyzing biological reactions that involve a single substrate and hydrolytic and hydration reactions in which the effective concentration of water (the second substrate) cannot be elevated much above its concentration in living tissue is their ability to lower the reaction heat of activation. The rates of these enzymatic reactions are less sensitive to temperature than are the rates of the uncatalyzed reactions, so that the rate enhancements and transition state affinities generated by enzymes of this kind increase with decreasing temperature. Entropic effects tend to be minor, with an average change in the entropy of activation that approaches zero (1). That behavior seems understandable in view of the absence of a second substrate or the fact that the second substrate (water) is present in abundance. Thus, approximation effects seem relatively unlikely to play a major role in catalysis by enzymes of those types. Instead, enthalpic effects play a prominent role in catalysis, consistent with the formation in the transition state of new electrostatic and H-bonds between the enzyme and substrate, for which much evidence exists in the structures of enzymes crystallized with transition state analogue inhibitors (1).
The effects of enzymes on the enthalpies and entropies of activation of two-substrate reactions remain largely unexplored. The thermodynamics of activation (for an enzyme reaction and for the corresponding uncatalyzed reaction) were examined recently for an unusual two-substrate enzyme (2, 3). The peptidyl transferase center of the ribosome was found to produce a 3 × 10⁷-fold enhancement of the rate of peptidyl ester aminolysis entirely by rendering TΔS‡ more favorable, whereas ΔH‡ was actually found to become less favorable on the enzyme than in solution (3). Juxtaposition, that is, the gathering of two or more substrates at an enzyme active site in a configuration appropriate for reaction, appears to be partly responsible for that rate enhancement, and desolvation of the substrates may also contribute to the observed rate enhancement (4, 5). Thus, the ribosome might be said to function as a predominantly “physical” catalyst, bringing the substrates near each other in a water-poor environment rather than as a predominantly “chemical” catalyst that participates in the reaction as a general acid or a general base. Consistent with that interpretation is the finding that ribosomal peptidyl transfer is very strongly inhibited by a bisubstrate analogue devised by Yarus and co-workers (6).
Because of its unusual composition (consisting entirely of RNA) and the relatively small rate enhancement that it produces, the behavior of the peptidyltransferase center of the ribosome seems unlikely to be typical of two-substrate enzymes in general. The present work was undertaken with the limited objective of determining the magnitude and thermodynamic basis of the rate enhancements that are produced by several more conventional protein enzymes that catalyze reactions involving more than one substrate. The three enzymes examined here, yeast hexokinase, N-acetylgalactosamine kinase, and homoserine kinase, all bind the phosphoryl acceptor and MgATP in random order (7–9), and phosphoryl transfer is pH-insensitive over the pH range between ∼7.0 and 8.5 (8, 10, 11). These enzymes are stable and active over the temperature range between 0 and 50 °C, and product inhibition is negligible under the conditions of these experiments.
These three enzymes were chosen because they have different active site architectures that have led to different hypotheses about their mechanisms of action. The active site of yeast hexokinase is equipped with an aspartate residue that may act as a general base that deprotonates the acceptor alcohol (12). Many kinases are equipped with such a residue (13), although the extent of its involvement in the rate-determining step is unclear (14). In contrast, the crystal structures of N-acetylgalactosamine kinase (GalNAcK)2 and homoserine kinase (HSK) suggest the absence of an active site residue that might act as a general base. Thoden and Holden (15) have suggested that GalNAcK catalyzes phosphoryl transfer by juxtaposition of its two substrates, with a dissociative transition state like that of the spontaneous reaction. In the case of HSK, Krishna et al. (16) have proposed that the enzyme juxtaposes the substrates and stabilizes the non-bridging oxygen atoms of ATP in the transition state by interaction with backbone NH groups and by the positive end of a helix dipole. That proposal would seem to imply an associative transition state in which the non-bridging oxygen atoms carry more negative charge than they carry in the ground state. In a dissociative transition state, the non-bridging oxygen atoms would be expected to bear less negative charge than they do in the ground state, so that pairing them with positively charged groups would actually be expected to be anti-catalytic.
For comparison with these enzyme-catalyzed reactions of MgATP, we sought to determine the rate of a similar reaction in the absence of a catalyst. Earlier work has shown that at elevated temperatures, the γ-phosphorus atom of MgATP undergoes spontaneous attack by water in the absence of enzyme (17), that normal alcohols compete effectively with water in water-alcohol mixtures (18), and that in the transition state for spontaneous alcoholysis and hydrolysis, the bond to the leaving group appears to be almost fully broken, whereas the bond to the attacking nucleophile has only begun to form (18). Because Admiraal and Herschlag have shown that the rate of reaction is insensitive to the nature of the nucleophilic alcohol, a simple alcohol such as methanol would be expected to serve as a reasonable model for the reaction catalyzed by any kinase that mediates direct phosphoryl transfer from MgATP to an alcoholic acceptor. We, therefore, chose to examine the thermodynamics of activation for the methanolysis of ATP in the presence and absence of Mg2+ at various pH values using proton NMR to follow the course of reactions conducted in sealed tubes at elevated temperatures.
EXPERIMENTAL PROCEDURES
Unless otherwise noted, reagents were obtained from Sigma. The β-O-methyl ester of ADP (ADP-O-CH3) and the α-O-methyl ester of AMP (AMP-O-CH3) were prepared by condensation of ADP or AMP with methanol in the presence of 0.1 m dicyclohexylcarbodiimide in methanol as described by Darzykiewicz et al. (19).
Uncatalyzed Phosphoryl Transfer
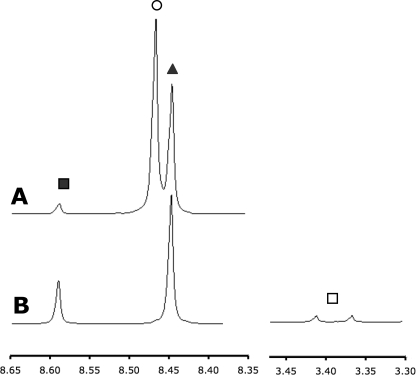
In a typical experiment, ADP or ATP (0.025 m), methanol (2 m), and anionic buffers (0.1 m, pH 4.8–9.0) were sealed in quartz tubes under vacuum and incubated in convection ovens (Barnstead/Thermolyne Corp., model 47900) at temperatures ranging between 50 and 110 °C (±1.5 °C as indicated by an American Society for Testing and Materials thermometer) for varying periods of time in buffers (0.1 m) consisting of potassium acetate (pH 4.8–6.0), methyl phosphonate (pH 7.0–8.0), or sodium carbonate (pH 9.0–11.0). Separate experiments involving the addition of potassium chloride showed that at the buffer concentrations used, reactions were insensitive to changes in ionic strength (less than 3% variation with ionic strength varying from 0.1 to 1.0). After reaction, samples were prepared for analysis by evaporation to dryness and dilution with D2O containing sodium carbonate buffer (0.1 m, pD 10.0), with dioxane (1.8 × 10⁻⁴ m) added as an internal integration standard (8 H, δ = 3.7 ppm). The integrated intensities of the proton signals arising from methyl phosphate and from the C8 adenine protons of ATP, ADP, and AMP (Fig. 1) were then measured using a Varian 600 MHz spectrometer. Data were acquired for a minimum of four transients using a standard water suppression pulse sequence and processed using SpinWorks (20).
FIGURE 1.
1H NMR spectra (500 MHz) of ATP hydrolysis reaction products AMP (■), ATP (○), and ADP (▴) (A) and ADP methanolysis reaction products AMP, ADP, and MeP (□) (B).
Metal-catalyzed Phosphoryl Transfer
In reactions conducted in the presence of MgCl2 and MnCl2, the concentration of metal ions (0.025 m) exceeded the value of Kd by at least 2 orders of magnitude (21). In experiments with added Mn2+, samples were prepared for NMR analysis by first removing Mn2+ ions by stirring with Chelex 100 beads (25% by volume) for 30 min followed by filtration to remove the beads. That treatment was repeated three times, and the filtrate was evaporated to dryness and taken up in D2O for 1H NMR as described above.
Kinase-catalyzed Phosphoryl Transfer
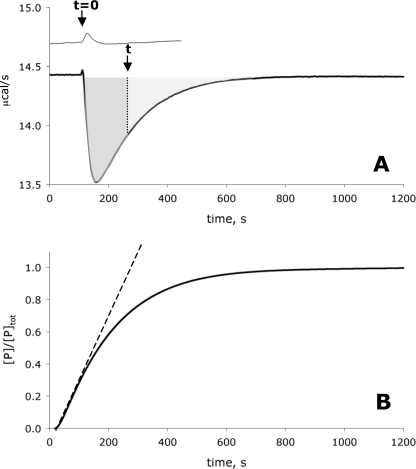
Homoserine kinase from Methanococcus jannaschii and human N-acetylgalactosamine kinase were a gift from Drs. Hazel Holden and James Thoden of the University of Wisconsin at Madison. Enzyme assays were performed using isothermal titration calorimetry (VP-ITC, Microcal, Northampton, MA) as described by Todd and Gomez (22). To determine kcat/Km using ATP as the variable substrate, the enzyme (∼1 × 10⁻⁸ m active sites) and saturating (0.01 m) substrate (see below) were first prepared in HEPES buffer (0.1 m, pH 8.0) with magnesium chloride (5 × 10⁻³ m) and degassed for 10 min to prevent bubble formation during the experiment. After thermal equilibration and a 200-s time lag to establish a base line, the second substrate, ATP (0.0075 ml), was injected into the reaction mixture (1.45 ml) to initiate the reaction. The final concentration of ATP (1 × 10⁻⁵ m) was well below its Km value for each of the enzymes examined (1.0 × 10⁻⁴ m for homoserine kinase (Table 1), 6.3 × 10⁻⁵ m for hexokinase (23), and 8.3 × 10⁻⁵ m for N-acetylgalactosamine kinase (Table 1)). In experiments of this kind, the enzyme reaction releases an amount of heat directly proportional to the amount of substrate turned over. The instrument output (Fig. 2A) reflects the amount of energy required to offset the heat generated by the reaction, and the lightly shaded area under the instrument response curve (Fig. 2A) represents the amount of heat generated in the turnover of 1 × 10⁻⁵ m ATP. The integrated area between substrate injection and time t (dark gray area) divided by the total area in the well represents the percentage of reaction that has occurred at time t,
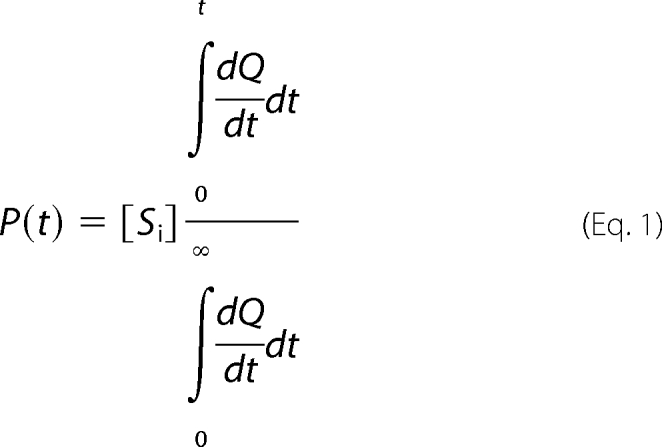 |
TABLE 1.
kcat and Km values for GalNAcK, HSK, and hexokinase measured calorimetrically compared with those reported in the literature
n.d., not determined.
FIGURE 2.
Isothermal calorimetric measurement of the second order rate constant of the reaction catalyzed by HSK. 1.5 ml of 3 × 10⁻⁸ m enzyme (lower trace) or 0 m enzyme (upper trace) in HEPES buffer, pH 8.0, with 0.1 m homoserine was loaded into the reaction cell and equilibrated at 25 °C. The reaction was initiated by injecting 7.5 × 10⁻³ ml ATP (to a final concentration of 1 × 10⁻⁵ m ATP, a concentration far below the Km for ATP) in the same buffer at t = 0. Calorimeter output is displayed as a plot of microcalories per second (μcal/s) versus time. When HSK was present in the reaction cell (lower trace), heat was generated in proportion to substrate turnover. To calculate the percentage of reaction completed at any time t (arrow), the area in the well at time t (dark gray-shaded area) was divided by the total area in the well (gray-shaded area) (A). In this way a continuous reaction curve of product as a function of time was generated. The first 10% of that curve was used to calculate the second order rate constant kcat/Km (B).
A continuous reaction curve was generated from the integral of the calorimeter output (Fig. 2B). Typically, conditions were arranged so that reactions ran to completion in ∼2000 s. The first 10% of the curve (excluding ∼30 s allowed for mixing immediately after injection) was used to calculate the rate constant. In a plot of the product formed as a function of time (Fig. 1B), that portion of the curve is approximately linear, and its slope is proportional to the second order rate constant, kcat/Km,
 |
where [EA] is the concentration of the enzyme saturated with the phosphoryl acceptor.
To verify the accuracy of this method, the results obtained calorimetrically at 25 °C were compared with those obtained using a coupled assay to detect ADP generation by the decrease in UV absorbance at 340 nm, arising from the oxidation of NADH in the presence of pyruvate kinase and lactate dehydrogenase (24) at 25 °C. The results obtained by these methods were in close agreement with each other, and the kcat and Km values determined by ITC were in close agreement with values from the literature (Table 1).
Effects of Viscosity
Relative viscosities were adjusted over the range between 1.0 and 6.5 by adding trehalose, polyethylene glycol (average molecular weight = 300), or sucrose. Viscosities of buffered solutions were measured using a Cannon-Fiske kinetic viscometer at 25 °C. Rate constants (kcat and kcat/Km) were determined using both the ITC method and the coupled enzyme assay described above. Effects of viscosity on kcat/Km were determined for each enzyme in the presence of saturating phosphoryl-accepting substrate (0.01 m) and subsaturating ATP (1 × 10⁻⁵ m). Effects of viscosity on kcat were determined with both ATP and the phosphoryl acceptor at saturating concentrations (0.01 m).
RESULTS
Specificity of Nonenzymatic ATP Methanolysis
In the presence of methanol the major reaction product was methyl phosphate (MeP), formed by transfer of the γ-phosphoryl group to methanol in a reaction analogous to the reactions catalyzed by kinases that phosphorylate hydroxyl groups. In principle, other products could also be formed by the reaction of ATP with methanol. Thus, methanol attack could occur at the β-position in a reaction analogous to that catalyzed by GTP diphosphokinase and thiamine diphosphokinase, or cleavage could occur between the α- and β-phosphoryl groups to yield ADP-O-CH3 (by methanol attack at the β-phosphoryl group) or AMP-O-CH3 (by attack at the α-phosphoryl group). Although no enzymes appear to catalyze reactions of the first type, many enzymes catalyze reactions of the second type, including DNA polymerases, aminoacyl-tRNA synthetases, and acyl-CoA synthetases. Finally, in a reaction analogous to that catalyzed by S-adenosyl methionine synthetase, ATP could undergo attack at the γ-phosphoryl group to yield 5′-methyl adenosine and inorganic triphosphate.
In fact, a small amount of ADP-O-CH3, equal to ∼1.5% of the amount of MeP formed, was observed in the 1H NMR spectrum of the product mixture arising from ATP methanolysis at pH 7.0 (doublet; δ = 3.55). Its identity was confirmed by the addition of authentic ADP-O-CH3. At low pH, but not at pH 7, a small amount of adenosine was also formed (∼1% the amount of MeP). No other products were observed by 31P or 1H NMR at pH 4.8 or 9.0 or in the presence of 0.025 m Mg2+ at pH 7.0. The sensitivity of the instrument was such that formation of methyl pyrophosphate or AMP-O-CH3 would have been observable if either of those reactions had occurred at rates equivalent to >0.1% of the rate of formation of MeP.
ADP and ATP Methanolysis Occur at Virtually Identical Rates
In aqueous methanol, ATP hydrolysis and methanolysis occur concurrently, and ADP formed during the reaction can then undergo a second hydrolysis or methanolysis reaction (Fig. 3) (the amount of AMP obtained by hydrolysis is equal to the difference between total amounts of AMP and MeP formed). To calculate the rate of ADP methanolysis, the observed rate of ADP decomposition (k3 + k4),
 |
was divided into methanolysis and hydrolysis terms based on the relative amounts of MeP and AMP formed,
 |
These equations were combined to evaluate k4,
FIGURE 3.
ATP hydrolysis and methanolysis reaction pathways.
ATP methanolysis is more complicated to analyze because MeP derived from ADP also contributes to the amount of product observed.
To estimate the value of k2, the disappearance of ATP was monitored to determine the composite rate constant (k1 + k2). The amount of “transient ADP” that decomposes in a second phosphorylation reaction is equal to the amount of AMP formed. Based on transient ADP and the ratio of k3 to k4 determined previously, the amount of MeP derived from ADP was estimated and subtracted from the total amount of MeP formed. The corrected result, representing the amount of MeP derived from ATP, was used to determine k2. The resulting rate constants were found to vary in proportion to the methanol concentration (data not shown).
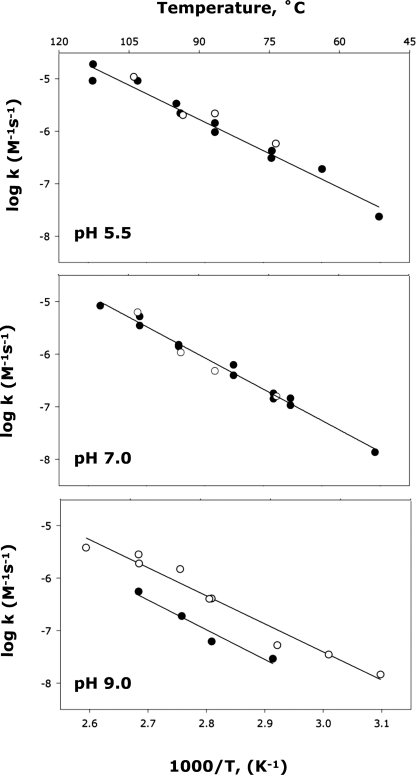
Arrhenius plots obtained for ADP and ATP methanolysis at pH 5.5 and 7.0 were found to be virtually superimposable (Fig. 4, top and middle panels). But at pH 9.0, where ADP and ATP are completely unprotonated, ATP4− reacted approximately twice as rapidly as ADP3− over the temperature range from 50 to 110 °C (Fig. 4, lower panel). That difference was also noted by Admiraal and Herschlag (18) in earlier experiments at high pH.
FIGURE 4.
Arrhenius plots of the rate constants for methanolysis of ATP (●) and ADP (○) methanolysis at pH 5. 5 (top), pH 7.0 (middle), and pH 9.0 (bottom).
ATP Methanolysis in the Absence of Mg2+
To obtain information about the methanolysis of ATP2−, ATP3−, and ATP4− in the absence of Mg2+, Arrhenius plots with at least six data points were gathered over the temperature range from 50 to 110 °C (R2 ≥ 0.975) at each of seven pH values between 4.8 and 9.0. Apparent pKa values of 6.5 and 4.3 were determined by titration at 25 °C under the conditions of the experiment. Comparable pKa values were reported earlier at this temperature and ionic strength (25).
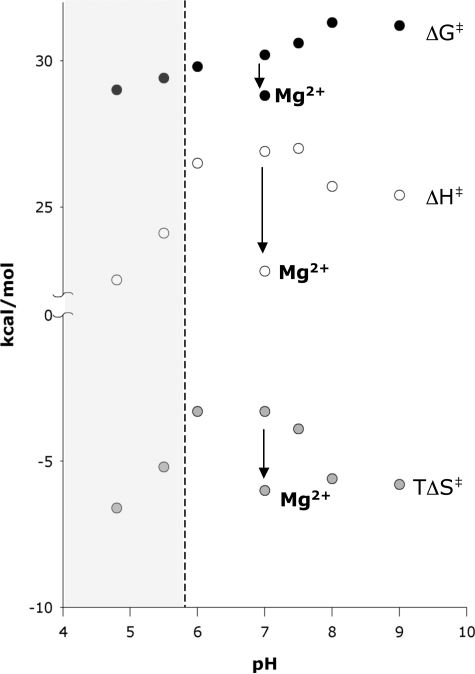
The methanolysis of ATP showed a gradual decrease in rate with increasing pH (Fig. 5). Similar behavior was described earlier by Tetas and Lowenstein (17) for ATP hydrolysis. Interestingly, ΔH‡ and TΔS‡ differed for each species of ATP, leading to an unusual pH profile with a maximum in the enthalpic barrier and a minimum in the entropic barrier at pH 6.0 (Fig. 5). The complexity of this behavior presumably arises from the very different heats of ionization of amines and phosphoric acid derivatives, and the fact that the ionization of ATP at pH 4.2 involves the loss of a proton from N1 of the adenine ring, whereas the ionization of ATP at pH 6.5 involves deprotonation of the γ-phosphoryl group (see “Discussion” for further information about the ionization of ATP). At pH 6.0–9.0, the contributions of ATP3− and ATP4− dominate the observed activation parameters, and at pH 5.5 and 4.8 the contribution of ATP2− to the observed activation parameters becomes evident (shaded portion of Fig. 5).
FIGURE 5.
Thermodynamics of activation for the methanolysis of ATP. At pH values to the right of the dashed line, the reaction of ATP3− and ATP4− contribute to the observed activation parameters. These data points were used to calculate the rate and thermodynamics of activation for the methanolysis of ATP3− (Table 2). At pH values in the shaded region to the left of the dashed line, ATP2− (protonated at N1) also contributes to the observed rate and activation parameters.
Rate constants and activation parameters for ATP3− methanolysis (Table 2) were estimated from the observed rates at pH 6.0–8.0, the measured rate constant for ATP4− methanolysis at pH 9.0, and the relative abundance of the ionized species of ATP3− derived from a titration curve. For example, at pH 8.0, 92.5% of ATP is present as ATP4−, and 7.5% of ATP is present as ATP3−. The rate of methanolysis of ATP4−, measured at pH 9.0, was found to be 7.1 × 10⁻¹¹ m−1 s−1. The observed rate constant for methanolysis at pH 8.0, 1.6 × 10⁻¹⁰ m−1 s−1, is the sum of the rate constants for ATP4− methanolysis and ATP3− methanolysis, with both values adjusted to reflect the relative abundance of the reacting species:
 |
In the same manner, the rate constant for ATP3− methanolysis was calculated for experiments carried out at pH 6.0, 7.0, 7.5, and 8.0. The average of the four values obtained for the rate constant for ATP3− methanolysis was 1.3 × 10⁻⁹ m−1 s−1, with a ΔG‡ value of 29.5 kcal/mol. No single value deviated from that average by more than 0.4 kcal/mol.
TABLE 2.
Rate constants and thermodynamics of activation for the methanolysis (boldface type) and hydrolysis (lightface type) of different species of ATP
In the case of hydrolysis the reactivity of water was taken as unity. Values for the reaction of ATP4−, MgATP, MnATP, and MgADP were obtained from Arrhenius plots. The estimated errors associated with the thermodynamic values obtained directly from Arrhenius plots are ≤0.4 kcal/mol. In the exceptional case of ATP3−, thermodynamic values shown represent mean values derived from four Arrhenius plots constructed at pH values between 6.0 and 8.0 as described under “Results.” No single value deviated from the mean by more than 0.8 kcal./mol. The S.D. of the measurements ranged from 0.1 to 1.0 kcal/mol.
| ΔG‡ | ΔH‡ | TΔS‡ | k25c | t½ (25 °C)d | |
|---|---|---|---|---|---|
| kcal/mol | kcal/mol | kcal/mol | |||
| ATP4− | 30.3a | 25.0 | −5.3 | 3.4 × 10⁻¹⁰ s−1m−1 | 67 years m |
| 28.9b | 27.9 | −1.0 | 1.5 × 10⁻⁹ s−1 | 6.3 years | |
| ATP3− | 29.5 | 26.8 | −2.7 | 1.3 × 10⁻⁹ s−1m−1 | 17 years m |
| 28.0 | 27.6 | −0.4 | 1.7 × 10⁻⁸ s−1 | 500 days | |
| Mg·ATP2− | 28.8 | 22.8 | −6.0 | 3.9 × 10⁻⁹ s−1m−1 | 5.6 years m |
| 27.5 | 25.6 | −1.9 | 3.8 × 10⁻⁸ s−1 | 210 days | |
| Mn·ATP2− | 28.1 | 22.1 | −6.0 | 1.4 × 10⁻⁸ s−1m−1 | 1.6 years m |
| 26.8 | 25.4 | −1.4 | 1.3 × 10⁻⁷ s−1 | 63 days | |
| Mg·ADP− | 30.3 | 24.5 | −5.7 | 3.4 × 10⁻¹⁰ s−1m−1 | 64 years m |
| 28.7 | 25.8 | −2.8 | 5.3 × 10⁻⁹ s−1 | 4.1 years |
a Methanolysis reaction values are in boldface rows.
b Hydrolysis reaction values are in lightface rows.
c Methanolysis rate constants are expressed in s−1 m−1. Hydrolysis rate constants are expressed in s−1.
d Methanolysis t½ values are for 1 m methanol.
The value of ΔH‡ was estimated from the slopes of the Arrhenius plots obtained at pH 6.0, 7.0, 7.5, and 8.0. The average value for ΔH‡ obtained from the four experiments was 26.8 kcal/mol. No single value deviated from that average by more than 0.8 kcal/mol.
ATP and ADP Methanolysis in the Presence of Mg2+
Because excessive amounts of divalent cation lead to aggregation of MgATP complexes (26), Mg2+ was maintained in these experiments at a concentration equivalent to that of the nucleotide. ITC experiments (not shown) indicated dissociation constants of 1.7 × 10⁻⁵ m for MgATP and 1.47 × 10⁻⁴ m for MgADP at 25 °C, in reasonable agreement with values from the literature (21). At 25 °C, with both components present at a concentration of 0.025 m, 97% of the ATP and 93% of the ADP are present as their Mg2+ complexes, and their Kd values have been shown to decrease with increasing temperature (27). Titrations of MgATP or MgADP indicated that at pH 7.0 the phosphoryl groups are completely unprotonated (MgATP2− and MgADP−).
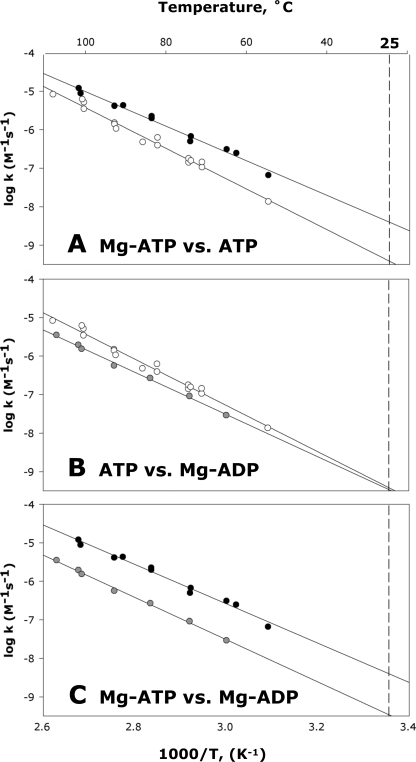
Whereas ADP and ATP are similarly reactive in the absence of Mg2+ (as described above), these nucleotides were found to exhibit differing reactivities in the presence of Mg2+ (Table 2). Fig. 6 shows Arrhenius plots for the methanolysis of MgATP, the methanolysis of MgADP, and the methanolysis of ATP in the absence of Mg2+ at pH 7.0. Data are shown in pairs to facilitate visual comparison. At all temperatures examined Mg2+ enhanced the rate of ATP methanolysis. And when the Arrhenius plots were extrapolated to room temperature, it became evident that Mg2+ accelerates ATP methanolysis by ∼1 order of magnitude at 25 °C (Fig. 6A), a larger factor than had been observed in earlier experiments at higher temperatures (17, 18). But ADP methanolysis behaved somewhat differently in that Mg2+ actually inhibited ADP methanolysis at high temperatures, whereas its effect was found to be almost negligible at 25 °C (Fig. 6B). MgADP methanolysis occurs 10-fold more slowly than MgATP methanolysis between 50 and 110 °C (Fig. 6C). The entropies of activation for MgATP and MgADP methanolysis were virtually identical (Table 2).
FIGURE 6.
Arrhenius plots of the rate constants for the methanolysis of MgATP (filled circle), MgADP (shaded circle), and ATP (open circle) at pH 7. 0. Data are shown in pairs to allow visual comparison. Panel A shows MgATP versus ATP in the absence of Mg2+ (pH 7.0), panel B shows ATP versus MgADP, and panel C shows MgATP versus MgADP. The extrapolation to 25 °C is shown (dashed vertical line).
Because Mn2+ and Mg2+ have been reported to form somewhat different complexes with ATP (possibly α-β-γ for Mn2+, as contrasted with β-γ for Mg2+ (28)), and because GalNAcK (like many other kinases) can use Mn2+ in place of Mg2+ with only a 2-fold reduction on the rate of reaction (8), we also examined the effect of Mn2+ on the uncatalyzed methanolysis of ATP. Because the Kd value of of Mn2+-ATP is 1.6 × 10⁻⁶ m, 99% of the ATP is complexed with the metal ion when both components are present at a concentration of 0.025 m. Thus, Mn2+ catalyzes ATP methanolysis slightly more effectively than does Mg2+. But the activation parameters are so similar for Mg2+ and Mn2+ (Table 2) that it appears unlikely that these ions increase the rate of ATP methanolysis by substantially different mechanisms.
Temperature Dependence of Enzyme Reaction Rates
In the present work we used isothermal calorimetry to determine the effects of temperature on the kinetic behavior of these enzymes directly and avoid complications that might arise from the use of coupling enzymes (each with its own temperature dependence). The kinetic constants obtained using ITC at 25 °C were in satisfactory agreement with values at 25 °C reported in the literature (Table 1).
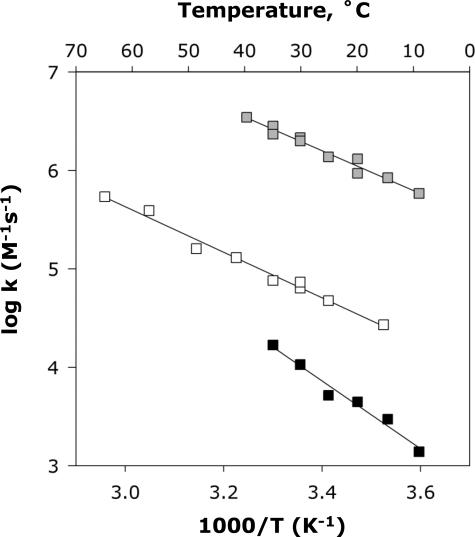
Plots of initial rates as a function of substrate concentration showed that GalNAcK binds the phosphoryl acceptor N-acetylgalactosamine (GalNAc) with positive cooperativity (data not shown). Hexokinase has been reported to exhibit similar behavior with glucose (29). But we observed no signs of cooperativity for homoserine in the case of HSK. In the presence of saturating phosphoryl acceptor, the influence of ATP concentration on the reactions catalyzed by all three kinases showed no signs of positive cooperativity. Therefore, to determine kcat/Km for GalNAcK and hexokinase, the phosphoryl-accepting substrate was chosen as the saturating substrate,3 and ATP was added at a limiting concentration (1 × 10⁻⁵ m) equivalent to ∼10% of the Km of ATP for each of the three kinases. Values of kcat/Km were determined at pH 8.0, where the activity of each of these enzymes is near maximal (8, 10, 11). For hexokinase and GalNAcK, rates were measured over the temperature range between 5 and 35 °C. For HSK, rates were measured over the temperature range between 10 and 65 °C. The results yielded linear Arrhenius plots (R2 > 0.97, Fig. 7), which were used to calculate the activation parameters shown in Table 3.
FIGURE 7.
Arrhenius plots of the second order rate constants for the reactions catalyzed by hexokinase (shaded squares), HSK (open squares), and GalNAcK (filled squares).
TABLE 3.
Rate constants and thermodynamics of activation for GalNAcK, HSK, and hexokinase
Data for the uncatalyzed reaction, the methanolysis of MgATP at pH 7.0, are taken from Table 2.
| Enzyme | ΔG‡ | ΔH‡ | TΔS‡ | k25 | Rate enhancement |
|---|---|---|---|---|---|
| kcal/mol | s−1m−1 | ||||
| GalNAcK | 12.0 | 15.2 | 3.2 | 1.0 × 10⁴ | 2.6 × 10¹² |
| HSK | 10.3 | 10.1 | −0.2 | 1.8 × 10⁵ | 4.6 × 10¹³ |
| Hexokinase | 8.9 | 9.4 | 0.5 | 1.8 × 10⁶ | 4.6 × 10¹⁴ |
| Uncatalyzed | 28.8 | 22.8 | −6.0 | 3.9 × 10⁻⁹ |
Viscosity Dependence
Viscosogens were used to test the possibility that either substrate binding or product release might occur more slowly than substrate transformation by each of the three kinases. If kcat reflected the unimolecular process of product release or if kcat/Km reflected the bimolecular process of substrate binding, then these relative rate constants would be expected to decrease with increasing viscosity. If substrate transformation were rate-determining, then no change in reaction rate would be expected to occur with increasing solvent viscosity.
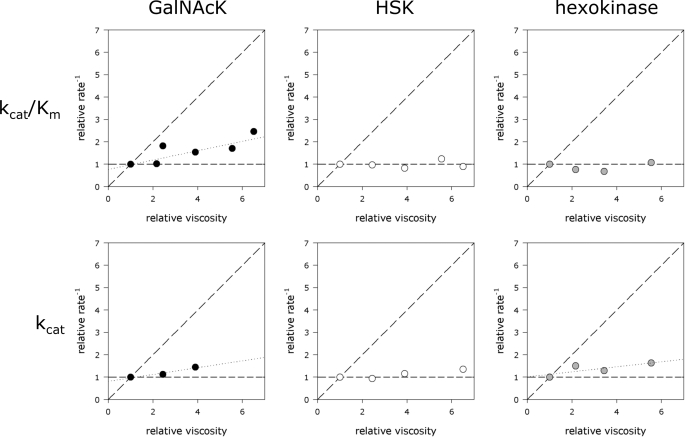
The present experiments were conducted using sucrose as the viscosogen at 25 °C using both ITC and the NADH-coupled assay methods. Some experiments were replicated using either trehalose or polyethylene glycol 300 as the viscosogen and established that the observed changes in reaction rate were because of viscosity effects rather than inhibition by sucrose. Fig. 8 shows that no significant viscosity dependence was observed for kcat or kcat/Km of GalNAcK nor for kcat/Km of hexokinase, indicating that these processes are not limited by physical diffusion. Small viscosity effects (with slopes <0.25) were observed for both kcat and kcat/Km in the case of HSK and for kcat in the case of hexokinase (Fig. 8). The small slopes observed suggest that for these kinases kcat and kcat/Km are not limited by diffusion.
FIGURE 8.
Effects of relative viscosity in the presence of added sucrose on kcat and kcat/Km for GalNAcK, HSK, and hexokinase at 25 °C. When small effects were observed (kcat/Km for GalNAcK, kcat for GalNAcK, and kcat for hexokinase) the points were fit to a line using linear least squares regression. Slopes of those lines are, respectively, 0.22, 0.15, and 0.11. Similar results were obtained using trehalose and polyethylene glycol 300 as viscosogens.
DISCUSSION
Phosphoryl Transfer from ATP to Methanol in the Absence of Mg2+
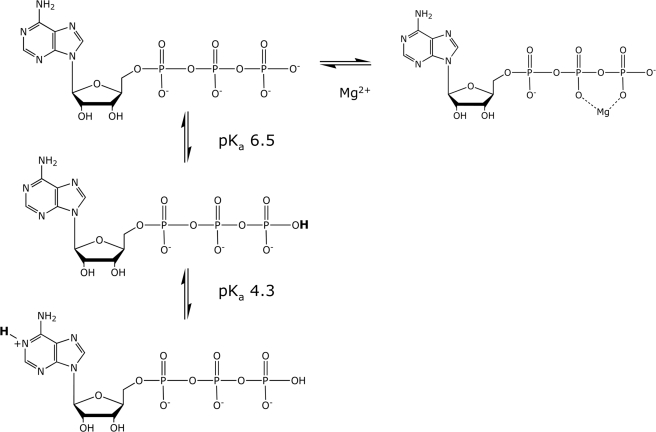
ATP exhibits two pKa values in the physiological pH range, ∼4.3 and ∼6.5. (Fig. 9). The lower value mainly describes the dissociation of a proton from N1 of the adenine ring of ATP2−, whose N1 is positively charged below that pKa value (32), whereas the higher value is largely associated with the loss of the second proton from the γ-phosphoryl group of ATP3−.
FIGURE 9.
Protonation and chelation states of ATP. The pKa values are indicated.
At first glance, N1 of the adenine ring might appear to be too distant from the β- and γ-phosphoryl groups of ATP to affect their reactivities. In solution, however, adenosine polyphosphates are not fully extended but adopt a compact anti conformation in which the α-phosphoryl group approaches the adenine ring (33). Thus, the pKa value of the adenine ring has been shown to be sensitive to the state of phosphorylation of adenosine, and the observed entropies of protonation imply that the conformations of both ATP and ADP in solution allow interaction between the positive charge on the adenine ring and the negative charge on the terminal phosphoryl group (34, 35). But in the case of AMP, the phosphoryl group and the adenine ring do not appear to interact, as the phosphoryl group of AMP does not affect the pKa value of the 1-(-NH+=) group of the adenine ring (34).) One consequence of these intramolecular interactions is that the inductive effects of the phosphoryl substituents deshield the adenine C8 proton (36) to differing extents, making it possible to quantify the relative amounts of AMP, ADP, and ATP in reaction mixtures by 1H NMR and to determine the rates and activation parameters for the hydrolysis and methanolysis of ADP and ATP (Fig. 1).
In the absence of Mg2+, the major products of reaction between and ATP and methanol were ADP and methyl phosphate. In addition, we observed ∼1.5% “wrong-way” cleavage at the β-phosphoryl group to form the secondary product ADP-O-CH3. This latter reaction does not correspond to any biological process that is currently known, although it has been suggested that ADP-O-CH3 might have served as a stable starting point for prebiotic RNA synthesis (37). No other products were observed.
The rates and activation parameters for phosphorylation of methanol in the absence of Mg2+ varied over the pH range examined in these experiments (4.8–11.0), in which ATP2− (ring-protonated), ATP3−, and ATP4− were present in varying proportions. The methanolysis of ATP3− was found to be more favorable entropically, but slightly less favorable enthalpically, than the methanolysis of ATP4−. At 25 °C, the methanolysis of ATP3− was found to proceed ∼4-fold more rapidly than the methanolysis of ATP4−. This behavior differs from that of phosphate monoesters, in which ionization increases reactivity (38–41) by factors as large as 109 (41), and from that of acyl phosphate anhydrides, in which reactivity increases ∼100-fold in alkaline solutions (42, 43).
At and below pH 5.5, the methanolysis of ATP2− (ring-protonated at N1) begins to contribute to the observed rate and activation parameters (Fig. 5). Superficially, it is clear that the methanolysis of ATP2− occurs more rapidly than the methanolysis of ATP3− and that the methanolysis of ATP2− is less favorable entropically but more favorable enthalpically than the methanolysis of ATP3− (Fig. 5). But because amines have substantial enthalpies of protonation (∼11 kcal/mol) (44), unlike phosphoryl groups (∼1 kcal/mol) (44), the fraction of ATP that is ring-protonated at any pH value varies markedly with temperature. That variation would need to be taken into account in any attempt at a more detailed interpretation of the thermodynamics of activation for methanol attack on ATP2− at low pH.
Effect of the Divalent Cation
In earlier comparisons of the rates of uncatalyzed solvolysis of ATP and MgATP, carried out at a single elevated temperature (17, 18), the presence of Mg2+ was shown to result in an approximate doubling of the rate. We confirmed those results, observing a 3.4-fold rate enhancement for ATP hydrolysis or methanolysis by Mg2+ at 80 °C (equivalent to a decrease of 0.7 kcal/mol in ΔG‡ at 80 °C). But the presence of Mg2+ exerts a more pronounced effect on the thermodynamics of activation; ΔH‡ for methanolysis becomes 4.1 kcal/mol more favorable, whereas TΔS‡ becomes 2.7 kcal/mol less favorable, than for reaction in the absence of Mg2+ (Fig. 5). Extrapolated to 25 °C, the presence of Mg2+ increases the rate of ATP methanolysis by a factor of 11 above that of the metal-free reaction at pH 7.0 (Table 2). Interestingly, Mg2+ was found to retard the degradation of ADP to AMP, and this effect became more pronounced with increasing temperature (Fig. 6).4
In addition to enhancing the rate of methanolysis of ATP by one order of magnitude, the presence of Mg2+ narrows the specificity of the nonenzymatic phosphorylation of methanol by enhancing the preference for ATP as a substrate and for the γ-phosphoryl group as the site of methanol attack. Thus, in the presence of Mg2+, at pH 7.0, methanolysis occurs at the γ-phosphoryl group >99.9% of the time. In the absence of Mg2+, as noted above, wrong-way cleavage at the β-phosphoryl group occurred ∼1.5% of the time to yield secondary product ADP-O-CH3.
Thermodynamic Basis of Kinase Catalysis
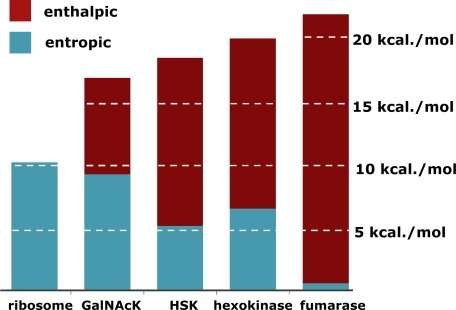
Fig. 10 shows that GalNAcK, HSK, and hexokinase vary in the extent to which they alter TΔS‡ and ΔH‡. HSK and hexokinase achieve a majority of their catalytic effect by decreasing the enthalpy of activation for substrate phosphorylation. The active site of HSK contains the positively charged end of a helix dipole in a position that appears to be appropriate for stabilizing an associative transition state (16). And hexokinase is equipped with an aspartate residue that may serve as a catalytic base (12). The substantial reduction in ΔH‡ produced by HSK and hexokinase appear to be consistent with those mechanistic possibilities. Notwithstanding the dominant enthalpic component of catalysis, HSK and hexokinase achieve a significant proportion of their rate enhancements by increasing TΔS‡. That entropic component of the catalytic effect may represent, at least in part, a requirement for substrate juxtaposition that is general for multisubstrate enzymes that proceed by direct group transfer.
FIGURE 10.
The proportion of kinase rate enhancements achieved by lowering ΔH‡ (red) and raising TΔS‡ (cyan). ΔΔH‡ and TΔΔS‡ were obtained by comparing thermodynamic parameters for kinase-catalyzed phosphoryl transfer with those for spontaneous MgATP methanolysis (Table 3). For comparison, the ribosome (2, 3) and a representative single-substrate enzyme, fumarase (1), are also shown.
In contrast, much of the rate enhancement produced by GalNAcK (9.2 kcal/mol, or 6 × 10⁶ -fold) is attained by raising the value of TΔS‡ by an amount comparable with that produced by the peptidyltransferase center of the ribosome (3). Thus, much of the catalytic effect of GalNacK may arise from substrate juxtaposition and desolvation. Consistent with that possibility, the crystal structure of GalNAcK fails to disclose the presence of any potential active site base or other chemical group that might be expected to stabilize the altered substrate in the transition state (15).
Nevertheless, GalNAcK also lowers the enthalpic activation barrier by 7.6 kcal/mol (equivalent to an additional 4 × 10⁵-fold rate enhancement). Without that enthalpic component, the rate of substrate turnover catalyzed by GalNAcK would fall short of the values required for biological function. Simple juxtaposition cannot overcome the free energy barriers that must be surmounted in slow chemical processes such as the alcoholysis of ATP. Additional enthalpic effects (which may include stabilizing interactions between the enzyme and the altered substrate in the transition state, desolvation, and interactions between the substrate and Mg2+) are required to accelerate these reactions to biological significant rates.
Kinase Rate Enhancements and Implications for Inhibitor Design
This work was undertaken with the limited objective of establishing the rate enhancements produced by several kinases that catalyze direct phosphoryl transfer to alcohols and the thermodynamic basis of those rate enhancements. From that information we hoped that it might be possible to learn whether, at least in principle, a bisubstrate analogue would be the best inhibitor that could be designed for a kinase or whether it might also be important to mimic the special polar interactions (H-bonds or electrostatic interactions) between enzyme and substrate that distinguish the substrates in the transition state from the substrates in the ground state.
In fact, the magnitudes of the rate enhancements that these enzymes produce (hexokinase, 4.6 × 10¹⁴-fold; HSK, 4.6 × 10¹³-fold; and GalNAcK, 2.6 × 10¹²-fold) are substantially greater than the maximal value (∼108-fold) that has been estimated to be achievable by juxtaposition and orientation alone (46). Each of the kinases examined in this work achieves a large rate enhancement not only by rendering the entropy of activation more favorable but also by reducing the enthalpy of activation. The behavior of these kinases differs from that of the peptidyltransferase center of the ribosome, which generates its relatively modest catalytic effect by entropic means alone.
We also hoped to learn whether the magnitude of the entropic component of an enzyme rate enhancement might furnish some indication of the importance of physical juxtaposition and desolvation for catalysis (as contrasted with more conventional chemical catalysis) and, hence, might provide some indication of its susceptibility to inhibition by a bisubstrate analogue. So far as we are aware, the appropriate inhibitors remain to be prepared and tested for GalNAc kinase or HSK. But adenylate kinase, which shares with GalNAc kinase the absence of any obvious catalytic base at the active site, is very strongly inhibited by the bisubstrate analogue P1,P5-di(adenosine-5′) pentaphosphate (Ki 4 × 10⁻⁹ m) (47). Conversely hexokinase, which is equipped with a basic group in a position appropriate for abstracting a proton from the phosphoryl acceptor, is inhibited very weakly by the corresponding bisubstrate analogue P1-(adenosine-5′)-P4-(glucose) tetraphosphate (Ki 4 × 10⁻² m) (48).
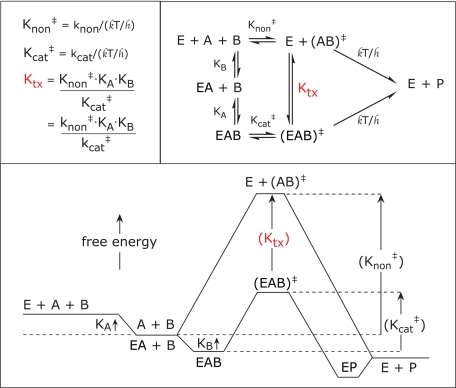
Finally, the rate constants observed for the enzymatic and nonenzymatic reactions make it possible to estimate the nominal affinities of the kinases considered here for the altered substrates in the transition state. Fig. 11 shows that for an enzyme that catalyzes a two-substrate reaction, the nominal dissociation constant of the reacting substrates in the transition state (Ktx) can be estimated by dividing the second order rate constant of the uncatalyzed reaction (knon), multiplied by the Km values of each of the substrates, by kcat (49). Applying that approach to the rate constants in Tables 1 and 2, we estimate that the approximate values of Ktx at 25 °C are 2.1 × 10⁻¹⁶ m for GalNAcK, 7.4 × 10⁻¹⁷ m for HSK, and 6.4 × 10⁻¹⁸ m for hexokinase. Those values imply that there is ample room for improvement in the design of inhibitors of this important class of enzymes.
FIGURE 11.
Transition state binding for a two-substrate reaction. In the case of the reactions described here, E represents the enzyme, A represents the phosphoryl-accepting substrate alcohol, B represents ATP, P represents the products, k is the Boltzmann constant, and h is the Planck constant.
Acknowledgments
We thank Drs. Hazel Holden and James Thoden (University of Wisconsin at Madison) for gifts of N-acetylgalactosamine kinase and homoserine kinase and Dr. Stefan Lutz (Emory University) for bringing the use of isothermal titration calorimetry for enzyme kinetics to our attention. We are also grateful to Dr. Ashutosh Tripathy (Macromolecular Interactions Facility, University of North Carolina at Chapel Hill) for assistance with isothermal calorimetry.
This work was supported, in whole or in part, by National Institutes of Health Grant GM 18325.
At 27 °C, 38.8% of glucose is present in solution as the α-pyranoside, and 60.9% of glucose is present as the β-pyranoside. The equilibrium is insensitive to changing temperature; the relative abundance of the α-anomer increases by ∼1% over 40 °C (30). Hexokinase binds and phosphorylates both anomers, with only slight discrimination between these species (Km = 5.8 × 10⁻⁵ and 6.6 × 10⁻⁵ m, respectively, and Vmax was 1.3 times greater for the α-pyranoside than for the β-pyranoside (31)).
Since ATP binds Mg2+ with little effect on the rate of reaction in the absence of the enzyme, but Mg2+ is essential for reactions in the presence of the enzyme, it follows that Mg2+ is more strongly bound in the transition state for the enzyme reaction than in the transition state for the uncatalyzed reaction. The extent to which the catalytic effects of the enzyme and Mg2+ are interdependent seems to vary among kinases. At one extreme, crystal structures suggest that the active site of UMP/CMP kinase from Dictyostelium discoideum makes no contact with the metal ion, so that the requirement for Mg2+ might be considered to arise entirely from interactions between the metal ion and the substrate (45). But in other kinases including the three examined here, the metal ion forms a bridge between the enzyme and ATP (14). In those cases the absence of the metal ion presumably interrupts the network of enzyme-substrate interactions that stabilizes the transition state.
- GalNAcK
- N-acetylgalactosamine kinase
- ITC
- isothermal titration calorimetry
- MeP
- methyl phosphate
- HSK
- homoserine kinase.
REFERENCES
- 1.Wolfenden R., Snider M., Ridgway C., Miller B. (1999) J. Am. Chem. Soc. 121,7419–7420 [Google Scholar]
- 2.Sievers A., Beringer M., Rodnina M. V., Wolfenden R. (2004) Proc. Natl. Acad. Sci. U.S.A. 101,7897–7901 [DOI] [PMC free article] [PubMed] [Google Scholar]
- 3.Schroeder G. K., Wolfenden R. (2007) Biochemistry 46,4037–4044 [DOI] [PubMed] [Google Scholar]
- 4.Trobro S., Aqvist J. (2006) Biochemistry 45,7049–7056 [DOI] [PubMed] [Google Scholar]
- 5.Sharma P. K., Xiang Y., Kato M., Warshel A. (2005) Biochemistry 44,11307–11314 [DOI] [PubMed] [Google Scholar]
- 6.Welch M., Chastang J., Yarus M. (1995) Biochemistry 34,385–390 [DOI] [PubMed] [Google Scholar]
- 7.Danenberg K. D., Cleland W. W. (1975) Biochemistry 14,28–39 [DOI] [PubMed] [Google Scholar]
- 8.Pastuszak I., Drake R., Elbein A. D. (1996) J. Biol. Chem. 271,20776–20782 [DOI] [PubMed] [Google Scholar]
- 9.Shames S. L., Wedler F. C. (1984) Arch. Biochem. Biophys. 235,359–370 [DOI] [PubMed] [Google Scholar]
- 10.Viola R. E., Cleland W. W. (1978) Biochemistry 17,4111–4117 [DOI] [PubMed] [Google Scholar]
- 11.Daugherty M., Vonstein V., Overbeek R., Osterman A. (2001) J. Bacteriol. 183,292–300 [DOI] [PMC free article] [PubMed] [Google Scholar]
- 12.Cleland W. W., Hengge A. C. (1995) FASEB J. 9,1585–1594 [DOI] [PubMed] [Google Scholar]
- 13.Jones J. P., Weiss P. M., Cleland W. W. (1991) Biochemistry 30,3634–3639 [DOI] [PubMed] [Google Scholar]
- 14.Matte A., Tari L. W., Delbaere L. T. (1998) Structure 6,413–419 [DOI] [PubMed] [Google Scholar]
- 15.Thoden J. B., Holden H. M. (2005) J. Biol. Chem. 280,32784–32791 [DOI] [PubMed] [Google Scholar]
- 16.Krishna S. S., Zhou T., Daugherty M., Osterman A., Zhang H. (2001) Biochemistry 40,10810–10818 [DOI] [PubMed] [Google Scholar]
- 17.Tetas M., Lowenstein J. M. (1963) Biochemistry 2,350–357 [DOI] [PubMed] [Google Scholar]
- 18.Admiraal S. J., Herschlag D. (1995) Chem. Biol. 2,729–739 [DOI] [PubMed] [Google Scholar]
- 19.Darzynkiewicz E., Ekiel I., Tahara S. M., Seliger L. S., Shatkin A. J. (1985) Biochemistry 24,1701–1707 [Google Scholar]
- 20.Marat K. (1999–2007) SpinWorks, Version 2.5.2, University of Manitoba, Winnipeg, Manitoba, Canada [Google Scholar]
- 21.Smith R. M., Alberty R. A. (1956) J. Am. Chem. Soc. 78,2376–2380 [Google Scholar]
- 22.Todd M. J., Gomez J. (2001) Anal. Biochem. 296,179–187 [DOI] [PubMed] [Google Scholar]
- 23.Sem D. S., Cleland W. W. (1991) Biochemistry 30,4978–4984 [DOI] [PubMed] [Google Scholar]
- 24.Kornberg A., Pricer W. E., Jr. (1951) J. Biol. Chem. 193,481–495 [PubMed] [Google Scholar]
- 25.Alberty R. A., Smith R. M., Bock R. M. (1951) J. Biol. Chem. 193,425–434 [PubMed] [Google Scholar]
- 26.Glonek T. (1992) Int. J. Biochem. 24,1533–1559 [DOI] [PubMed] [Google Scholar]
- 27.Wang P., Oscarson J. L., Izatt R. M., Watt G. D., Larsen C. D. (1995) J. Solution Chem. 24,989–1012 [Google Scholar]
- 28.Cohn M., Hughes T. R., Jr. (1962) J. Biol. Chem. 237,176–181 [PubMed] [Google Scholar]
- 29.Feldman I., Kramp D. C. (1978) Biochemistry 17,1541–1547 [DOI] [PubMed] [Google Scholar]
- 30.Maple S. R., Allerhand A. (1987) J. Am. Chem. Soc. 109,3168–3169 [Google Scholar]
- 31.Bailey J. M., Fishman P. H., Pentchev P. G. (1968) J. Biol. Chem. 243,4827–4831 [PubMed] [Google Scholar]
- 32.Smith R. M., Martell A. E., Chen Y. (1991) Pure Appl. Chem. 63,1015–1080 [Google Scholar]
- 33.Wang P., Izatt R. M., Oscarson J. L., Gillespie S. E. (1996) J. Phys. Chem. 100,9556–9560 [Google Scholar]
- 34.Oscarson J. L., Wang P., Gillespie S. E., Izatt R. M., Watt G. D., Larsen C. D., Renuncio J. A. (1995) J. Solution Chem. 24,171–200 [Google Scholar]
- 35.Sarvazyan A. P., Bukin V. A., Hemmes P. (1980) J. Phys. Chem. 84,692–696 [Google Scholar]
- 36.Tribolet R., Sigel H. (1987) Eur. J. Biochem. 163,353–363 [DOI] [PubMed] [Google Scholar]
- 37.Wang K. J., Ferris J. P. (2005) Orig. Life Evol. Biosph. 35,187–212 [DOI] [PubMed] [Google Scholar]
- 38.Bunton C. A., Llewellyn D. R., Oldham K. G., Vernon C. A. (1958) J. Chem. Soc. 3574–3587 [Google Scholar]
- 39.Butcher W. W., Westheimer F. H. (1955) J. Am. Chem. Soc. 77,2420–2424 [Google Scholar]
- 40.Kirby A. J., Varvoglis A. G. (1967) J. Am. Chem. Soc. 89,415–423 [Google Scholar]
- 41.Lad C., Williams N. H., Wolfenden R. (2003) Proc. Natl. Acad. Sci. U.S.A. 100,5607–5610 [DOI] [PMC free article] [PubMed] [Google Scholar]
- 42.Di Sabato G., Jencks W. P. (1961) J. Am. Chem. Soc. 83,4400–4405 [Google Scholar]
- 43.Koshland D. E. (1951) J. Am. Chem. Soc. 73,4103–4108 [Google Scholar]
- 44.Edsall J. T., Wyman J. (1958) in Biophysical Chemistry, pp. 452–453, Academic Press Inc., New York [Google Scholar]
- 45.Scheffzek K., Kliche W., Wiesmüller L., Reinstein J. (1996) Biochemistry 35,9716–9727 [DOI] [PubMed] [Google Scholar]
- 46.Page M. I., Jencks W. P. (1971) Proc. Natl. Acad. Sci. U.S.A. 68,1678–1683 [DOI] [PMC free article] [PubMed] [Google Scholar]
- 47.Lienhard G. E., Secemski I. I. (1973) J. Biol. Chem. 248,1121–1123 [PubMed] [Google Scholar]
- 48.Danenberg P. V., Danenberg K. D. (1977) Biochim. Biophys. Acta 480,351–356 [DOI] [PubMed] [Google Scholar]
- 49.Wolfenden R. (1972) Acc. Chem. Res. 5,10–18 [Google Scholar]


