Abstract
Hypoxia induces expression of the urokinase receptor (uPAR) and activates uPAR-dependent cell signaling in cancer cells. This process promotes epithelial-mesenchymal transition (EMT). uPAR overexpression in cancer cells also promotes EMT. In this study, we tested whether uPAR may be targeted to reverse cancer cell EMT. When MDA-MB 468 breast cancer cells were cultured in 1% O2, uPAR expression increased, as anticipated. Cell-cell junctions were disrupted, vimentin expression increased, and E-cadherin was lost from cell surfaces, indicating EMT. Transferring these cells back to 21% O2 decreased uPAR expression and reversed the signs of EMT. In uPAR-overexpressing MDA-MB 468 cells, EMT was reversed by silencing expression of endogenously produced urokinase-type plasminogen activator (uPA), which is necessary for uPAR-dependent cell signaling, or by targeting uPAR-activated cell signaling factors, including phosphatidylinositol 3-kinase, Src family kinases, and extracellular signal-regulated kinase. MDA-MB 231 breast cancer cells express high levels of uPA and uPAR and demonstrate mesenchymal cell morphology under normoxic culture conditions (21% O2). Silencing uPA expression in MDA-MB-231 cells decreased expression of vimentin and Snail, and induced changes in morphology characteristic of epithelial cells. These results demonstrate that uPAR-initiated cell signaling may be targeted to reverse EMT in cancer.
Epithelial-mesenchymal transition (EMT)2 is a well recognized process in embryonic development (1). To facilitate migration of neural crest cells out of the neuroectoderm, N-cadherin-based cell adhesions are lost. Endocardial cells adopt a mesenchymal cell phenotype during formation of cardiac septa and valves. EMT also may be involved in metastasis of epithelial cell malignancies (2). In cancer cell EMT, E-cadherin protein and activity are decreased, causing disruption of cell-cell junctions and loss of cell polarity. At the same time, cancer cells that undergo EMT demonstrate increased expression of mesenchymal cell proteins such as vimentin. Loss of E-cadherin, in human malignancies, may reflect mutation of the E-cadherin gene or E-cadherin promoter hypermethylation (3–5). E-cadherin expression also may be repressed at the transcriptional level by Slug, Snail, or Twist (6–9). Experimental regulation of E-cadherin expression controls cancer progression in mouse model systems (10–13).
Activation of the phosphatidylinositol 3-kinase (PI3K) and Akt promotes EMT in cancer cells (14). Akt phosphorylates and thereby inactivates glycogen synthase kinase-3β (GSK-3β), increasing Snail activity by regulating Snail expression, degradation, and nuclear localization (6, 7, 15, 16). Wnt signaling also regulates GSK-3β and thereby supports EMT by downstream effects on Snail and Slug (17). Extracellular signal-regulated kinase (ERK1/2) increases expression of Snail (18). Rac1 and its alternatively spliced variant, Rac1b, control Snail expression and activity, through a pathway that involves reactive oxygen species and NF-κB (19). Finally, Src family kinases (SFKs) phosphorylate E-cadherin, promoting binding of the E3 ubiquitin-ligase, Hakai, and E-cadherin ubiquitination (20).
We recently described a pathway in which hypoxia induces EMT in cancer cells by increasing expression of the urokinase receptor (uPAR) and by activating uPAR-dependent cell signaling (21). Hypoxia also may induce EMT in cancer cells by activating hypoxia-inducible factor-1 (HIF-1)-promoted Twist expression (22) or Notch signaling (23). uPAR has two distinct ligands, which activate different cell signaling pathways. Binding of urokinase-type plasminogen activator (uPA) to uPAR activates ERK1/2 and PI3K (24, 25). Binding of uPAR to vitronectin activates Rac1 (26–28).
There is mounting evidence suggesting that hypoxia may initiate metastasis programs in cancer cells. Adopting a metastatic phenotype may occur as a result of uPAR activation in conjunction with EMT (21) or involve other receptors, such as the erythropoietin receptor or the receptor for hepatocyte growth factor/Met tyrosine kinase (29, 30). Once a cancer cell enters the bloodstream or implants in a more oxygenated organ such as the lungs, the oxygen tension to which the cell is exposed changes. Thus, hypoxia represents an interesting and potentially physiologically significant context in which to study reversibility of EMT. Previous investigators have shown that EMT is reversible by silencing expression of Twist (22). In this study, we demonstrate that EMT may be reversed in cancer cells by reoxygenation or by targeting uPAR-activated cell signaling.
EXPERIMENTAL PROCEDURES
Reagents
Polyclonal human uPAR-specific antibody 399R was from American Diagnostica. Polyclonal antibody that detects vimentin was from Santa Cruz Biotechnology. Monoclonal antibody that recognizes E-cadherin (HECD-1) was from Abcam. Monoclonal antibody that recognizes tubulin was from Sigma-Aldrich. Horseradish peroxidase-conjugated antibodies specific for mouse and rabbit IgG were from GE Healthcare. Secondary antibodies conjugated with Alexa fluor 488 or 569 were from Invitrogen. PI3K inhibitor (LY294002), Src family kinase (SFK) inhibitor (PP2), and MEK1 inhibitor (PD098059) were from EMD Bio-sciences. qPCR reagents, including primers and probes for human uPAR, human uPA, vimentin, and HPRT-1 were from Applied Biosystems.
Cell Culture
MDA-MB 468 cells (ATCC) were cultured in Dulbecco's modified Eagle's medium (DMEM) (Hyclone) supplemented with 10% fetal bovine serum (FBS), penicillin (100 units/ml), and streptomycin (100 μg/ml). MDA-MB 231 cells (ATCC) were cultured in Leibovitz-15 (l-15) medium (Hyclone) supplemented with 10% FBS, penicillin, and streptomycin. uPAR-overexpressing MDA-MB 468 cells and MDA-MB 468 cells transfected with the empty vector, pCDNA (EV cells), are previously described (21). These cells were maintained in the same Dulbecco's modified Eagle's medium, supplemented with hygromycin (500 μg/ml).
Real Time qPCR
Total RNA was isolated from cells in culture using the RNeasy kit (Qiagen). cDNA was synthesized using the iScript cDNA synthesis kit (BioRad). qPCR was performed using a System 7300 instrument (Applied Biosystems) and a one-step program: 95 °C, 10 min; 95 °C, 30 s; and 60 °C, 1 min for 40 cycles. HPRT-1 gene expression was measured as a normalizer. Results were analyzed by the relative quantity (ΔΔCt) method. Experiments were performed in triplicate with internal duplicate determinations.
Immunoblot Analysis
Cell extracts were prepared in radioimmune precipitation assay buffer (20 mm sodium phosphate, 150 mm NaCl, pH 7.4, 1% Nonidet P-40, 0.1% SDS, 0.5% sodium deoxycholate) containing complete protease inhibitor mixture (Roche Applied Science) and 1 mm sodium orthovanadate. Protein concentrations were determined by bicinchoninic acid assay (Sigma-Aldrich). Equal amounts of cell extract were subjected to SDS-PAGE, electrotransferred to nitrocellulose membranes, and probed with primary antibodies.
Cell Migration and Invasion Assays
Migration of cells was studied using 6.5-mm Transwell chambers with 8-μm pores (Costar). The Transwell membranes were precoated with purified vitronectin (1 μg/ml) on the underside only. Cells (105 in 100 μl) were added to the upper chamber of each Transwell unit. The lower chamber was supplemented with 10% FBS to create a chemotactic gradient. Cells were allowed to migrate in 21% or 1% O2 for 24 h at 37 °C. Some cells were cultured in 1% O2 for 48 h, transferred to 21% O2 for 24 h or 48 h, and then allowed to migrate in 21% O2.
To study cell invasion, Biocoat Inserts containing reconstituted, growth factor-reduced Matrigel (BD Biosciences) were used. The cells were added above the Matrigel matrix. FBS was added to the lower chamber as described for the cell migration experiments. Matrigel invasion was allowed to progress for 24 h in 21% or 1% O2. Some cells were incubated in 1% O2 for 48 h and then transferred to 21% O2 for 24 h, before addition to Matrigel-containing chambers. At the end of each experiment, membranes were stained with Diff-Quik (Dade-Behring). Cells that migrated through the Matrigel to the lower surface of each membrane were counted by light microscopy.
Immunofluorescence Microscopy
MDA-MB 468 cells were plated on glass coverslips and fixed in 4% formaldehyde. Fixed cells were permeabilized in 0.2% Triton X-100 and incubated with antibodies specific for E-cadherin or vimentin for 18 h, followed by secondary antibodies conjugated with Alexa fluor 488 or Alexa fluor 594 for 30 min. Preparations were mounted on slides using Pro-long Gold with DAPI (Invitrogen) and examined using a Leica DMIRE2 fluorescence microscope. Images were obtained using a ×63 oil-immersion objective and a Hamamatsu digital camera with SimplePCI software.
siRNA Transfection
Human uPA-specific double-stranded siRNA was designed using the siRNA Selection Program developed by the Whitehead Institute of Biomedical Research (31). The chosen sequence (cauguuacugaccagcaac) fits the pattern, aa(N19)tt, and corresponds to nucleotides 1645–1664 of the human uPA coding region. All candidate siRNA sequences were subjected to a Blast search to optimize specific silencing. Duplex siRNA was synthesized by Dharmacon (Lafayette, CO). siCONTROL non-targeting control (NTC) siRNA pool also was from Dharmacon. siRNA transfection was accomplished by incubation with Lipofectamine (Invitrogen) in serum-free medium. Human uPA mRNA expression was determined by real time qPCR after introduction of uPA-specific siRNA or NTC siRNA.
Chick Chorioallantoic Membrane (CAM) Assays
Dissemination of green fluorescent protein (GFP)-expressing MDA-MB 468 cells from chick CAMs to the heart and lungs was studied as previously described (21). Before inoculating cells on the CAMs, MDA-MB 468 cells were cultured in 21% or 1% O2 for 48 h. The cells then were suspended at 4 °C in Matrigel (4 × 10⁷ cells/ml). 9-day-old eggs were used. A window was cut in the shell above the dropped CAM, and a 1.0-cm2 sterile cotton gauze with a 4-mm2 center cutout was placed on the membrane. 2 × 10⁶ MDA-MB 468 cells were inoculated onto the CAM through the center of the gauze. 11 days later, necropsies were performed. The heart-lung blocks were isolated. The number of foci of fluorescent cells/cell clusters was determined by fluorescence stereomicroscopy at ×20.
RESULTS
Reoxygenation of Hypoxic Breast Cancer Cells Decreases uPAR Expression and Reverses EMT
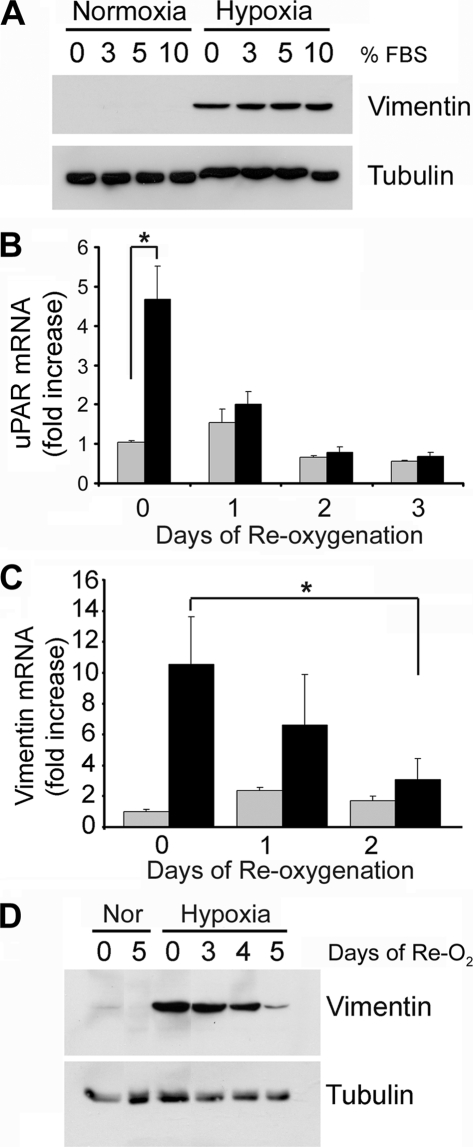
Hypoxia induces EMT in MDA-MB 468 breast cancer cells by a pathway that requires increased expression of uPAR and activation of uPAR-initiated cell signaling (21). These cells demonstrate increased vimentin expression, loss of E-cadherin from the plasma membrane, and localization of Snail to the nucleus. Fig. 1A shows that MDA-MB 468 cells undergo EMT when exposed to 1% O2 for 48 h, irrespective of the FBS concentration, as determined by vimentin protein expression.
FIGURE 1.
Reoxygenation of MDA-MB 468 breast cancer cells decreases hypoxia-induced expression of uPAR and vimentin. A, MDA-MB 468 cells were cultured in 21% O2 (Normoxia) or 1% O2 (Hypoxia) for 48 h in medium that contained various concentrations of FBS. Cell extracts were subjected to immunoblot analysis to detect vimentin and tubulin as a loading control. B, MDA-MB 468 cells were cultured in 21% O2 (gray bars) or 1% O2 (black bars) for 24 h (0 days) and then reoxygenated in 21% O2 for the number of days indicated. uPAR mRNA was determined by qPCR and standardized against the level present in cells cultured in 21% O2 for 24 h (mean ± S.E.; n = 4, *, p < 0.05). C, vimentin mRNA was assessed using the protocol described for uPAR mRNA in B. D, MDA-MB 468 cells were cultured in 21% O2 for 48 h (Nor) or 1% O2 for 48 h (Hypoxia). All of the cells were then transferred to 21% O2 for the indicated number of days (days of Re-O2). Cell extracts were subjected to immunoblot analysis to detect vimentin and tubulin as a loading control.
To test whether hypoxia-induced EMT is reversible, first, we examined uPAR mRNA expression. MDA-MB 468 cells that were cultured for 24 h in 1% O2 demonstrated a 4.7-fold increase in uPAR mRNA compared with cells that were maintained in 21% O2 (Fig. 1B), confirming our earlier observation (21). The increase in uPAR mRNA was statistically significant (p < 0.01, n = 5). When cells were cultured for 24 h in 1% O2 and then transferred back into normoxic conditions (21% O2), uPAR mRNA expression decreased. At 24–72 h, the uPAR mRNA level was not significantly different than that detected in cells that were maintained in 21% O2 through-out the study. Minor variation in the uPAR mRNA level, observed in cells that were maintained in 21% O2, probably reflects changes in culture confluency.
Culturing MDA-MB 468 cell in 1% O2 for 24 h increased vimentin mRNA expression 10-fold (Fig. 1C). When the cells were transferred back to 21% O2, the vimentin mRNA level decreased. By day 2 following reoxygenation, the decrease in vimentin mRNA was statistically significant (p < 0.05). Vimentin protein levels also increased dramatically in 1% O2 and decreased with reoxygenation, as determined by immunoblot analysis (Fig. 1D). Loss of vimentin protein in 21% O2 was gradual, suggesting slow turnover of this intermediate filament protein.
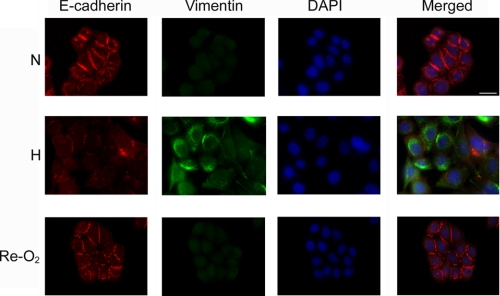
The decrease in vimentin expression that accompanied reoxygenation suggested that EMT was reversed. To further test this hypothesis, we conducted immunofluorescence microscopy studies, assessing expression and subcellular localization of E-cadherin and vimentin. In MDA-MB 468 cells that were maintained under normoxic cell culture conditions (N), E-cadherin was readily detected at cell-cell junctions (Fig. 2). Vimentin was not detected, confirming the results of our immunoblot analyses. In cells that were exposed to 1% O2 for 48 h (H), cell-cell junctions were lost, and E-cadherin localization in plasma membranes was rare. Vimentin was readily detected. When cells were cultured for 48 h in 1% O2 and then returned to 21% O2 for 48 h (Re-O2), signs of EMT reversed. The cells reclustered, forming junctions that were equivalent to those observed in cells that had never been exposed to hypoxia. E-cadherin became prominent at cell-cell junctions. Vimentin immunoreactivity appeared decreased in some cells, as shown in the figure; however this result was variable, as might be anticipated given the slow decrease in total vimentin protein, which occurs following reoxygenation (see Fig. 1D). Overall, these results demonstrate that EMT, which is induced in MDA-MB 468 cancer cells by hypoxia, is reversible.
FIGURE 2.
Reoxygenation reverses EMT. MDA-MB 468 cells were cultured in 21% O2 (N) or 1% O2 (H) for 48 h. Some cells were cultured in 1% O2 for 48 h and then exposed to 21% O2 for an additional 48 h (Re-O2). The cells were immunostained to detect E-cadherin (red channel), vimentin (green channel), and DAPI (blue channel). Bar, 15 μm.
Reoxygenation Inhibits Cancer Cell Migration and Invasion
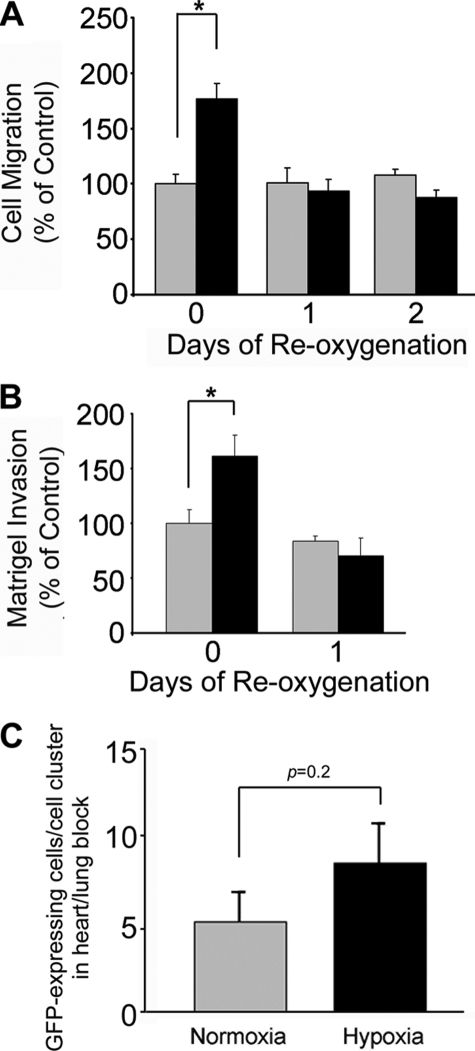
Exposure of MDA-MB 468 cells to hypoxia promotes cell migration and invasion (21). Although these changes are the result of uPAR-dependent cell signaling, they may or may not be a direct consequence of EMT, because the protocol for performing cell migration and invasion experiments requires dissociation of cultures into single cell suspensions. To test whether hypoxia-induced cell migration and invasion are reversed by reoxygenation, MDA-MB 468 cells were cultured in 1% O2 for 48 h and then returned to 21% O2 for 1 or 2 days. As shown in Fig. 3A, cells that were cultured in 1% O2 demonstrated significantly increased migration (p < 0.05). However, cells that were cultured first in 1% O2 for 48 h and then in 21% O2 for 1 or 2 days failed to migrate at a significantly increased rate compared with cells that were maintained in 21% O2 throughout the study.
FIGURE 3.
Reoxygenation inhibits migration and invasion of MDA-MB 468 cells. Cells were cultured in 21% O2 (gray bars) or 1% O2 (black bars) for 48 h. All of the cells were then cultured in 21% O2 for the indicated number of days. Cell migration is shown in A. Invasion through Matrigel is shown in B. Migration and invasion are compared with the level observed when we studied cells cultured in 21% O2 for 24 h. C, cells were cultured in 21% O2 (gray bars) or 1% O2 (black bars) for 48 h and then inoculated on 9-day-old CAMs. Tumors were allowed to develop for 11 days. Chick embryos were harvested. The number of GFP-expressing cells/cell clusters in the heart-lung block was determined by fluorescence stereomicroscopy (mean ± S.E.; n = 12).
Similar results were obtained in Matrigel invasion assays (Fig. 3B). Invasion was significantly increased (p < 0.05) when cells were cultured in 1% O2 for 48 h and then allowed to invade Matrigel in 1% O2. However, when the cells were returned to 21% O2 for 24 h and then allowed to invade Matrigel in 21% O2, the extent of invasion was not significantly different from that observed with cells that were maintained in 21% O2 throughout the study. In control experiments, we demonstrated that differences in cell survival did not contribute to the cell migration or invasion results (results not shown), which was anticipated because the cells were maintained in 10% FBS.
We previously demonstrated that when MDA-MB 468 cells are inoculated onto chick CAMs and treated on the CAMs with the hypoxia mimetic, CoCl2, dissemination of tumor cells to the heart and lungs is significantly increased (21). In new experiments, we pre-exposed MDA-MB 468 cells to 1% O2 and then inoculated these cells on the CAMs. Control cells were not pre-exposed to hypoxia (n = 12 in each cohort). CoCl2 was not added. Intrinsic to this protocol is reoxygenation, which occurs when the cells are inoculated on CAMs. Fig. 3C shows that cells, which were pre-exposed to hypoxia, showed a slight trend toward increased dissemination from the CAMs to heart-lung blocks; however, the observed change was not statistically significant. We interpret these results as further evidence that hypoxia-induced EMT is reversible. We conclude that reoxygenated MDA-MB 468 breast cancer cells lose their enhanced ability to migrate, invade, and disseminate to distant organs.
Inhibition of uPAR-activated Cell Signaling Reverses EMT
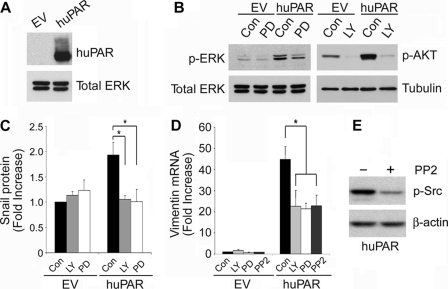
uPAR overexpression is sufficient to induce EMT in MDA-MB 468 cells, even when the cells are maintained in 21% O2. The changes observed in uPAR-overexpressing MDA-MB 468 cells are equivalent to those observed when wild-type MDA-MB 468 cells are cultured in 1% O2 (21). We studied uPAR-overexpressing MDA-MB 468 cells as our first model system to test whether uPAR-induced EMT may be reversed by targeting cell signaling pathways downstream of uPAR. Fig. 4A shows that the level of uPAR protein was substantially increased in uPAR-overexpressing MDA-MB 468 cells, compared with control cells, transfected with empty vector (EV). The EV cells also expressed uPAR; however, longer exposure times were necessary to observe the uPAR band (results not shown).
FIGURE 4.
Inhibition of uPAR-induced cell signaling reverses the effects of uPAR on expression of Snail and vimentin. A, cell extracts from control (EV) and uPAR-overexpressing (huPAR) MDA-MB 468 cells were subjected to immunoblot analysis to detect uPAR and total ERK as a loading control. B, control (EV) and uPAR-overexpressing (huPAR) MDA-MB 468 cells were treated with the PI3K inhibitor, LY294002 (LY, 10 μm), the MEK1 inhibitor, PD098059 (PD, 50 μm), or vehicle (Con) for 24 h. Cell extracts were subjected to immunoblot analysis to detect phosphorylated Akt (p-AKT), phosphorylated ERK1/2 (p-ERK), and tubulin or total ERK as loading controls. C, uPAR-overexpressing (huPAR) and control (EV) MDA-MB 468 cells were cultured in the presence of LY294002 or PD098059 for 24 h. Cell extracts were subjected to immunoblot analysis to detect Snail and tubulin as a loading control. Immunoblots were analyzed by densitometry (mean ± S.E., n = 3, *, p < 0.05). D, cells were treated with the indicated inhibitors for 24 h. Vimentin mRNA was determined by qPCR and standardized against the level present in EV cells treated with vehicle (mean ± S.E.; n = 3, *, p < 0.05). E, uPAR-overexpressing MDA-MB 468 cells were treated with PP2 (1 μm) or with vehicle for 24 h. Phosphorylated SFK was determined by immunoblot analysis. β-actin was determined as a loading control.
When cultured in serum-free medium, uPAR-overexpressing MDA-MB 468 cells demonstrated increased levels of activated ERK1/2 and Akt compared with control EV cells (Fig. 4B). This was an anticipated result because autocrine uPAR-dependent cell signaling, triggered by endogenously produced uPA, effectively regulates these pathways (24, 25, 32, 33). PD098059 (50 μm) substantially but incompletely inhibited activation of ERK1/2 in the uPAR-overexpressing cells. The PI3K inhibitor, LY294002 (10 μm), almost completely blocked activation of Akt. To test whether these pharmacologic inhibitors regulate the phenotype of uPAR-overexpressing MDA-MB 468 cells, first we measured Snail protein by immunoblot analysis and densitometry. Fig. 4C shows that Snail was significantly increased in uPAR-overexpressing cells (p < 0.05, n = 3). PD098059 and LY294002 independently reduced the level Snail to that observed in control cells.
Vimentin mRNA was increased 45-fold in uPAR-overexpressing MDA-MB 468 cells (Fig. 4D). LY294002 and PD098059 independently decreased the level of vimentin mRNA by about 50% in 24 h. The SFK inhibitor, PP2 (1 μm), had a similar effect. The extent of the decrease in vimentin mRNA observed with each cell signaling inhibitor was similar to that observed when MDA-MB 468 cells were transferred from 1% O2 to 21% O2 for 24 h. Fig. 4E confirms that PP2 decreased the level of activated SFK in uPAR-overexpressing MDA-MB 468 cells. Our results examining expression of Snail protein and vimentin mRNA suggested that targeting PI3K, ERK1/2, or SFKs may reverse EMT. We chose not to study drug combinations or longer incubation times to avoid problems with cell viability. Instead, we further tested our hypothesis regarding reversal of EMT by performing immunofluorescence microscopy studies.
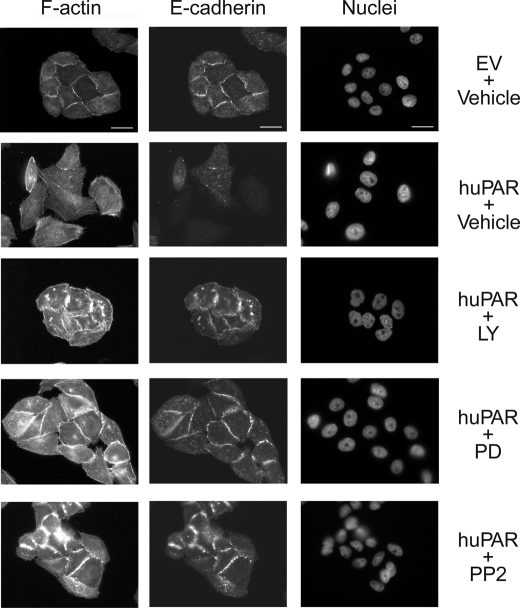
First, we examined E-cadherin expression. Fig. 5 shows that uPAR-overexpressing MDA-MB 468 cells demonstrated loss of cell-cell junctions, which were clearly evident in the control EV cell preparations. E-cadherin localized prominently to cell-cell junctions in EV cells but was largely lost in uPAR-overexpressing cells. Exposure of uPAR-overexpressing cells to LY294002, PD098059, or PP2 for 24 h led to the reformation of cell-cell junctions and localization of E-cadherin to these junctions. These results confirm that targeting cell signaling pathways activated downstream of uPAR in uPAR-overexpressing cells reverses EMT.
FIGURE 5.
Inhibition of uPAR-induced cell signaling restores cell surface-associated E-cadherin in uPAR-overexpressing cells. Control (EV) and uPAR-overexpressing (huPAR) MDA-MB 468 cells were treated with LY294002 (10 μm), PD098059 (50 μm), PP2 (1 μm), or vehicle for 24 h. Cells were immunostained to detect E-cadherin. The same cells were stained with phalloidin to detect F-actin and with DAPI to mark nuclei. Drug-treated cells grew in clusters with well defined cell junctions. E-cadherin localized to these junctions. Bars, 15 μm.
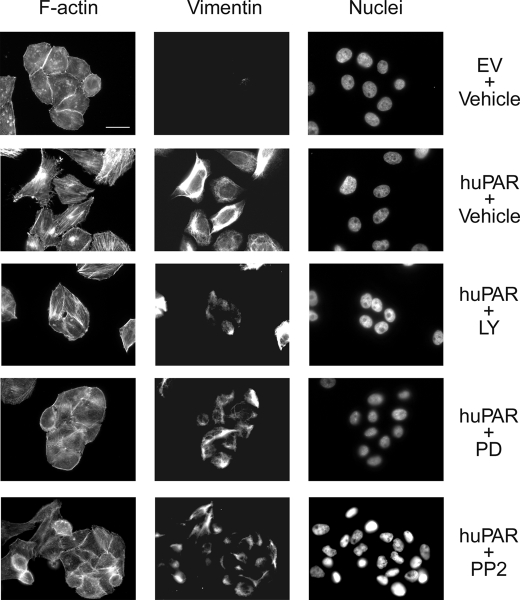
We also examined vimentin immunofluorescence (Fig. 6). uPAR-overexpressing MDA-MB 468 cells that were treated with the pharmacologic inhibitors for 24 h demonstrated residual vimentin immunoreactivity, which was detected even in cells that formed clusters, suggesting that residual vimentin does not obstruct reversal of EMT.
FIGURE 6.
Vimentin immunofluorescence in uPAR-overexpressing cells treated with inhibitors of uPAR-initiated cell signaling. Control (EV) and uPAR-overexpressing (huPAR) MDA-MB 468 cells were treated with LY294002 (10 μm), PD098059 (50 μm), PP2 (1 μm), or vehicle for 24 h. Cells were immunostained to detect vimentin. The same cells were stained with phalloidin to detect F-actin and with DAPI to mark nuclei. Bars, 15 μm.
uPA Gene Silencing Reverses EMT in uPAR-overexpressing MDA-MB 468
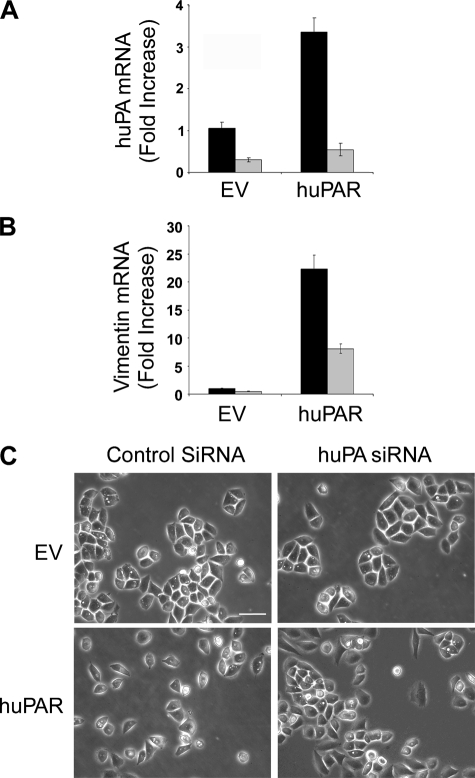
uPA binding to uPAR is necessary for uPAR-dependent activation of PI3K and ERK1/2 (24, 25, 32, 33). We hypothesized that endogenous production of uPA by uPAR-overexpressing MDA-MB 468 cells may be necessary to sustain EMT. To test this hypothesis, we transfected uPAR-overexpressing and control MDA-MB 468 cells with uPA-specific siRNA. Control cultures were transfected with NTC siRNA. uPA mRNA expression was measured 48 h later. As shown in Fig. 7A, uPAR-overexpressing cells that were transfected with NTC siRNA demonstrated increased levels of uPA mRNA compared with control EV cells. This result probably reflects activation of ERK1/2, which stimulates uPA expression in a positive feedback loop (33).
FIGURE 7.
uPA gene silencing reverses EMT in uPAR-overexpressing MDA-MB 468 cells. Control (EV) and uPAR-overexpressing (huPAR) MDA-MB 468 cells were transfected with NTC (black bar) or uPA-specific (gray bar) siRNA (100 μm). uPA mRNA (A) and vimentin mRNA (B) were determined by qPCR and standardized against the levels present in EV cells transfected with NTC siRNA (mean ± S.E.; n = 3). C, cell images were captured using phase contrast microscopy. Bars, 50 μm.
uPA-specific siRNA decreased uPA mRNA expression by greater than 70% in control MDA-MB 468 cells and by greater than 80% in uPAR-overexpressing cells. uPA-specific siRNA also decreased vimentin mRNA expression by greater than 60% in uPAR-overexpressing cells (p < 0.05), suggesting that uPA gene silencing may reverse EMT (Fig. 7B). To further test this hypothesis, we examined cells by phase contrast microscopy. As shown in Fig. 7C, uPAR-overexpressing MDA-MB 468 cells demonstrated rare cell-cell junctions, unlike control cells, which grew in clusters with prominent junctions. uPA gene silencing eliminated the difference in phenotype. Without sufficient endogenously produced uPA, uPAR-overexpressing cells grew in clusters with well defined junctions.
uPA Gene Silencing Reverses EMT in MDA-MB 231 Cells
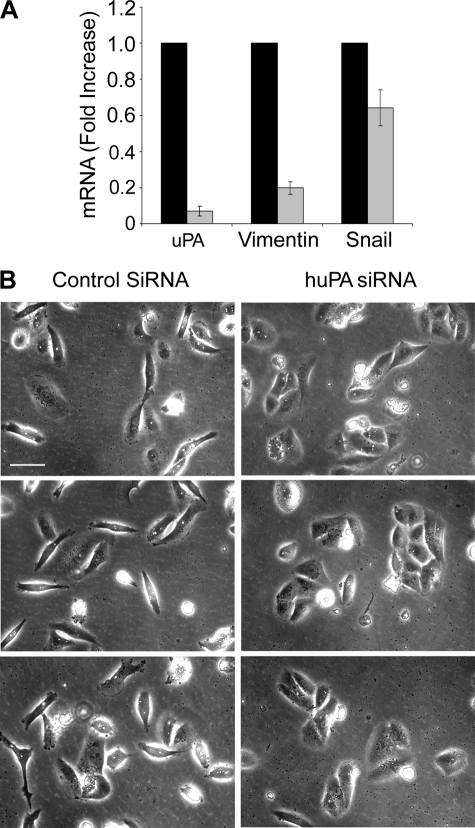
MDA-MB 231 cells are aggressive breast cancer cells that express high levels of uPA and uPAR and in which autocrine uPAR-dependent cell signaling promotes cell survival (33). MDA-MB 231 cells demonstrate mesenchymal cell morphology and, unlike MDA-MB 468 cells, this is not dependent on transfection for uPAR overexpression (21). We studied MDA-MB 231 cells as a second model system to test the role of uPA in maintaining mesenchymal cell phenotype. When MDA-MB 231 cells were transfected with uPA-specific siRNA, uPA mRNA expression was decreased by greater than 90% within 96 h (Fig. 8A). Vimentin mRNA expression was decreased by about 80%, and Snail mRNA was decreased by about 40% (p < 0.05).
FIGURE 8.
uPA gene silencing reverses EMT in MDA-MB 231 cells. A, MDA-MB 231 cells were transfected with NTC (black bar) or uPA-specific (gray bar) siRNA (100 μm). mRNA levels for uPA, vimentin, and Snail were determined by qPCR and standardized against the levels present in cells treated with NTC siRNA (mean ± S.E., n = 3). B, cell images were captured using phase contrast microscopy. Bars, 50 μm.
By phase contrast microscopy, MDA-MB 231 cells that were transfected with NTC siRNA appeared equivalent to untransfected MDA-MB 231 cells. Both populations demonstrated mesenchymal cell morphology and almost no cell-cell junctions (Fig. 8B). In cells that were transfected with uPA-specific siRNA, changes in cell morphology were observed. The cells grew in clusters with well defined junctions. Some clusters contained as many as 10–15 cells. Although these clusters were slightly smaller than those observed when EMT was reversed in MDA-MB 468 cells, the changes in MDA-MB 231 cell morphology, coupled with changes in expression of vimentin and Snail, suggest that uPAR-dependent cell signaling is required for the maintenance of EMT in MDA-MB 231 cells under conventional cell culture conditions.
DISCUSSION
In tumors, hypoxia typically develops when cancer cells are separated from blood vessels by more than 180 μm. Chronic hypoxia causes cell death and tumor necrosis; however, some hypoxic cancer cells activate prosurvival cell signaling pathways, which coincidentally also promote cell migration and invasion (34). Many but not all changes in cellular transcription, observed in hypoxia, reflect increased levels of HIF-1α, which translocates to the nucleus and, after heterodimerization with HIF-1β, binds to hypoxia response elements in gene promoters (35). Increased levels of HIF-1α are associated with a poor prognosis in human malignancies, including cancer of the colon, breast, kidney, and prostate (36, 37).
Several receptor systems have emerged as mediators of the proinvasion/metastasis phenotype that may be associated with hypoxia. Met tyrosine kinase is expressed at increased levels in hypoxia in various carcinoma cell lines and in breast epithelial cells and hepatocytes. Cell signaling through Met promotes invasion of osteosarcoma cells (30). In MCF-7 breast cancer cells, hypoxia activates the erythropoietin receptor, which activates ERK1/2 and promotes cell migration (29). In MDA-MB 468 cells, ZR-75-1 breast cancer cells, and SCC squamous cell carcinoma cells, hypoxia induces expression of uPAR and this event is associated with increased cell migration, invasion, and EMT (21). Some cancer cells demonstrate increased uPAR expression in hypoxia, but do not undergo EMT. Still others, such as MDA-MB 231 cells, express increased levels of uPAR in hypoxia, but already demonstrate mesenchymal cell morphology under normoxic conditions. The results presented in this study suggest that in cell culture, induction of EMT by uPAR requires that the cancer cells not only express high levels of uPAR but also uPA, so that the uPAR is ligated and uPAR-dependent cell signaling is activated. The situation may be different in vivo, because tumor cell uPAR may bind uPA produced by nonmalignant cells in the tumor microenvironment (38, 39). If this pathway is operational, then activation of uPAR-dependent EMT may represent a novel mechanism by which the tumor cell microenvironment affects cancer progression.
Although cancer cell EMT is thought to promote epithelial cancer metastasis, this issue is still debated (40, 41). Aberrant expression of genes involved in EMT promote tumor development and metastasis (13, 42). In human breast cancer, Snail expression is correlated with tumor grade (43). Loss of E-cadherin also is frequently observed in human cancer (3–5). Nevertheless, a role for EMT in cancer metastasis has been contested by the argument that tumor cells at foci of metastasis frequently show well differentiated epithelial cell morphology (40). This raises the question of whether cancer cell EMT is reversible, for which there is already evidence because EMT is reversed by Twist gene silencing (22). The results presented here show that hypoxia-induced EMT may be reversed by reoxygenation, providing a model for changes that may occur in vivo when cancer cells intravasate into the bloodstream or metastasize to the lungs. EMT also may be reversed by targeting uPAR-dependent cell signaling or by eliminating uPA from the cellular microenvironment. If nonmalignant cells in a primary tumor promote EMT by delivering uPA to the tumor cells, then tumor cells that implant in the lungs or elsewhere may lose their source of uPA.
By binding uPA and/or vitronectin and by transactivating other receptors, such as the epidermal growth factor receptor, uPAR activates a network of interconnected cell signaling pathways that regulate cell proliferation, survival, and migration (26, 44–46). The results presented here suggest that induction and maintenance of EMT, in cells that express high levels of uPAR, depends on simultaneous activation of numerous cell signaling factors downstream of uPAR. Our results support a model in which targeting any one of a number of cell signaling factors, including but not limited to SFKs, PI3K, or ERK1/2, may be sufficient to block the effects of uPA and uPAR so that EMT is reversed. In MDA-MB 231 cells, which express high levels of uPAR, loss of endogenously expressed uPA reveals epithelial cell properties that have not been observed before in this cell line. We have previously shown that uPA gene silencing in MDA-MB 231 cells decreases cell survival (33). This result reflects inhibition of uPAR-dependent cell signaling. Thus, EMT may represent one of multiple cancer cell properties controlled by uPAR, which impact on cancer progression.
The ability of PD098059 to reverse uPAR-induced EMT in uPAR-overexpressing MDA-MB 468 cells was not anticipated because, in our previous study (21), inhibiting ERK1/2 activation did not block the increase in MDA-MB 468 cell migration and invasion observed under hypoxic conditions. Importantly, migration and invasion assays are performed using Transwell/Boyden chambers. Cells are added to the top chamber after disrupting cell-cell junctions and forming single cell suspensions. In doing so, some of the important differences between epithelial and mesenchymal cells may be lost. Although EMT is classically defined as a multiple step process in which cells undergo changes in morphology and then demonstrate increased migration and invasion (2), inhibiting activation of ERK1/2 may dissociate the early steps of EMT (changes in morphology) from the later steps (increased migration and invasion as determined in Transwell assays).
uPAR may not independently induce EMT in many cancer cells. Instead, other receptors, such as receptor-tyrosine kinases and integrins, may work in concert with uPAR by activating an overlapping continuum of cell signaling pathways that control E-cadherin activity and EMT (21). It is quite possible that in some cancer cells, uPAR and other factors that support EMT may be induced simultaneously by hypoxia, downstream of HIF-1α. The activity of uPAR probably reflects not only the level of uPAR expression but also the availability of uPA in the cellular microenvironment. Understanding the relationship between uPAR and other factors induced by HIF-1α that may support EMT is a goal for future studies.
This work was supported, in whole or in part, by National Institutes of Health Grant CA-94900 from the NCI.
- EMT
- epithelial-mesenchymal transition
- uPAR
- urokinase receptor
- uPA
- urokinase-type plasminogen activator
- PI3K
- phosphatidylinositol 3-kinase
- ERK1/2
- extracellular signal-regulated kinase
- CAM
- chick chorioallantoic membrane
- GFP
- green fluorescent protein
- HIF-1α
- hypoxia inducible factor-1α
- FBS
- fetal bovine serum
- DAPI
- 4′,6-diamidino-2-phenylindole.
REFERENCES
- 1.Yang J., Weinberg R. A. (2008) Dev. Cell 14,818–829 [DOI] [PubMed] [Google Scholar]
- 2.Thiery J. P. (2002) Nat. Rev. Cancer 2,442–454 [DOI] [PubMed] [Google Scholar]
- 3.Berx G., Cleton-Jansen A. M., Nollet F., de Leeuw W. J., van de Vijver M., Cornelisse C., van Roy F. (1995) EMBO J. 14,6107–6115 [DOI] [PMC free article] [PubMed] [Google Scholar]
- 4.Graff J. R., Herman J. G., Lapidus R. G., Chopra H., Xu R., Jarrard D. F., Isaacs W. B., Pitha P. M., Davidson N. E., Baylin S. B. (1995) Cancer Res. 55,5195–5199 [PubMed] [Google Scholar]
- 5.Oda T., Kanai Y., Oyama T., Yoshiura K., Shimoyama Y., Birchmeier W., Sugimura T., Hirohashi S. (1994) Proc. Natl. Acad. Sci. U.S.A. 91,1858–1862 [DOI] [PMC free article] [PubMed] [Google Scholar]
- 6.Batlle E., Sancho E., Franci C., Domínguez D., Monfar M., Baulida J., García De, Herreros A. (2000) Nat. Cell Biol. 2,84–89 [DOI] [PubMed] [Google Scholar]
- 7.Cano A., Pérez-Moreno M. A., Rodrigo I., Locascio A., Blanco M. J., del Barrio M. G., Portillo F., Nieto M. A. (2000) Nat. Cell Biol. 2,76–83 [DOI] [PubMed] [Google Scholar]
- 8.Hajra K. M., Chen D. Y., Fearon E. R. (2002) Cancer Res. 62,1613–1618 [PubMed] [Google Scholar]
- 9.Yang J., Mani S. A., Donaher J. L., Ramaswamy S., Itzykson R. A., Come C., Savagner P., Gitelman I., Richardson A., Weinberg R. A. (2004) Cell 117,927–939 [DOI] [PubMed] [Google Scholar]
- 10.Bukholm I. K., Nesland J. M., Børresen-Dale A. L. (2000) J. Pathol. 190,15–19 [DOI] [PubMed] [Google Scholar]
- 11.Bukholm I. K., Nesland J. M., Kåresen R., Jacobsen U., Børresen-Dale A. L. (1998) J. Pathol. 185,262–266 [DOI] [PubMed] [Google Scholar]
- 12.Frixen U. H., Behrens J., Sachs M., Eberle G., Voss B., Warda A., Löchner D., Birchmeier W. (1991) J. Cell Biol. 113,173–185 [DOI] [PMC free article] [PubMed] [Google Scholar]
- 13.Perl A. K., Wilgenbus P., Dahl U., Semb H., Christofori G. (1998) Nature 392,190–193 [DOI] [PubMed] [Google Scholar]
- 14.Larue L., Bellacosa A. (2005) Oncogene 24,7443–7454 [DOI] [PubMed] [Google Scholar]
- 15.Bachelder R. E., Yoon S. O., Franci C., de Herreros A. G., Mercurio A. M. (2005) J. Cell Biol. 168,29–33 [DOI] [PMC free article] [PubMed] [Google Scholar]
- 16.Zhou B. P., Deng J., Xia W., Xu J., Li Y. M., Gunduz M., Hung M. C. (2004) Nat. Cell Biol. 6,931–940 [DOI] [PubMed] [Google Scholar]
- 17.Yook J. I., Li X. Y., Ota I., Hu C., Kim H. S., Kim N. H., Cha S. Y., Ryu J. K., Choi Y. J., Kim J., Fearon E. R., Weiss S. J. (2006) Nat. Cell Biol. 8,1398–1406 [DOI] [PubMed] [Google Scholar]
- 18.Barberà M. J., Puig I., Domínguez D., Julien-Grille S., Guaita-Esteruelas S., Peiró S., Baulida J., Francí C., Dedhar S., Larue L., García de, Herreros A. (2004) Oncogene 23,7345–7354 [DOI] [PubMed] [Google Scholar]
- 19.Radisky D. C., Levy D. D., Littlepage L. E., Liu H., Nelson C. M., Fata J. E., Leake D., Godden E. L., Albertson D. G., Nieto M. A., Werb Z., Bissell M. J. (2005) Nature 436,123–127 [DOI] [PMC free article] [PubMed] [Google Scholar]
- 20.Fujita Y., Krause G., Scheffner M., Zechner D., Leddy H. E., Behrens J., Sommer T., Birchmeier W. (2002) Nat. Cell Biol. 4,222–231 [DOI] [PubMed] [Google Scholar]
- 21.Lester R. D., Jo M., Montel V., Takimoto S., Gonias S. L. (2007) J. Cell Biol. 178,425–436 [DOI] [PMC free article] [PubMed] [Google Scholar]
- 22.Yang M. H., Wu M. Z., Chiou S. H., Chen P. M., Chang S. Y., Liu C. J., Teng S. C., Wu K. J. (2008) Nat. Cell Biol. 10,295–305 [DOI] [PubMed] [Google Scholar]
- 23.Sahlgren C., Gustafsson M. V., Jin S., Poellinger L., Lendahl U. (2008) Proc. Natl. Acad. Sci. U.S.A. 105,6392–6397 [DOI] [PMC free article] [PubMed] [Google Scholar]
- 24.Chandrasekar N., Mohanam S., Gujrati M., Olivero W. C., Dinh D. H., Rao J. S. (2003) Oncogene 22,392–400 [DOI] [PubMed] [Google Scholar]
- 25.Nguyen D. H., Hussaini I. M., Gonias S. L. (1998) J. Biol. Chem. 273,8502–8507 [DOI] [PubMed] [Google Scholar]
- 26.Jo M., Thomas K. S., O'Donnell D. M., Gonias S. L. (2003) J. Biol. Chem. 278,1642–1646 [DOI] [PubMed] [Google Scholar]
- 27.Kjøller L., Hall A. (2001) J. Cell Biol. 152,1145–1157 [DOI] [PMC free article] [PubMed] [Google Scholar]
- 28.Ma Z., Thomas K. S., Webb D. J., Moravec R., Salicioni A. M., Mars W. M., Gonias S. L. (2002) J. Cell Biol. 159,1061–1070 [DOI] [PMC free article] [PubMed] [Google Scholar]
- 29.Lester R. D., Jo M., Campana W. M., Gonias S. L. (2005) J. Biol. Chem. 280,39273–39277 [DOI] [PubMed] [Google Scholar]
- 30.Pennacchietti S., Michieli P., Galluzzo M., Mazzone M., Giordano S., Comoglio P. M. (2003) Cancer Cell 3,347–361 [DOI] [PubMed] [Google Scholar]
- 31.Yuan B., Latek R., Hossbach M., Tuschl T., Lewitter F. (2004) Nucleic Acids Res. 32,W130–134 [DOI] [PMC free article] [PubMed] [Google Scholar]
- 32.Gondi C. S., Kandhukuri N., Dinh D. H., Gujrati M., Rao J. S. (2007) Int. J. Oncol. 31,19–27 [PMC free article] [PubMed] [Google Scholar]
- 33.Ma Z., Webb D. J., Jo M., Gonias S. L. (2001) J. Cell Sci. 114,3387–3396 [DOI] [PubMed] [Google Scholar]
- 34.Harris A. L. (2002) Nat. Rev. Cancer 2,38–47 [DOI] [PubMed] [Google Scholar]
- 35.Wang G. L., Jiang B. H., Rue E. A., Semenza G. L. (1995) Proc. Natl. Acad. Sci. U.S.A. 92,5510–5514 [DOI] [PMC free article] [PubMed] [Google Scholar]
- 36.Talks K. L., Turley H., Gatter K. C., Maxwell P. H., Pugh C. W., Ratcliffe P. J., Harris A. L. (2000) Am. J. Pathol. 157,411–421 [DOI] [PMC free article] [PubMed] [Google Scholar]
- 37.Zhong H., De Marzo A. M., Laughner E., Lim M., Hilton D. A., Zagzag D., Buechler P., Isaacs W. B., Semenza G. L., Simons J. W. (1999) Cancer Res. 59,5830–5835 [PubMed] [Google Scholar]
- 38.Jo M., Takimoto S., Montel V., Gonias S. L. (2009) Am J Pathol. 175,190–200 [DOI] [PMC free article] [PubMed] [Google Scholar]
- 39.Pyke C., Kristensen P., Ralfkiaer E., Grøndahl-Hansen J., Eriksen J., Blasi F., Danø K. (1991) Am. J. Pathol. 138,1059–1067 [PMC free article] [PubMed] [Google Scholar]
- 40.Tarin D., Thompson E. W., Newgreen D. F. (2005) Cancer Res. 65,5996–6000; discussion 6000-1 [DOI] [PubMed] [Google Scholar]
- 41.Thompson E. W., Newgreen D. F., Tarin D. (2005) Cancer Res. 65,5991–5995 [DOI] [PubMed] [Google Scholar]
- 42.Barrallo-Gimeno A., Nieto M. A. (2005) Development 132,3151–3161 [DOI] [PubMed] [Google Scholar]
- 43.Blanco M. J., Moreno-Bueno G., Sarrio D., Locascio A., Cano A., Palacios J., Nieto M. A. (2002) Oncogene 21,3241–3246 [DOI] [PubMed] [Google Scholar]
- 44.Blasi F., Carmeliet P. (2002) Nat. Rev. Mol. Cell Biol. 3,932–943 [DOI] [PubMed] [Google Scholar]
- 45.Jo M., Thomas K. S., Marozkina N., Amin T. J., Silva C. M., Parsons S. J., Gonias S. L. (2005) J. Biol. Chem. 280,17449–17457 [DOI] [PubMed] [Google Scholar]
- 46.Ossowski L., Aguirre-Ghiso J. A. (2000) Curr. Opin Cell Biol. 12,613–620 [DOI] [PubMed] [Google Scholar]


