

Abstract
Mammalian glutamate dehydrogenase (GDH) is a homohexameric enzyme that catalyzes the reversible oxidative deamination of l-glutamate to 2-oxoglutarate using NAD(P)+ as coenzyme. Unlike its counterparts from other animal kingdoms, mammalian GDH is regulated by a host of ligands. The recently discovered hyperinsulinism/hyperammonemia disorder showed that the loss of allosteric inhibition of GDH by GTP causes excessive secretion of insulin. Subsequent studies demonstrated that wild-type and hyperinsulinemia/hyperammonemia forms of GDH are inhibited by the green tea polyphenols, epigallocatechin gallate and epicatechin gallate. This was followed by high throughput studies that identified more stable inhibitors, including hexachlorophene, GW5074, and bithionol. Shown here are the structures of GDH complexed with these three compounds. Hexachlorophene forms a ring around the internal cavity in GDH through aromatic stacking interactions between the drug and GDH as well as between the drug molecules themselves. In contrast, GW5074 and bithionol both bind as pairs of stacked compounds at hexameric 2-fold axes between the dimers of subunits. The internal core of GDH contracts when the catalytic cleft closes during enzymatic turnover. None of the drugs cause conformational changes in the contact residues, but all bind to key interfaces involved in this contraction process. Therefore, it seems likely that the drugs inhibit enzymatic turnover by inhibiting this transition. Indeed, this expansion/contraction process may play a major role in the inter-subunit communication and allosteric regulation observed in GDH.
Glutamate dehydrogenase (GDH)2 is found in all living organisms and catalyzes the reversible oxidative deamination of l-glutamate to 2-oxoglutarate using NAD(P)+ as coenzyme (1). In eukaryotic organisms, GDH resides within the inner mitochondrial matrix where it catabolizes glutamate to feed 2-oxoglutarate to the Krebs cycle. Although there is some debate as to the directionality of the reaction, the high Km for ammonium in the reductive amination reaction seems to prohibit the reverse reaction under normal conditions in most organisms (2). GDH from animals, but not other kingdoms (3), is allosterically regulated by a wide array of ligands (3–9). GTP (9–11), and with ∼100-fold lower affinity, ATP (3), is a potent inhibitor of the reaction and acts by increasing the binding affinity for the product, thereby slowing down enzymatic turnover (11). Hydrophobic compounds such as palmitoyl-CoA (12), steroid hormones (13), and steroid hormone analogs such as diethylstilbestrol (5) are also potent inhibitors. ADP is an activator of GDH (3, 6, 10, 11, 14) that acts in an opposite manner to GTP by facilitating product release. Leucine is a poor substrate for GDH but is also an allosteric activator for the enzyme (8). Its activation is akin to ADP but acts at site distinct from ADP (15).
The crystal structures of the bacterial (16–18) and animal forms (19, 20) of GDH have shown that the general architecture and the locations of the catalytically important residues have remained unchanged throughout evolution. The structure of GDH (Fig. 1) is essentially two trimers of subunits stacked directly on top of each other with each subunit being composed of at least three domains (19–22). The bottom domain makes extensive contacts with a subunit from the other trimer. Resting on top of this domain is the “NAD binding domain” that has the conserved nucleotide binding motif. Animal GDH has a long protrusion, “antenna,” rising above the NAD binding domain that is not found in bacteria, plants, fungi, and the vast majority of protists. The antenna from each subunit lies immediately behind the adjacent, counterclockwise neighbor within the trimer. Because these intertwined antennae are only found in the forms of GDH that are allosterically regulated by numerous ligands, it is reasonable to speculate that it plays a role in regulation.
FIGURE 1.

Conformational transitions and locations of ligand binding sites in bovine glutamate dehydrogenase. A, a ribbon diagram of apo-bovine glutamate dehydrogenase with each of the identical subunits represented by different colors. The subunit arrangement is that of a trimer of dimers where anti-parallel β-strands form extensive interactions between the subunits stacked on top of each other. This pairing is represented by different shades of the same color. The conformational changes that during substrate binding are shown by the numbered arrows. As substrate binds, the NAD+ binding domain closes (1). The ascending helix of the antenna moves toward the pivot helix of the adjacent subunit (2). The short helix of the descending strand of the antenna becomes extended and distorted at the carboxyl end (3). Finally, the internal cavity of the helix compresses, bringing the three pairs closer together (4). B shows the structure of ADP (green spheres) bound to the apo-form of GDH and the location of Arg-463 (mauve spheres) that is involved in ADP activation (22). C shows the location of the inhibitor, GTP (mauve spheres), bound to the NADH (gray spheres), and glutamate (orange spheres) abortive complex. The green arrow notes the approximate location of one of the two sites (Lys-420) modified by 5′-FSBA (48). Comparing B and C, the closing of the catalytic cleft and the movement of the pivot helix is evident.
From the structures GDH alone and complexed with various ligands, it is clear that GDH undergoes large conformational changes during each catalytic cycle (19–22) (the locations of these changes are summarized in Fig. 1). Substrate binds to the deep recesses of the cleft between the coenzyme binding domain and the lower domain. Coenzyme binds along the coenzyme binding domain surface of the cleft. Upon binding, the coenzyme binding domain rotates by ∼18° to firmly close down upon the substrate and coenzyme (Fig. 1, arrow 1). As the catalytic cleft closes, the base of each of the long ascending helices in the antenna appears to rotate out in a counterclockwise manner to push against the “pivot” helix of the adjacent subunit (Fig. 1, arrow 2). There is a short helix in the descending loop of the antenna that becomes distended and shorter as the mouth closes in a manner akin to an extending spring (Fig. 1, arrow 3). The pivot helix rotates in a counterclockwise manner along the helical axes as well as rotating counterclockwise around the trimer 3-fold axis. Finally, the entire hexamer seems to compress as the mouth closes (Fig. 1, arrow 4). The three pairs of subunits that sit on top of each other move as a rigid units toward each other, compressing the cavity at the core of the hexamer. This last conformational change will be further examined in this work. Allosteric regulation is likely exacted by controlling some or all of these conformational changes.
The reason for complex animal regulation came from studies that linked GDH regulation with insulin and ammonia homeostasis. The connection between GDH and insulin regulation was initially established using a non-metabolizable analog of leucine (7, 23), BCH (β-2-aminobicycle[2.2.1]-heptane-2-carboxylic acid). These studies demonstrated that activation of GDH was tightly correlated with increased glutaminolysis and release of insulin. In addition, it has also been noted that factors that regulate GDH also affect insulin secretion (24). The in vivo importance of GDH in glucose homeostasis was demonstrated by the discovery that a genetic hypoglycemic disorder, the hyperinsulinemia/hyperammonemia (HHS) syndrome, is caused by loss of GTP regulation of GDH (25–27). Children with HHS have increased β-cell responsiveness to leucine and susceptibility to hypoglycemia following high protein meals (28). This is likely due to uncontrolled catabolism of amino acids yielding high ATP levels that stimulate insulin secretion as well as high serum ammonium levels. During glucose-stimulated insulin secretion in normal individuals, it has been proposed that the generation of high energy phosphates inhibits GDH and promotes conversion of glutamate to glutamine, which, alone or combined, might amplify the release of insulin (29, 30). Further support for this contention came from studies on the inhibitory effects of the polyphenolic compounds from green tea on BCH-stimulated insulin secretion (31). This not only lent support for the contention that GDH plays a significant role in insulin homeostasis, but also suggests that the HHS disorder might be directly controlled pharmaceutically. The role of GDH in insulin homeostasis is summarized in Fig. 2.
FIGURE 2.

Link between GDH and insulin homeostasis. This figure shows the role of GDH in BCH stimulated insulin secretion and how GDH inhibitors affect this process (29, 30). In energy-depleted β-cells, a BCH ramp stimulates insulin secretion. Here, the major energy source is glutaminolysis via phosphate-dependent glutaminase and GDH, because the concentration of GDH inhibitors (ATP/GTP) have been depleted and the phosphate-dependent glutaminase activator Pi (inorganic phosphate) has been increased. BCH stimulates glutamine utilization via GDH activation, thus providing the ATP signal necessary for insulin secretion. GDH inhibitors block this process by inhibiting GDH activity.
To both find a more stable pharmaceutical agent to control HHS and to better understand the allosteric regulation of GDH, a high throughput screen was performed to identify new GDH inhibitors (32). Of the ∼30,000 compounds tested, ∼20 demonstrated significant activity. Three of the most active compounds, hexachlorophene, GW5074, and bithionol, were chosen for further analysis in this study. As shown here, all three compounds exhibit essentially non-competitive inhibition of the reaction and therefore do not compete with either substrate or coenzyme. Structural studies are presented here that demonstrate that six hexachlorophene (HCP) molecules bind to the inner core of the GDH hexamer, forming an internal ring via aromatic interactions. In contrast, bithionol and GW5074 bind as pairs between dimers of GDH subunits further away from the core of the enzyme. None of these compounds induce significant conformational changes in their immediate vicinity, and the mechanism of action is not clear from the location of their binding sites. However, detailed analysis of the various GDH complexes shows all of the drugs are binding to contact areas in the core of the hexamer that appear to be expanding and contracting during catalytic turnover. Therefore, inhibition is likely due interference with this “breathing” process.
EXPERIMENTAL PROCEDURES
Steady-state Analysis of the Effects of GW5074 and Bithionol on the Oxidative Deamination Reaction
Prior to kinetic analysis, aliquots of bovine GDH (Sigma) were extensively dialyzed against 0.1 m sodium phosphate buffer, pH 7.0, that contained 1 mm EDTA. The enzyme concentration was adjusted to 1 mg/ml, and the amount of enzyme added to the reaction mixture was adjusted to yield optimal steady-state velocities. All solutions were made immediately prior to use. Enzyme assays were performed by monitoring reduced coenzyme production at 340 nm using a Beckman Coulter DU800 spectrophotometer. For all of the kinetic assays, each reaction was done in triplicate in 0.1 m sodium phosphate buffer, pH 7.5. When glutamate was varied, the concentration of NAD+ was 0.2 mm. When NAD+ was varied, a concentration of 50 mm glutamate was used. To measure the ED50 values of the various drugs, 50 mm glutamate and 0.2 mm NAD+ were used in the reaction.
When the concentration of glutamate is varied, there is strong substrate inhibition at high glutamate concentrations (6). For non-linear regression analysis of this data, a modified version of the Monod equation was used (33) (Equation 1),
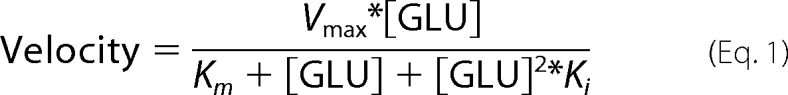 |
Here Vmax is the apparent maximum velocity in the absence of substrate inhibition, Km is the apparent Michaelis constant for glutamate, and Ki is the apparent substrate inhibition coefficient. These data were directly fitted to this equation using the non-linear regression algorithms in the program Prism 4. When the concentration of NAD+ is varied, the data were analyzed using Lineweaver-Burke plots and linear regression analysis using Prism 4.
Steady-state Analysis of the Effects of GW5074, Bithionol, and HCP on GDH from Various Sources
When increasing concentrations of drug were added to the reaction, a number of the compounds did not obey a simple mass action equation and therefore a modified Hill equation (34) was applied,
 |
where the Vi is the maximum inhibition caused by the drug (%), IC50 is the concentration of drug that causes half-maximal inhibition of the reaction, and h is the Hill coefficient. Data were fitted using the non-linear regression routines in the program Prism 4 (GraphPad Software, Inc.). Bovine GDH was purchased from Sigma, Escherichia coli GDH was purchased from Megazyme Corp. (Wicklow, Ireland), and tetrahymena GDH was isolated as described under “Experimental Procedures.” All samples of GDH were checked for homogeneity using SDS-PAGE analysis.
Crystallization of the Drug Complexes
Co-crystallization of GDH with HCP and GW5074 was performed using the hanging drop, vapor-diffusion method at room temperature. In both cases, the drops were formed using a 1:1 mix of protein and reservoir solutions. For GW5074, the reservoir solution contained 0.1 m sodium phosphate (pH 7.0), 0.5 m 1,6-hexanediol, 0.5 m sodium chloride, and 7–8% (w/v) polyethylene glycol 8000. The protein stock solution contained 4 mg/ml GDH, 2 mm NADPH, 2 mm GTP, 20 mm sodium glutamate, and 0.5 mm GW5074. For HCP, the crystallization solution contained 0.1 m sodium phosphate (pH 7.0), 0.15–0.2 m sodium chloride, and 11–13% (w/v) polyethylene glycol 8000. Protein stock solution contained 4 mg/ml GDH, 2 mm NADPH, 2 mm GTP, 20 mm sodium glutamate, and 0.5 mm HCP.
Soaking of Drugs into GDH Crystals
GDH/drug crystals were also prepared by soaking crystals in solutions of the various compounds. GDH/abortive complex crystals were made using the sitting drop method at room temperature. The reservoir solution contained 0.1 m sodium phosphate (pH 7.0), 18% (v/v) methyl pentanediol, 0.2 m sodium chloride, and 7% polyethylene glycol 8000. 5 μl of this solution was added to 10 μl of the drop solution that contained 4 mg/ml GDH, 3 mm NADPH, 3 mm GTP, 30 mm glutamate. The abortive crystals were then soaked in a synthetic mother liquor solution saturated with the various inhibitors (GW5074, bithionol, and HCP) overnight. The synthetic solution contained 18% polyethylene glycol 8000, 0.15 m NaCl, 5% methylpentandiol, 0.1 m sodium phosphate, 50 mm monosodium glutamate, and 2 mm NADPH.
Data Collection and Structure Determination
All complex crystals were transferred stepwise into synthetic cryoprotectant mother liquor solutions containing saturating concentrations of drugs and successively higher concentrations of glycerol (3–20%). The synthetic cryoprotectant mother liquor contained 0.1 m sodium phosphate (pH 7.0), 5% (v/v) methylpentandiol, 0.15 m sodium chloride, and 18% (w/v) polyethylene glycol 8000, 2 mm NADPH, and 60 mm monosodium glutamate.
Data sets were collected at the Advanced Photon Source beamline 19ID and processed with the HKL2000 program suite (35). The abortive complex (GDH + GTP + NADPH + glutamate) structure of 1HYZ was used as initial model for molecular replacement with program CNS (36), the program COOT (37) was used for model building, and all inhibitor topologies were produced using the program PRODRG (38). The initial locations and positions of the drugs were identified as peaks in difference maps (Fo − Fc) with maximum values of at least ∼5σ. For refinement using CNS, 6-fold non-crystallographic (NCS) restraints were applied to four sections of the protein: 10–208, 209–392, 393–444, and 445–489. These segments correspond to the glutamate binding domain, the NAD binding domain, the antenna, and the pivot helix, respectively. These restraints greatly improved the geometry of the model and yielded superior results compared with using the entire subunit as a single segment for NCS restraints. For the drug molecules, 6-fold NCS restraints were applied to bithionol and GW5074 as separate segments. In the case of HCP, there were six molecules bound to the inner core of the GDH hexamer, but they interacted with the hexameric 2-fold interfaces in a manner that obeyed 3-fold but not 6-fold symmetry. Therefore, 3-fold NCS restraints were applied to pairs of HCP molecules for their refinement. Final refinement statistics are shown in Table 2.
TABLE 2.
Refinement statistics of the drug complexes
The numbers in parentheses denote the values in the highest resolution shells.
| HCP (co-crystallized) | Bithionol (soak) | GW5074 (co-crystallized) | |
|---|---|---|---|
| PDB accession | 3ETE | 3ETD | 3ETE |
| Wavelength (Å) | 0.97929 | 0.97929 | 0.97929 |
| Space group | P21 | P21 | P21 |
| Unit cell a, b, c (Å) | 123.4, 101.6, 166.9 | 122.4, 101.3, 166.6 | 122.3, 102.2, 167.7 |
| β (°) | 102.3 | 102.5 | 102.5 |
| Resolution range (Å) | 50–3.0 (3.11–3.0) | 50–2.5 (2.59–2.50) | 50–2.5 (2.59–2.50) |
| Unique reflections | 156,833 (80,660) | 264,220 (137,717) | 270,260 (138,957) |
| R(I)sym (%) | 6.2 (39.7) | 6.7 (37.4) | 7.6 (22.6) |
| Completeness (%) | 99.9 (100) | 99.3 (97.9) | 99.5 (99.3) |
| Redundancy | 3.7 (3.6) | 3.0 (2.7) | 3.7 (3.8) |
| I/σ(I) | 20.1 (3.0) | 15.1 (2.2) | 15.8 (5.8) |
| Refinement statistics | |||
| Rwork (%) | 24.0 (38.0) | 23.7 (32.0) | 24.4 (31.0) |
| Rfree (%) | 26.6 (39.0) | 25.5 (33.7) | 25.8 (33.9) |
| Reflections | 76,128 (10,235) | 130,359 (18,641) | 134,020 (19,907) |
| % Completeness | 94.0 (83.0) | 94.7 (86) | 95.9 (90.5) |
| Protein atoms | 23,203 | 23,490 | 23,491 |
| Solvent atoms | 218 | 88 | 155 |
| Ligand atoms | 534 | 534 | 534 |
| Drug atoms | 126 | 114 | 126 |
| Average B values (Å2) | |||
| Protein atoms | 92.8 | 63.8 | 51.3 |
| Solvent atoms | 75.0 | 44.0 | 40.9 |
| Ligand atoms | 113.2 | 90.7 | 61.6 |
| Drug atoms | 147.8 | 114 | 129.0 |
| Root mean square deviations | |||
| Bond length (Å) | 0.01 | 0.009 | 0.009 |
| Bond angles (°) | 2.0 | 2.1 | 2.2 |
| Ramachandran results (%) | |||
| Most favored | 86.1 | 87.6 | 86.8 |
| Additionally allowed | 13.1 | 10.5 | 11.2 |
| Generously allowed | 0.4 | 1.3 | 1.2 |
| Disallowed | 0.5 | 0.6 | 0.8 |
For density improvement, NCS real-space averaging was applied to the three drug complexes. For the GW5074 and bithionol complexes, phases were calculated in CNS (36) using the refined coordinates and combined with the observed structure factors using CCP4i (39). The mask included one of the six drug molecules, and real-space averaging was performed in CCP4i. The averaged map was then back-transformed, and the phases were applied to the observed structure factors for subsequent averaging. Each map was averaged six times, and the final correlation coefficients were ∼99% for each subunit. In the case of HCP, two molecules of the drug bind in different orientations to cross-dimers of GDH subunits (e.g. the deep red and light blue subunits in Fig. 1). Therefore a mask was made from one of these dimers and two drug molecules, and 3-fold averaging was applied to the map in the same manner as described above. The electron density for the drugs shown in Figs. 4, 6, and 7 are derived in this manner.
FIGURE 4.

The structure of HCP bound to the bovine GDH·NADP+·GLU·GTP complex. A, stereo ribbon diagram of bovine GDH with the subunits colored in a manner similar to Fig. 1. For clarity, the other bound ligands (GTP, NADPH, and glutamate) are not shown in the diagram. In the central core, each of the six HCP molecules is represented by different colored spheres. B, stereo view is of the central core region looking down from the top of the hexamer, through the 3-fold axis running through the antenna. The six copies of HCP are represented by ball-and-stick models, and their corresponding electron densities are shown at a contour level of 1σ.
FIGURE 6.

Electron density and binding environment of the bound bithionol. The view and coloring are the same as the top of Fig. 3, looking toward the core of the enzyme along one of the 2-fold axes and perpendicular to the 3-fold axis. A, a stereo image of the bithionol·GDH complex with the drug molecules represented by ball-and-stick models and contact residues are noted. B, a stereo view of the atomic surface of the binding site, colored according as per all of the other figures. Note that this cavity is visible from the exterior of the hexamer.
FIGURE 7.

Electron density and binding environment of the bound GW5074. A, stereo image with essentially the same view as used for bithionol in Fig. 5 with the electron density. B, the molecular surface of the binding cavity. This binding site is the same as bithionol.
Tetrahymena GDH Production
Tetrahymena was cultured in SSP media (2% peptone, 0.1% yeast extract, 0.2% glucose, and 0.003% sequestrene) containing 50 μg/ml ampicillin at room temperature for 2–3 days. The cells were harvested by centrifugation at 4K rpm in a Beckman JLA-9.100 rotor for 20 min. The cell pellets were resuspended in lysis buffer containing 0.02 m sodium phosphate, pH 7.0, 2 mm EDTA, and 1 mm phenylmethylsulfonyl fluoride, and 1% Triton X-100. The cells were lysed by sonication, and the cellular debris was removed by centrifugation. Ammonium sulfate was added to the supernatant to yield a final concentration of 25% saturation and centrifuged again as described above. The supernatant was again collected, and ammonium sulfate was added to yield an additional 55% saturation. After the precipitate was collected by centrifugation, the pellets were resuspended in 20 mm sodium phosphate, pH 7.0, containing 1 mm EDTA, and dialyzed against the same overnight at 4 °C. The dialyzed material was then centrifuged again to remove the precipitated material.
The enzyme was then purified using three chromatography steps. Reactive red 120-agarose beads were added to the centrifuged supernatant and placed on a shaker at 4 °C for approximately an hour to allow for adsorption of GDH to the affinity matrix (∼50 ml of packed beads per 4 liters of starting tetrahymena culture). The affinity matrix was then loaded onto a column and washed extensively with 20 mm sodium phosphate buffer, pH 7.0. GDH was then eluted with 0.8 m NaCl in 20 mm sodium phosphate buffer, pH 7.0, and the fractions containing GDH activity were pooled and the enzyme precipitated with an 80% saturated solution of ammonium sulfate (final concentration). The precipitated material was then collected by centrifugation, and the pellet was resuspended in 1–2 ml of 0.1 m sodium phosphate buffer, pH 7.0, and dialyzed overnight against the same buffer. 1–2 ml of the dialyzed sample was then applied to an XK-26/70 column (Amersham Biosciences) filled with S-300 HR resin (Amersham Biosciences) for size-exclusion chromatography and eluted with 0.02 m sodium phosphate buffer, pH 7.0. The active fractions were pooled and loaded directly onto an XK-16/20 column filled with DEAE-Fast Flow resin equilibrated with the same buffer. The protein was eluted from the column with linear NaCl gradient of 0 to 1 m over 150 ml. Only the most active fractions were collected, and the enzyme was stored in an 80% saturated solution of ammonium sulfate until needed for further studies. SDS-PAGE analysis was used to confirm the purity of the sample.
RESULTS
Kinetic Analysis of GW5074 and Bithionol Inhibition
Previous steady-state analysis of HCP inhibition of GDH activity (32) demonstrated that this compound exhibited essentially non-competitive inhibition of GDH activity; it greatly diminished the Vmax for the reaction while not having a large effect on the Km. Steady-state analysis of the oxidative deamination reaction is complicated by the fact that GDH exhibits negative cooperativity with respect to coenzyme, as made apparent by breaks in the Lineweaver-Burk plots (Fig. 3), and substrate inhibition when glutamate is varied. Previous studies demonstrated also that HCP also did not affect these phenomena (32).
FIGURE 3.

Steady-state kinetic analysis of bovine GDH inhibition by these compounds. Shown at the top are the chemical structures of the three compounds used in these structural studies and previously identified in high throughput screens (32). The effects of hexachlorophene (HCP) on the oxidative deamination reaction has already been demonstrated (32). Shown in A and C are the steady-state velocities at varied glutamate and bithionol (Bith) or GW5074 concentrations. The marked downward trend in the curve at concentrations above 16 mm glutamate is due to substrate inhibition, and therefore the data were analyzed using the modified Monod equation (Equation 1) and summarized in Table 1. Shown in B and D are the Lineweaver-Burk plots of the oxidative deamination reaction at varying NAD+ and drug concentrations. Here, there is a marked break from the expected linearity at ∼0.1 mm NAD+ due to negative cooperativity (40). The Vmax and Km were estimated from the data at high NAD+ concentrations and summarized in Table 1.
These drugs were identified through high throughput screens at extremely high coenzyme and substrate concentrations to prevent selection of their respective analogs, because such compounds would likely have undesirable impacts on multiple metabolic pathways (32). Nevertheless, because GW5074 is a kinase inhibitor, there was concern that perhaps it might interfere with coenzyme binding. Therefore, kinetic studies were performed on bithionol and GW5074 (Fig. 3 and Table 1). For this analysis, data from the NAD+-varied steady-state experiments were analyzed using Lineweaver-Burk plots, and the Km and Vmax were calculated using linear regression analysis of the velocity of the reaction at high coenzyme concentration. As is typical for GDH with coenzyme varied, there is a marked break at ∼0.1 mm NAD+ (40). Neither compound affects this deviation from Michaelis-Menten kinetics and therefore apparently does not affect the subunit communication associated with negative cooperativity, because the break occurs at the same concentration of coenzyme and is not affected by high concentrations of drug.
TABLE 1.
Steady-state kinetic analysis of the effects of bithionol and GW5074 on the oxidative deamination reaction
The NAD-varied data is derived from linear regression analysis of the Lineweaver-Burk plots, whereas the glutamate-varied data were fitted to Equation 1 using non-linear regression analysis, where Ki is not the apparent binding constant for the drug but rather the concentration of glutamate necessary to yield half-maximal substrate inhibition under these conditions.
| Effects of drugs on the kinetic parameters for NAD+ | ||||
|---|---|---|---|---|
| [Bithionol] | 0 μm | 3 μm | 5 μm | 9 μm |
| Km (mm) | 0.31 (0.02) mm | 0.43 (0.06) mm | 0.36 (0.03) mm | 0.26 (0.02) mm |
| Vmax | 0.24 (0.005) | 0.22 (0.01) | 0.13 (0.004) | 0.05 (0.01) |
| R2 | 0.99 | 0.98 | 0.99 | 0.97 |
| [GW5074] | 0 μm | 1.5 μm | 4 μm | 8 μm |
| Km (mm) | 0.31 (0.01)mm | 0.23 (0.004) mm | 0.26 (0.006) mm | 0.14 (0.012) mm |
| Vmax | 0.24 (0.006) | 0.13 (0.003) | 0.09 (0.003) | 0.04 (0.001) |
| R2 | 0.99 | 0.98 | 0.97 | 0.91 |
| Effects of drugs on the kinetic parameters for glutamate | ||||
|---|---|---|---|---|
| [Bithionol] | 0 μm | 3 μm | 5 μm | 9 μm |
| Km (mm) | 1.62 (0.12) mm | 1.17 (0.1) mm | 1.06 (0.12) mm | 0.39 (0.10) mm |
| Vmax | 0.18 (0.003) | 0.14 (0.003) | 0.10 (0.003) | 0.05 (0.001) |
| Ki (shared) | 241 (17) mm | 241 (17) mm | 241 (17) mm | 241 (17) mm |
| R2 | 0.98 | 0.99 | 0.97 | 0.95 |
| [GW5074] | 0 μm | 1.5 μm | 4 μm | 8 μm |
| Km (mm) | 1.38 (0.12) mm | 1.38 (0.10) mm | 1.53 (0.12) mm | 1.27 (0.10) mm |
| Vmax | 0.17 (0.003) | 0.13 (0.003) | 0.09 (0.003) | 0.05 (0.002) |
| Ki (shared) | 350 (17) mm | 350 (17) mm | 350 (17) mm | 350 (17) mm |
| R2 | 0.99 | 0.98 | 0.99 | 0.99 |
In the case of the glutamate varied experiments, the steady-state data were analyzed using non-linear regression analysis as previously described (32) to simulate the substrate inhibition caused by the abortive complex (GDH·NADH·Glu) formed at high glutamate concentrations (6). Neither compound had any affect on this phenomenon. From the analysis of the steady-state data (Table 1), both compounds act similarly to HCP and inhibit GDH in an apparently non-competitive manner with the Vmax being greatly affected without a very large change in Km. The one notable exception is the Km measurement at the highest concentration of bithionol. The Km and Vmax suddenly drop when the concentration of bithionol is increased from 5 to 9 μm and the R2 for the curve fitting is also significantly worse than the other experiments. Therefore, it is not clear whether this apparent change in Km for this last experiment is indeed significant. More importantly, this demonstrates that none of these inhibitors act by competing with either substrate or coenzyme, and the non-competitive nature of inhibition suggests that the drugs can bind to either the apo- or substrate-bound forms of the enzyme. This is particularly interesting, because GW5074 is a purine analog that inhibits cRaf1 kinases (41), and it would have been logical for it to compete with coenzyme binding.
The Structure of Hexachlorophene Bound to GDH
Several crystallographic datasets of GDH·HCP complex were obtained and analyzed (Table 2). Although it is possible to crystallize the GDH in the presence and absence of abortive complexes (e.g. NAD(P)H + GLU or NAD(P)+ + 2-oxoglutarate), crystals of apo-GDH are more fragile and diffract to lower resolution. Further, because the steady-state analysis of the inhibition did not show demonstrable competition with either substrate or coenzyme, HCP was soaked into crystals of the abortive complex (GDH + NADPH + GLU + GTP) or added during the crystallization of the complexes. Although the abortive complex crystals soaked in HCP tended to diffract to higher resolution, the density of the bound HCP appeared weaker than when the drug was added during the crystallization process. Therefore, whereas the results from the two different data sets are essentially the same, the following results are from data collected using crystals from the co-crystallization trials.
From the initial difference maps (using Fo − Fc and model phases), the bound HCP appeared as peaks >5σ in the inner core of the enzyme. To improve the quality of the drug density and to confirm its existence, the map was subjected to six cycles of 3-fold averaging as described under “Experimental Procedures.” Although the peak height of the density is high, some of the details are more diffuse than the protein residues surrounding the molecules. Because some of the interactions between the drug and the protein are not exactly symmetrical, the diffuse nature of the density may be due to alternative binding conformers or partial substitution. Indeed, this density is significantly stronger than when the drugs were soaked into the crystals overnight.
As shown in Figs. 4 and 5, six molecules of HCP form a ring in the inner cavity of the hexamer. However, these six drug molecules are not related by the 6-fold symmetry observed by the subunits but rather alternate between two different conformations around the ring (Fig. 5). The “A” conformer is relatively flat and tucks into a pocket at the interface between diagonal subunits (e.g. the light green and dark red subunits). The “B” conformer is more vertically oriented but also interacts with diagonal subunits (e.g. the dark blue and pink subunits). Essentially, the symmetrical HCP binds at the interface between 2-fold related subunits with one ring interacting with one subunit and the other ring interacting with the other. From the density and interactions with the protein, the exact placement of the two hydroxyl groups on the bound HCP is not clear; one ring might be rotated with respect to the other.
FIGURE 5.

The binding environment of HCP in the GDH core. A, ribbon and stick figure of the GDH·HCP complex with some of the contact residues highlighted. Note there are, in total, three molecules of HCP bound in conformation A and three in conformation B. The orientation is with the 3-fold axis running vertically through the middle of each panel. The color of the surfaces corresponds to the subunit colors used in Fig. 3. B, a stereo image using a similar view orientation and shows a stereo image of a surface rendering of the internal core of GDH with three of the six bound HCP molecules represented by ball-and-stick models.
The majority of the interactions between HCP and GDH are hydrophobic, but there is also an almost “chain link” of aromatic stacking interactions. The two rings of HCP in orientation A approximately stacks against two Tyr-190 side chains from diagonally adjacent subunits rather than the two subunits stacked on top of each other (Fig. 5). The interactions between the B orientation and GDH are also symmetrical with each HCP ring making the same hydrophobic interactions with the two diagonal subunits. The hydrophobic pocket for the B ligand is mainly composed of Met-150, Ile-187, Tyr-190 and the methylene side-chain atoms from Thr-186 and Lys-154. There are also approximate stacking interactions among the bound HCP molecules. As shown in Fig. 5, the top ring in orientation B interacts with the bottom ring of orientation A, and the top ring of orientation A then interacts with the bottom ring of a different molecule in orientation B. What is particularly interesting is that there is apparent positive cooperativity in HCP effects with increasing drug concentrations (see Table 4) (32). Perhaps the positive cooperativity is due to the formation of this “chain mail” ring either by increasing the affinity of the drug or by increasing its inhibitory effect.
TABLE 4.
Inhibitory effects of the three inhibitors on GDH from different sources
The data was fitted to the modified Hill equation (Equation 2) (34), and the standard errors of the various values are shown in parentheses.
| GDH source | Drug | IC50h | Hill coefficient |
|---|---|---|---|
| μm | |||
| Bovine | HCP | 3.9 (0.07) | 2.9 (0.14) |
| Bovine | GW5074 | 1.5 (0.10) | 0.98 (0.06) |
| Bovine | Bithionol | 4.8 (0.18) | 2.0 (0.18) |
| Tetrahymena | HCP | 1.9 (0.08) | 1.3 (0.06) |
| Tetrahymena | GW5074 | 2.6 (0.17) | 1.0 (0.07) |
| Tetrahymena | Bithionol | 5.9 (0.47) | 1.2 (0.14) |
| E. coli | HCP | 12 (1.6) | 1.4 (0.32) |
| E. coli | GW5074 | >100 | NDa |
| E. coli | Bithionol | 17 (2.9) | 1.5 (0.41) |
a ND, not determined.
Bithionol and GW5074 Complex Structures
Bithionol and GW5074 did not bind to the same site as HCP (Figs. 6 and 7). The electron densities of the drugs agree well with the structures of the compounds; bithionol has a marked kink between the two rings, while GW5074 has a planar structure. Although HCP binds to the inner core, these two drugs bind halfway between the core and the exterior of the hexamer. When the molecular surface of the hexamer is viewed from the exterior toward the core of the enzyme along one of the 2-fold axes, this common binding pocket is accessible to the exterior solved and easily observed (Fig. 8). This is in contrast to the binding geometry of HCP where the internal cavity is blocked off from the exterior solvent mainly by the antenna structure. Also unlike HCP, each of the six drug molecules are associated with separate subunits rather than one molecule contacting two symmetrical sites simultaneously. Instead, two drug molecules form pairs that are related by the hexameric 2-fold axes. The binding environments of the two drugs are nearly identical. Residues 138–155 of the glutamate binding domain form an α-helix that makes most of the contact between diagonal subunits and draw closer together when the catalytic cleft is closed (Figs. 1 and 9). These two drugs stack against each other and interact with hydrophobic residues and the aliphatic portions of the polar and charged side chains of residues Lys-143, Arg-146, Arg-147, and Met-150 (Figs. 6 and 7). These drugs, therefore, appear to directly bind to the area that compresses during mouth closure.
FIGURE 8.

Locations of the all of the bound ligands. The purpose of this figure is to elucidate the locations of all of the ligand binding sites on bovine GDH. A, a ribbon diagram showing the structures of bithionol (spheres with various colors), NADPH (gray spheres), glutamate (yellow spheres), GTP (black spheres) bound to GDH. The view is the same as in Fig. 5 and shows that the bithionol (and GW5074) molecules bind right around the 2-fold axes relating the pairs of GDH subunits. B, stereo figure showing a cutaway of the core region with the locations of bithionol and HCP denoted by the colored spheres. The view here is down the 3-fold axis with the three 2-fold axes lying in the plane of the figure and running between the bithionol pairs. Note that the HCP molecules cluster in the core of the enzyme, and bithionol and GW5074 bind more toward the exterior of the hexamer.
FIGURE 9.

Conformational differences between the open and closed forms of the enzyme. In this stereo diagram, the C-α backbones of the subunits in the closed form are colored in darker hues while the subunits of the aligned open form of the enzyme are colored in corresponding lighter hues. The glutamate binding domain of the red (closed form) subunit was aligned to that of the pink (open form) subunit. Because the stacked dimers of subunits act as rigid bodies, this also aligns the dark blue (closed form) subunit with the light blue (open form) subunit. This area is highlighted by the yellow square. The general location of the drugs is denoted by the yellow circle. The yellow arrows highlight the helices in the core region that are involved in drug binding and spread apart when the catalytic sites open.
There are some differences, however, in the interactions between GW5074 and bithionol and GDH (Figs. 6 and 7). The acidic brominated phenol group in GW5074 points toward Arg-147 while the planar heteroaromatic fused ring stacks against the planar guanidinium head group of Arg-146. The latter aromatic ring-guanidinium head group interaction is commonly observed in proteins (42). In the case of the halogenated, biphenolic compound, bithionol, one of the two aromatic rings is approximately planar to the guanidinium head group of Arg-146, but does not stack nearly to the degree as GW5074 (Fig. 7). As shown in this figure, the two hydroxyl groups of the acidic phenol rings point toward the head group of Arg-147 in a manner similar but not identical to that of GW5074. Nevertheless, it is interesting that both of these phenolic compounds bind within this cluster of lysine and arginine residues.
GDH Breathing
As suggested in Fig. 1, the core of GDH expands and contracts as the catalytic mouth opens and closes, respectively. The glutamate binding domains from one of the three-stacked pairs of subunits could be aligned between the open and closed forms, but the other two pairs aligned poorly (Fig. 9). As shown in this figure, when one of the glutamate binding domains is used to align the opened and closed forms of GDH, the subunit directly beneath also aligns well (see area within the yellow square). The stacked dimers effectively act like a single rigid body because of the extensive β-sheet interactions at the dimer interface. The general location of the drug is shown by the yellow circle and lies between two pairs of helices that form the dimer-dimer interface. As noted by the yellow arrows, these helices move apart when the catalytic cleft opens. This expansion of the hexamer is most obvious the further the distance from the central core.
To quantify this phenomenon and to ascertain what the effects of the drugs might be on this movement, the center of mass of the glutamate binding domains (residues 50–150) was calculated for each of the subunits in the various states (Table 3). There are four unique distances among the various subunits; six vectors between subunits within the trimers, three vectors representing the distance between the three pairs of stacked dimers, and two sets of three vectors between the subunits in one trimer and the subunits in the other trimer (Fig. 10 and Table 3).
TABLE 3.
Inter-subunit distances found in the various bovine GDH structures as defined in Fig. 7
The numbers in parentheses on the top line represent the number of unique vectors used for that particular distance measurement, and the rest of the parenthetical notations are the standard deviations of the various measurements.
| Structure | Intra-trimer (6) | Intra-dimer (3) | Cross #1 (3) | Cross #2 (3) |
|---|---|---|---|---|
| Distances (Å) | ||||
| Open | 44.42 (0.04) | 23.00 (0.08) | 52.95 (0.03) | 39.39 (0.01) |
| Closed | 43.09 (0.05) | 22.97 (0.06) | 51.61 (0.07) | 37.81 (0.04) |
| HCP (closed) | 43.36 (0.06) | 22.91 (0.04) | 51.84 (0.06) | 37.94 (0.04) |
| BIT (closed) | 43.95 (0.03) | 22.83 (0.08) | 52.34 (0.02) | 38.09 (0.06) |
| GW (closed) | 43.91 (0.04) | 22.80 (0.03) | 52.32 (0.05) | 38.18 (0.06) |
| % Change | ||||
| Closed | 3.00 (0.11) | 0.13 (0.26) | 2.53 (0.13) | 4.01 (0.10) |
| HCP (closed) | 2.39 (0.13) | 0.39 (0.17) | 2.10 (0.11) | 3.68 (0.10) |
| BIT (closed) | 1.06 (0.07) | 0.74 (0.35) | 1.15 (0.04) | 3.30 (0.15) |
| GW (closed) | 1.15 (0.09) | 0.87 (0.13) | 1.19 (0.09) | 3.07 (0.15) |
FIGURE 10.

Schematic of the various vectors between the six subunits of GDH. The coloring is the same as the other ribbon diagrams, and each subunit is represented by a sphere to emphasize the trimer of dimer configuration. There are four unique distances in the hexamer; between subunits within a trimer (intra-trimer), between subunits within a dimer (intra-dimer), and two cross vectors between each subunit and the two opposite subunits on the other trimer (cross-vectors 1 and 2). The distances from the various complexes are summarized in Table 3.
From this analysis, there is a clear pattern of movement during the opening and closing of the catalytic cleft. The distance between the stacked pairs of subunits (e.g. red and pink subunits of Fig. 10 or the blue and red subunits of Fig. 9) does not change significantly (∼0.1% change). However, the distance between the stacked dimers changes by 2.5–4%. This concurs with the kinds of changes shown in Fig. 9.
Although all of the drug complexes also contained NADPH, glutamate, and GTP, these internal distances are not exactly the same as the closed conformation. Interestingly, bithionol (soaked into the abortive complex crystals) and GW5074 (co-crystallized with GDH) bind to the same site, and the intersubunit distances are nearly identical to each other. Furthermore, although the intra-trimer distances were compressed by ∼3% in the presence of the abortive complex, these drugs appear to limit this compression to only ∼1%. It should be noted that structures of this abortive complex in the presence of metals and different buffers yield essentially the same result as the closed conformation in the absence of drugs (data not shown). Therefore these differences, although relatively small compared with open versus closed conformers in the absence of drug, do not seem to be just due to differences in solute. Although similar trends are observed with HCP, the distances are more similar to the closed conformation. The significance of the differences in these distances between the closed form in the presence and absence of drug is not clear. They may be “wedging” into these junction points and forcing the stacked dimers apart somewhat. Nevertheless, it is clear that all of the drugs are binding to regions key to the conformational transitions that occur during catalytic turnover.
Effects of the Drugs on GDH from Other Kingdoms
To ascertain the degree to which the drug binding sites are conserved among the various forms of GDH, inhibition studies were performed on GDH from bovine, tetrahymena, and E. coli sources (Fig. 11 and Table 4). The effects of the three drugs on tetrahymena GDH closely mirrored that of bovine GDH. Although the tetrahymena GDH was slightly more sensitive to HCP than bovine GDH, it was slightly less sensitive to GW5074 and bithionol. GDH from E. coli was significantly less sensitive to all three compounds. HCP had the greatest effect on GDH and inhibited the reaction by ∼50% at 15 μm. GW5074 was slightly less efficacious and inhibited by only ∼40% at 15 μm. Bithionol is the least effective, and inhibited the reaction at most by ∼10%, which is only slightly larger than the error of measurement. Because the amino acid sequences of animal and bacterial GDH share relatively low homology (19, 43), it is somewhat surprising that these compounds would have any affect on bacterial GDH.
FIGURE 11.

Effects of the drugs on GDH from other kingdoms. Shown here is the effect of varying concentrations of the three drugs on GDH from bovine (red lines), tetrahymena (green lines), and E. coli (blue lines). Curve fitting results are summarized in Table 4.
DISCUSSION
In our previous studies, the antenna was shown to be crucial to allosteric regulation of GDH by palmitoyl CoA, GTP, and ADP (43). We further proposed that this antenna evolved in the Ciliates, perhaps in response to changes in the organelle functions and then, through evolutionary exaptation (shift in the function of a trait during evolution), further refined to link amino acid catabolism with insulin homeostasis (43). We have further refined this model by suggesting that this functional evolution of GDH was made possible by the dynamic nature of the enzyme (44). GDH necessarily undergoes large domain movements to dehydrate the substrate and coenzyme to improve catalytic efficiency. The easiest way to regulate GDH, therefore, may be to control these dynamic processes. By resting behind the NAD binding domain and under the pivot helix, ADP likely activates the enzyme by decreasing the energy required to open the catalytic cleft. In contrast, GTP wedges into the gap between the NAD binding domain and the pivot helix, making it harder to open the catalytic cleft. The antenna twists and turns during the catalytic cycle and, because deletion of the antenna abrogates acetyl CoA inhibition, perhaps this regulator binds to and inhibits this second motion.
As shown in Figs. 9 and 10, the third type of conformational change is a 3–4% expansion of the entire hexamer when the catalytic mouth opens. The fact that there is only movement between, and not within, the stacked dimers seems to argue that the interface between the stacked dimers is a major flex point within the hexamer that the drugs themselves seem to be taking advantage of. None of these drugs cause any local conformational changes upon binding. They are far removed from the known allosteric sites and the active site and yet act as potent inhibitors. It seems highly unlikely that it is merely a coincidence that all of these compounds bind to the areas most involved in this expansion and contraction. It should be noted that GTP does much the same thing (21). It does not significantly alter the side chains of the contact residues but apparently prevents the opening and closing of the catalytic cleft.
GW5074 and bithionol wedge in between the two α-helices at the 2-fold axes (see yellow arrows in Fig. 9) while HCP forms a hydrophobic ring within the core of the hexamer. It seems logical that the binding of hydrophobic compounds to these areas affects the compression and/or the expansion of the hexamer. Although the numbers in Table 3 suggest that the drugs may be pushing the stacked dimers apart somewhat, it seems more likely that the drugs inhibit catalytic turnover by making the overall conformational transitions more difficult.
Although it seems rather unexpected that HCP is able to work its way into the heart of GDH, there are examples of this occurring from previous chemical modification studies. When GDH is modified with the photoreactive 5′-(p-(fluorosulfonyl)benzoyl)-8-azidoadenosine (5′-FSBAzA), the enzymatic activity is not appreciably affected. However, there is a significant loss in sensitivity to activation by ADP and allosteric inhibition by NADH and GTP. The Ki for GTP increases ∼4-fold upon modification with 5′-FSBAzA, whereas the Kd for ADP and Km for NADH are not affected (45). FSBAzA is a bifunctional reagent with a fluorosulfonyl group at one end and a photoreactive azidoadenosine moiety at the other. It was found that, in the dark, where only modification by the fluorosulfonyl group can occur, ∼0.5 mol of FSBAzA is incorporated per mole of enzyme. Subsequent photolysis causes cross-linking with ∼25% of the FSBAzA bound during the dark reaction (46). The dark reaction is blocked by high NADH concentrations and even better by the combination of NADH and GTP. The major site of modification by FSBAzA is Tyr-190 and a minor modification site is Lys-143 (46). Not surprisingly because they are similar compounds, these results are similar to when GDH is modified by 5′-FSBA (47, 48). Residues Lys-420 and Tyr-190 are modified by 5′-FSBA, and this modification also abrogates the inhibition caused by high NADH concentrations. Also similar to the effects of 5′-FSBAzA, the chemical modification is blocked by high concentrations of NADH and by the addition of NADH and GTP.
These chemical modification studies lend a great deal of insight to the results presented here. Both 5′-FSBA and 5′-FSBAzA react with Tyr-190. This residue approximately stacks against one of bound HCP conformations. This clearly demonstrates that these small compounds can work their way into the core of the GDH hexamer and, in fact, bind to the same residues as HCP. Further, it is very interesting to note that only half of the six subunits are modified by 5′-FSBAzA; consistent with only three HCP molecules stacking against the six Tyr-190 residues in the core of the hexamer. It seems likely that the rather large size of FSBAzA prohibits reaction with all six possible sites. It is important to note that Tyr-190 is not at all near the active site or the known allosteric regulatory binding sites and yet, upon modification, affects allosteric regulation. This lends credence to the idea that the breathing of the hexamer plays a significant role in not only catalysis but also allostery. This is further supported by the fact that high concentrations of NADH and NADH+GTP block modification of Tyr-190 by both of these compounds. From our previous studies (see Ref. 44 for a review) these ligands effectively close the catalytic mouth of GDH, leading to the compressed conformation of the hexamer. It therefore seems highly likely that these ligands protect against 5′-FSBA and 5′-FSBAzA modification by blocking the breathing necessary for penetration by these compounds, and conversely, once bound affects enzymatic activity and regulation. An even greater validation of the results presented here is the fact that 5′-FSBAzA, but not 5′-FSBA, also modifies Lys-143. It is the alkane portion of the Lys-143 side chain that contributes to the hydrophobic pocket to which bithionol and GW5074 bind. Therefore, 5′-FSBAzA exactly binds to both of the drug binding sites identified here, and both areas are protected against modification by the addition of ligands that promote closure of the catalytic cleft and compression of the hexamer. The fact that neither 5′-FSBA nor 5′-FSBAzA inhibit the enzyme like bithionol, HCP, or GW5074 suggests that GDH breathing is required for binding but that the compounds themselves are not binding in orientations necessary to prevent such conformational changes.
It is not clear why such similar compounds such as bithionol and HCP bind to different sites. Both HCP and bithionol are nearly insoluble in water with solubilities of ∼140 and ∼4 μg/ml, respectively. Perhaps the fact that 5′-FSBAzA binds to both the HCP and bithionol sites suggests that the two environments are nearly equivalent and that some slight difference between the two compounds is all that is necessary for the observed binding differences. For example, perhaps the binding site differences are not as important as the ability of the compounds to form the inter-drug stacking interactions observed between the bound HCP and bithionol molecules.
There appears to be an evolutionary conservation of the effect of these drugs on GDH activity. All three drugs inhibited tetrahymena GDH with GW5074 exhibiting the weakest effects. In the case of bacterial GDH (E. coli), all three drugs exhibited significantly weaker effects. Nevertheless, HCP was able to inhibit the E. coli enzyme by ∼50% at the highest concentrations tested while bithionol inhibited the reaction by ∼40% at the highest concentrations tested. The results with tetrahymena were not entirely surprising, because the residues in contact with the drugs are highly conserved between the tetrahymena and bovine forms of GDH (43). However, these same residues are not well conserved in the bacterial form (19). Nevertheless, the binding pockets for these compounds are found in bacterial GDH (e.g. Clostridium GDH (17)). There is a clear pocket that is accessible to the exterior solvent and is in a homologous location as the bithionol and GW5074 binding site. Because bacterial GDH does not have the antenna region, the entire inner core is exposed to solvent. Although a higher degree of inhibition would have been more convincing, the fact that HCP and GW5074 have any effect on the enzymatic activity suggests that the concerted conformational changes observed in mammalian GDH may have very ancient origins and are most certainly in play in the Ciliate form of the enzyme. It is also important to note that HCP and bithionol are known anthelmintic (expel or kill parasites) agents, but their mode of action is unclear. Given that both of these compounds inhibit GDH from such diverse sources, it seems possible that they, at least in part, act via GDH inhibition.
As we have recently proposed (44), the complex motions within GDH may have initially evolved to improve catalytic efficiency. The negative cooperativity and extensive subunit communication may have evolved to conserve and transfer the energy involved in substrate binding to one subunit to facilitate product release from adjacent subunits (49). As is clear in the case of these drugs and the naturally occurring allosteric regulators, this complex ballet of motion creates numerous sites by which ligands can bind and modulate catalytic activity. This has allowed allostery in GDH to gradually evolve in complexity to create new functions and roles rather than creating entirely new gene products to accommodate the changing needs of the cell (e.g. linkage between amino acid catabolism and insulin secretion). Although it seems that GDH regulation is overly complex for an enzyme involved in such a mundane chemical reaction, it is in fact remarkable that this allostery can adequately control a single enzyme that is apparently crucial to regulate central nervous system levels of glutamate, ureagenesis in the liver, and insulin secretion in the pancreas.
This work was supported, in whole or in part, by National Institutes of Health Grant DK072171 (to T. J. S.).

The on-line version of this article (available at http://www.jbc.org) contains supplemental Figs. S1–S11 and Tables S1–S3.
The atomic coordinates and structure factors (codes 3ETE, 3ETG and 3ETD) have been deposited in the Protein Data Bank, Research Collaboratory for Structural Bioinformatics, Rutgers University, New Brunswick, NJ (http://www.rcsb.org/).
- GDH
- glutamate dehydrogenase
- BCH
- β-2-aminobicycle[2.2.1]-heptane-2-carboxylic acid
- HCP
- hexachlorophene
- GW5074
- 3-(3,5-dibromo)-4-hydroxybenzylidine-5-iodo-1,3-dihydro-indol-2-one
- HHS
- hyperinsulinemia/hyperammonemia
- NCS
- non-crystallographic
- FSBAzA
- (p-(fluorosulfonyl)benzoyl)-8-azidoadenosine
- FSBA
- 5′-p-flurosulfonylbenzoyladenosine.
REFERENCES
- 1.Hudson R. C., Daniel R. M. (1993) Comp. Biochem. Physiol. B. 106,767–792 [DOI] [PubMed] [Google Scholar]
- 2.Smith E. L., Austen B. M., Blumenthal K. M., Nyc J. F. (1975) in The Enzymes ( Boyer P. D. ed) pp. 293–367, Academic Press, New York [Google Scholar]
- 3.Frieden C. (1965) J. Biol. Chem. 240,2028–2035 [PubMed] [Google Scholar]
- 4.Frieden C. (1959) J. Biol. Chem. 234,809–814 [PubMed] [Google Scholar]
- 5.Tomkins G. M., Yielding K. L., Curran J. F. (1962) J. Biol. Chem. 237,1704–1708 [PubMed] [Google Scholar]
- 6.Bailey J., Bell E. T., Bell J. E. (1982) J. Biol. Chem. 257,5579–5583 [PubMed] [Google Scholar]
- 7.Sener A., Malaisse W. J. (1980) Nature 288,187–189 [DOI] [PubMed] [Google Scholar]
- 8.Yielding K. L., Tomkins G. M. (1961) Proc. Natl. Acad. Sci. U.S.A. 47,983–989 [DOI] [PMC free article] [PubMed] [Google Scholar]
- 9.Dieter H., Koberstein R., Sund H. (1981) Eur. J. Biochem. 115,217–226 [PubMed] [Google Scholar]
- 10.Iwatsubo M., Pantaloni D. (1967) Bull. Soc. Chim. Biol. 49,1563–1572 [PubMed] [Google Scholar]
- 11.Koberstein R., Sund H. (1973) Eur. J. Biochem. 36,545–552 [DOI] [PubMed] [Google Scholar]
- 12.Fahien L. A., Kmiotek E. (1981) Arch. Biochem. Biophys. 212,247–253 [DOI] [PubMed] [Google Scholar]
- 13.Yielding K. L., Tomkins G. M., Munday J. S., Curran J. F. (1960) Biochem. Biophys. Res. Commun. 2,303–306 [Google Scholar]
- 14.Markau K., Schneider J., Sund H. (1972) FEBS Lett. 24,32–36 [DOI] [PubMed] [Google Scholar]
- 15.Prough R. A., Culver J. M., Fisher H. F. (1973) J. Biol. Chem. 248,8528–8533 [PubMed] [Google Scholar]
- 16.Baker P. J., Britton K. L., Engel P. C., Farrants G. W., Lilley K. S., Rice D. W., Stillman T. J. (1992) Proteins Struct. Funct. Genet. 12,75–86 [DOI] [PubMed] [Google Scholar]
- 17.Stillman T. J., Baker P. J., Britton K. L., Rice D. W. (1993) J. Mol. Biol. 234,1131–1139 [DOI] [PubMed] [Google Scholar]
- 18.Yip K. S., Stillman T. J., Britton K. L., Artymiuk P. J., Baker P. J., Sedelnikova S. E., Engel P. C., Pasquo A., Chiaraluce R., Consalvi V. (1995) Structure 3,1147–1158 [DOI] [PubMed] [Google Scholar]
- 19.Peterson P. E., Smith T. J. (1999) Structure 7,769–782 [DOI] [PubMed] [Google Scholar]
- 20.Smith T. J., Schmidt T., Fang J., Wu J., Siuzdak G., Stanley C. A. (2002) J. Mol. Biol. 318,765–777 [DOI] [PubMed] [Google Scholar]
- 21.Smith T. J., Peterson P. E., Schmidt T., Fang J., Stanley C. A. (2001) J. Mol. Biol. 307,707–720 [DOI] [PubMed] [Google Scholar]
- 22.Banerjee S., Schmidt T., Fang J., Stanley C. A., Smith T. J. (2003) Biochemistry 42,3446–3456 [DOI] [PubMed] [Google Scholar]
- 23.Sener A., Malaisse-Lagae F., Malaisse W. J. (1981) Proc. Natl. Acad. Sci. U.S.A. 78,5460–5464 [DOI] [PMC free article] [PubMed] [Google Scholar]
- 24.Fahien L. A., MacDonald M. J., Kmiotek E. H., Mertz R. J., Fahien C. M. (1988) J. Biol. Chem. 263,13610–13614 [PubMed] [Google Scholar]
- 25.Stanley C. A., Lieu Y. K., Hsu B. Y., Burlina A. B., Greenberg C. R., Hopwood N. J., Perlman K., Rich B. H., Zammarchi E., Poncz M. (1998) N. Engl. J. Med. 338,1352–1357 [DOI] [PubMed] [Google Scholar]
- 26.Stanley C. A., Fang J., Kutyna K., Hsu B. Y. L., Ming J. E., Glaser B., Poncz M. (2000) Diabetes 49,667–673 [DOI] [PubMed] [Google Scholar]
- 27.MacMullen C., Fang J., Hsu B. Y., Kelly A., de Lonlay-Debeney P., Saudubray J. M., Ganguly A., Smith T. J., Stanley C. A. (2001) J. Clin. Endocrinol. Metab. 86,1782–1787 [DOI] [PubMed] [Google Scholar]
- 28.Hsu B. Y., Kelly A., Thornton P. S., Greenberg C. R., Dilling L. A., Stanley C. A. (2001) J. Pediatr. 138,383–389 [DOI] [PubMed] [Google Scholar]
- 29.Li C., Buettger C., Kwagh J., Matter A., Daihkin Y., Nissim I. B., Collins H. W., Yudkoff M., Stanley C. A., Matschinsky F. M. (2004) J. Biol. Chem. 279,13393–13401 [DOI] [PubMed] [Google Scholar]
- 30.Li C., Najafi H., Daikhin Y., Nissim I. B., Collins H. W., Yudkoff M., Matschinsky F. M., Stanley C. A. (2003) J. Biol. Chem. 278,2853–2858 [DOI] [PubMed] [Google Scholar]
- 31.Li C., Allen A., Kwagh J., Doliba N. M., Qin W., Najafi H., Collins H. W., Matschinsky F. M., Stanley C. A., Smith T. J. (2006) J. Biol. Chem. 281,10214–10221 [DOI] [PubMed] [Google Scholar]
- 32.Li M., Allen A., Smith T. J. (2007) Biochemistry 46,15089–15102 [DOI] [PMC free article] [PubMed] [Google Scholar]
- 33.Vazquez J. A., Bonzalez M. P., Murado M. A. (2003) Lett. Appl. Mirobiol. 37,365–369 [DOI] [PubMed] [Google Scholar]
- 34.Hill A. V. (1910) J. Physiol. (Lond.) 40,iv–vii [Google Scholar]
- 35.Otwinowski Z., Minor W. (1997) Methods Enzymol. 276,307–326 [DOI] [PubMed] [Google Scholar]
- 36.Brunger A. T., Adams P. D., Clore G. M., Gros P., Grosse-Kunstleve R. W., Jiang J.-S., Kuszewski J., Nilges N., Pannu N. S., Read R. J., Rice L. M., Simonson T., Warren G. L. (1998) Acta Crystallogr. D Biol. Crystallogr. 54,905–921 [DOI] [PubMed] [Google Scholar]
- 37.Emsley P., Cowtan K. (2004) Acta Crystallogr. D Biol. Crystallogr. 60,2126–2132 [DOI] [PubMed] [Google Scholar]
- 38.Schüttelkopf A. W., van Aalten D. M. (2004) Acta Crystallogr. D Biol. Crystallogr. 60,1355–1363 [DOI] [PubMed] [Google Scholar]
- 39.Bailey S. (1994) Acta Crystallogr. D Biol. Crystallogr. 50,760–763 [DOI] [PubMed] [Google Scholar]
- 40.Engel P., Dalziel K. (1969) Biochem. J. 115,621–631 [DOI] [PMC free article] [PubMed] [Google Scholar]
- 41.Lackey K., Cory M., Davis R., Frye S. V., Harris P. A., Hunter R. N., Jung D. K., McDonald O. B., McNutt R. W., Peel M. R., Rutkowske R. D., Veal J. M., Wood E. R. (2000) Bioorg. Med. Chem. Lett. 10,223–226 [DOI] [PubMed] [Google Scholar]
- 42.Flocco M. M., Mowbray S. L. (1994) J. Mol. Biol. 235,709–717 [DOI] [PubMed] [Google Scholar]
- 43.Allen A., Kwagh J., Fang J., Stanley C. A., Smith T. J. (2004) Biochemistry 43,14431–14443 [DOI] [PubMed] [Google Scholar]
- 44.Smith T. J., Stanley C. A. (2008) Trends Biol. Chem. 33,557–564 [DOI] [PubMed] [Google Scholar]
- 45.Dombrowski K. E., Colman R. F. (1989) Arch. Biochem. Biophys. 275,302–308 [DOI] [PubMed] [Google Scholar]
- 46.Dombrowski K. E., Huang Y. C., Colman R. F. (1992) Biochemistry 31,3785–3793 [DOI] [PubMed] [Google Scholar]
- 47.Pal P. K., Wechter W. J., Colman R. F. (1975) Biochemistry 14,707–715 [DOI] [PubMed] [Google Scholar]
- 48.Schmidt J. A., Colman R. F. (1984) J. Biol. Chem. 259,14515–14519 [PubMed] [Google Scholar]
- 49.Smith T., Bell J. E. (1982) Biochemistry 21,733–737 [DOI] [PubMed] [Google Scholar]