Abstract
MicroRNAs are noncoding, endogenous small RNAs that regulate target genes by cleavage of the targeted mRNA or translational repression. We investigated the microRNAome using 2-color microarrays in a highly invasive human breast cancer cell line, MDA-MB-231 (subline 4175) and a noninvasive breast epithelial cell line, MCF10A. We found 13 microRNAs that were up-regulated, and nine were down-regulated significantly in 4175 cells (p < 0.05, -fold change >2) compared with MCF10A cells. Interestingly, miR-27b and its putative target gene, ST14 (suppressor of tumorigenicity 14), had inverse expression pattern in breast cancer cells. The 3′-untranslated region of ST14 contains a regulatory element for miR-27b, and our luciferase experiments indicate that antisense miR-27b enhances ST14 expression in cancer cells. Furthermore, antagomir of miR-27b suppressed cell invasion in 4175 cells, whereas pre-miR-27b stimulated invasion in moderately invasive ZR75 breast cancer cells. In addition, ST14 reduces cell proliferation as well as cell migration and invasion. Analysis of human breast tumors revealed that miR-27b expression increases during cancer progression, paralleling a decrease in ST14 expression. Furthermore, our data indicate that ST14 inhibits cells from entering into S phase by up-regulating p27, which results in down-regulation of cyclin E-CDK2 complexes, suggesting ST14 reduces cell growth through its effects on cell cycle-related proteins. Introduction of miR-27b into ST14-expressing cells did not suppress the effect on cell growth. These findings suggest that ST14 plays an important role in several biological processes, and some effects are not completely dependent on miR-27b regulation.
MicroRNAs (miRNAs)2 are a new class of noncoding, endogenous, small RNAs and are highly conserved between species (1). miRNAs are generated by the RNase III type enzyme Dicer from premature miRNAs, which are endogenous, hairpin-shaped secondary transcripts (2, 3). Mature miRNAs are single-stranded and 19–25 nucleotides in length. They bind to target sequences, usually at the 3′-UTR of genes, to down-regulate expression by cleavage of the mRNA and/or translational repression (4, 5). miRNA target genes can regulate cell development and differentiation, the cell cycle, and apoptosis (6), and miRNAs therefore play an important regulatory role in cell biology.
miRNAs may function as regulatory molecules and act as oncogenes or tumor suppressors (7). Jiang et al. analyzed the expression levels of 222 pre-miRNAs in 32 human cancer cell lines by real time PCR (8). Expression profiling of mature miRNAs has been performed in many cancers, such as lung cancer (9), ovarian cancer (10), cervical cancer (11), prostate cancer (12), breast cancer (13), colon cancer (14), and head and neck cancer cell lines (15). Several studies revealed specific miRNA expression patterns in normal and tumor samples (13, 16). Lorio et al. (13) identified 15 miRNAs that can differentiate normal versus cancer tissues, and a unique 20-miRNA metastasis signature was defined that could significantly predict (p < 0.001) primary hepatocellular carcinoma tissues with venous metastasis from metastasis-free solitary tumors (16).
Cancer metastasis is a highly complex process that involves alterations in growth, dissemination, invasion, and survival, which leads to subsequent attachment, angiogenesis, and growth of new cancer cell colonies (17). miRNAs have profound positive and negative effects on cancer metastasis (18, 19). Overexpression of an artificial miRNA that targeted the CXCR4 gene in the human breast cancer cell line, MDA-MB-231, decreases cell migration and invasion (18). miR-10b is highly expressed in human and mouse metastatic breast cancer cell lines and positively regulates cell migration and metastasis (19).
Importantly, miRNA research should seek the real target genes experimentally rather than computationally and provide evidence for their involvement in vital signaling pathways or cell processes, such as development, differentiation, and apoptosis. Hence, understanding miRNA function and target genes is an active area of research. miR-17–5p represses the AIB1 (amplified in breast cancer 1) gene as well as the estrogen receptor target genes, including cyclin D1 and E2F1 target gene CDC2 (20). miR-21 down-regulates the tumor suppressor gene TPM1 (tropomyosin 1), in MCF7 cells (21) and tumor suppressor PDCD4 genes in colorectal cancer cell lines (22). Overexpression of miR-200c can suppress transcription factor 8 and increase the expression of E-cadherin, a key protein that regulates epithelial-mesenchymal transition (23, 24). Repression of estrogen receptor-α by miR-206 occurs in human breast cancer cell lines (25), whereas miR-125a and miR-125b overexpression could suppress ERBB2 and ERBB3 expression (26). These data clearly indicate that miRNAs play important roles in several biological processes.
ST14 is an epithelium-derived membrane serine protease. ST14 forms a complex with a serine-protease inhibitor, HAI-1 (27). The expression of ST14 has been associated with several tumors, including breast, colon, prostate, and ovary (28). Prostate tumor cells, LNCap, have extremely low ST14 activity although expression levels of ST14 are high in these cells. Interestingly, stimulation of ST14/matriptase activity increased the ability of LNCap cells to invade (29). In contrast, ST14 levels are down-regulated in SK-Hep1 human hepatoma cells, suggesting a tumor-suppressive function of ST14 (30). Matriptase RNA levels are low in colorectal carcinoma tissues compared with normal tissues from healthy individuals as well as with their adjacent normal tissue (27). These data indicate that ST14/matriptase plays an important role in several types of cancers. Relatively little is known about mechanisms regulating ST14 in cancer.
Here, we profiled a highly invasive human breast cancer cell line, MDA-MB-231 subline 4175 (henceforth referred to as 4175), and a noninvasive human breast epithelial cell line, MCF10A, by miRNA microarrays and found that expression levels of miR-27b were significantly different. We validated these differences by multiple approaches and used several bioinformatics tools to predict the target genes for these miRNAs. The target for miR-27b is ST14; both miR-27b and ST14 show opposing expression patterns in MCF10A and 4175 cells. Further, the regulatory roles of miR-27b on ST14 in human breast cancer cells were determined using luciferase reporter assays. Our study is the first to reveal that miR-27b negatively regulates ST14 through a specific regulatory element located in its 3′-UTR region. We also examined the expression levels of miR-27b in a panel of 26 human breast cancer and 29 normal breast samples and found higher expression of miR-27b in cancer samples, indicating the importance of miR-27b as a tumor marker. Also, pre-miR-27b enhances cell growth of nonmalignant cells, whereas ST14 inhibits cell growth of highly invasive cells. Also, we demonstrate that ST14 plays an important role in cell cycle during G1 to S progression. Cells expressing ST14 exhibited a defect in S phase entry with down-regulation of cyclin E and CDK2, indicating that ST14 arrests cells at the G1/S boundary. Surprisingly, the effect of ST14 on cell growth is not related to miR-27b regulation, suggesting miR-27b-dependent and -independent functions of ST14 exist. Furthermore, anti-miR-27b blocks cell invasion, and a precursor of miR-27b (pre-miR-27b) stimulates cell invasion. In addition, ST14 significantly reduces cell invasion. Our results reveal that miR-27b may function as an oncogene, whereas ST14 may function as a tumor suppressor in breast cancer cells. So far, it has not been investigated whether ST14 is being regulated by miRNAs. This is the first report demonstrating that miR-27b via a specific target at nucleotides 115–122 of the 3′-UTR is negatively regulating ST14.
EXPERIMENTAL PROCEDURES
Breast Cancer Cell Lines
Human breast cancer cell lines 4175 (a generous gift from Dr. Massague, Memorial Sloan-Kettering Cancer Center, New York), MCF7, and MDA-MB-231 were maintained in Dulbecco's modified Eagle's medium supplemented with 10% fetal bovine serum. ZR75 was maintained in RPMI medium supplemented with 10% fetal bovine serum. The ERBB2-independent human mammary epithelial cell line, MCF10A, was maintained in Dulbecco's modified Eagle's medium/F-12 medium supplemented with 5% fetal bovine serum, 20 ng/ml epidermal growth factor, 0.5 μg/ml hydrocortisone, 100 ng/ml cholera toxin, and 10 μg/ml insulin. Total RNA from these cell lines was isolated by the miRNeasy kit (Qiagen Inc., Valencia, CA). The quality of RNA was determined by the Agilent Bioanalyser 2100 and RNA Nano 6000 Labchip kit (Agilent Technologies, Palo Alto, CA), and the concentration was determined with a NanoDrop apparatus (NanoDrop Technologies, Inc., Wilmington, DE).
Normal and Tumor Breast Tissues
Fifty-five human breast cancerous and noncancerous samples were obtained as surgical samples from United States patients with primary breast carcinoma. Frozen tissue sections were obtained from the southern division (Birmingham, AL), eastern division (Philadelphia, PA), mid-Atlantic division (Charlottesville, VA), midwestern division (Columbus, OH), and western division (Nashville, TN) of the Cooperative Human Tissue Network.
miRNA Microarray Analysis
miRNA microarray analysis was performed as described on the Web site of LC Sciences (Houston, TX). Briefly, poly(A) tails were coupled to the RNA sequences at the 3′-ends using a poly(A) polymerase, and nucleotide tags were then fused to the poly(A) tails. For each experiment, two sets of RNA sequences were added with tags of two different sequences for two different chips. The tagged RNA sequences were then hybridized to an miRNA microarray chip containing 471 human miRNA probes. Probe sequences are available upon request. RNAs from MCF10A and 4175 were labeled with Cy3 and Cy5, respectively. Dye swap was done on the second chip to eliminate any dye bias. The human miRNA chip includes seven replicates for each miRNA. The data were corrected by subtracting the background and normalized to the statistical median of all detectable transcripts. Background was calculated from the median of 5–25% of the lowest intensity cells. A simple t test was used to identify the differential expression of miRNAs.
Real Time PCR Validation of miRNAs
Expression of mature miRNAs was assayed using TaqMan microRNA assays (Applied Biosystems, Foster City, CA) specific to miR-27b (part number 4373068) on all cell lines. Each sample was analyzed in triplicate. Reverse transcription (RT) was performed using 10 ng of total RNA and using the looped primers specific to each miRNA. Real time PCR was performed using the standard TaqMan microRNA protocols on an ABI7700 real time PCR detection system (ABI, Foster City, CA). The 20-μl PCR components include 1.33 μl of RT product, 10 μl of TaqMan Universal PCR Master Mix, No AmpErase UNG (part number 4324018; Applied Biosystems), and 1 μl of primer and probe mix. The reactions were incubated in a 96-well plate at 95 °C for 10 min, followed by 40 cycles of 95 °C for 15 s and 60 °C for 1 min. The level of miRNA expression was measured using Ct (threshold cycle), and the ΔΔCt method was used for relative quantitation of miRNA expression levels. The ΔCt was calculated by subtracting the Ct of U6 RNA from the Ct of the miRNA of interest. The ΔΔCt was calculated by subtracting the ΔCt of one cell line from the ΔCt of other cell lines. -Fold change was generated using the Equation 2−ΔΔCt. The TaqMan microRNA assay for U6 RNA was performed using the kit RNU6B (part number 4373381) (Applied Biosystems).
Real Time PCR Validation of ST14 Expression
ST14 gene expression was examined in 55 human breast cancerous and noncancerous tissues. cDNAs were synthesized using 1 μg of each RNA sample using the Applied Biosystems high capacity cDNA reverse transcription kit (part number 4331182) (ABI). The 20-μl PCR components include 2 μl of RT product, 10 μl of TaqMan Universal PCR Master Mix, No AmpErase UNG (part number 4324018; Applied Biosystems), and 1 μl of primer and probe mix. The reactions were incubated in a 96-well plate at 95 °C for 10 min, followed by 40 cycles of 95 °C for 15 s and 60 °C for 1 min. All of the PCRs were performed on an ABI7900 Thermal Cycler. Human GAPDH (Applied Biosystems part number 4333764T) was used as the housekeeping control to normalize the ST14 expression data by the ΔΔCt method as described above.
Statistical Analysis
QPCR data were analyzed by GraphPad Prism version 5.0 software. A nonpaired t test was applied to assess the differences between the cancerous and noncancerous tissues. One-way analysis of variance was performed for QPCR data from different tissue types using the same software, and the Tukey post-test was applied to assess the differences between any two types of tissues. A value of p < 0.05 was considered statistically significant.
Northern Blotting
RNA samples (15 μg each) were run on 15% polyacrylamide, 7 mol/liter urea criterion precast gels (Bio-Rad) at 200 V for 1 h and transferred onto GeneScreen Plus membranes (GE Healthcare). Membranes were fixed by UV cross-linking at 1200 μJ and baking at 80 °C for 1 h. Two hundred nanograms of each probe was end labeled with 100 μCi of [γ-32P] ATP using the T4 polynucleotide kinase (Roche Applied Science). The hybridization was done at 37 °C in ULTRA hyb-oligo hybridization buffer (Ambion, Austin, TX) for 16 h. Membranes were washed at 37 °C, twice with 2× SSC and then 0.5% SDS. The following antisense probe was used: miR-27b, 5′-GTTCACCAATCAGCTAAGCTCT-3′. U6 RNA (5′-GCAGGGGCCATGCTAATCTTCTCTGTATCG-3′) was used for normalization.
miRNA Target Prediction
Prediction of miRNA targets was performed with the bioinformatics tools TargetScan (31), PicTar (32), and miRanda (33).
Western Blot Analysis of miRNA Targets
Cells were washed twice with cold phosphate-buffered saline, and lysates were prepared in 350 μl of radioimmune precipitation buffer and centrifuged at 20,000 × g for 20 min at 4 °C. Small aliquots (10 μl) of the lysates were used for protein determination using a BCA protein assay (Bio-Rad). Proteins (20–50 μg) were separated by SDS-PAGE in slab gels of 6 or 12% polyacrylamide and transferred on to polyvinylidene difluoride membranes (GE Healthcare). Prestained protein markers were used to determine the transfer efficiency. The membranes were blocked in 5% milk in 0.1% Tris-buffered saline-Tween 20 for 1 h at room temperature. Afterward, blots were incubated with various antibodies overnight at 4 °C. Antibody binding was revealed by incubation with horseradish peroxidase-conjugated secondary antibodies (Santa Cruz Biotechnology) and an ECL Plus immunoblotting detection system (GE Healthcare).
3′-UTR Luciferase Reporter Constructs and Luciferase Assay
Two sets of complementary oligonucleotides from the 3′-UTR of the ST14 gene, which contained the miR-27b putative binding site, were designed and synthesized by Integrated DNA Technology (Coralville, IA) (listed in supplemental Table 1). Wild-type and mutant oligonucleotides were annealed and subcloned into the HindIII and SpeI site of the pMIR-report vector (Ambion). These products are referred to as pMIR-ST14-wt and pMIR-ST14-mut, for the wild-type and mutant 3′-UTRs from the ST14 gene, respectively. The dual luciferase reporter assay system was purchased from Applied Biosystems (Madison, WI). Cells were seeded at 1.5 × 10⁵ cells/well in 6-well tissue culture plates 24 h before transfection. Cells were transiently transfected with the pMIR reporter, pMIR-ST14-wt, or pMIR-ST14-mut. pMIR-β-galactosidase vectors also were introduced for normalizing transfection efficiency. After a 48-h transfection, cells were harvested and lysed in 200 μl of lysis buffer, and the lysates were assayed for luciferase and β-galactosidase activity following standard protocols (34).
Transfection of Pre-miR-27b and Anti-miR-27b
miR-27b precursor and antisense miR-27b oligomer were purchased from Ambion. The day before transfection, 1.5 × 10⁵ cells (4175, ZR75, or MCF10A) were seeded onto 6-well plates. Different doses of precursor and inhibitor, as well as the negative control, were transfected using Lipofectamine 2000 as per the manufacturer's specifications (Invitrogen). With this approach, we get about 70% of cells transfected. The levels of miR-27b were assayed by real time PCR, and the levels of ST14 were assayed by Western blot analysis 48 h after transfection.
Transwell Cell Migration and Cell Invasion
Cell migration and cell invasion assays were performed essentially as described by us (35, 36). Briefly, 4175 or ZR75 cells were transiently transfected with antisense miR-27b or precursor of miR-27b. A pRC β-galactosidase plasmid (Stratagene, La Jolla, CA) was used as a marker. The underside of the transwell was coated with fibronectin. In case of cell invasion assays, the upper surface was also coated with Matrigel (BD Scientific, San Jose, CA). Cells were added to the upper surface. The β-galactosidase-positive cells that migrated through the membrane during a period of 24-h incubation (invasion was carried out for 48 h) were counted by staining for β-galactosidase. The ratio of migrated/invaded transfected cells to total transfected cells was plotted (normalized to the vector control). All experiments were done in the presence of serum. Similarly, ST14 (pcDNA ST14 was purchased from Open Biosystems) plasmid was transfected into MDA MB-231 cells, and cell migration and cell invasion experiments were performed. Serum-starved condition control was also added here. With our transfection approaches, we get about 70% of cells transfected, and the expressed proteins from plasmids are stable for at least 6 days.
Cell Proliferation Assay
MDA MB 231 or 4175 cells were transfected by using Lipofectamine 2000 (Invitrogen) to introduce the ST14 + β-galactosidase plasmids, anti-miR-27b + β-galactosidase or pre-miR-27b + β-galactosidase. The transfection was allowed to proceed for 48 h, after which cells were seeded into 12-well plates at a concentration of 2 × 10⁴ in triplicate; one for each respective time point was recorded. At 24-h intervals, plates were collected, and the cells were fixed in 2% paraformaldehyde and stained for 4 h at 37 °C for β-galactosidase activity using X-gal (U.S. Biochemical Corp.). The β-galactosidase-positive cells were counted for each condition at each point under a Zeiss light microscope (×100 magnification).
Cell Cycle Progression Analysis
ST14-transfected and anti-miR-27b-transfected (and controls; other combinations of miR-27b and ST14 and controls) 4175 cells were plated in 6-well plates and serum-starved overnight for synchronization. The next day, serum was added to the cells, and after 24 h of stimulation, cells were trypsinized and fixed in 70% ethanol. The cells were then stained with 0.4% propidium iodide (containing 50 μg/ml propidum iodide with 100 μg/ml RNase A). The propidium iodide-DNA complexes in cells were measured by FACScalibur. The rates of G1, S, and G2 were determined using the computer program ModFit. This analysis gave the percentage of cells in G1, S, and G2 phases.
RESULTS
miRNAome in 4175 and MCF10A Cells
To understand the role of miRNAs in breast cancer progression, we examined the expression pattern of miRNAs in a noninvasive breast cell line, MCF10A, and a highly metastatic breast cancer cell line, 4175, using a genome-wide miRNA microarray consisting of 471 human mature miRNAs. Based on probe signal intensity, miRNA expression was classified as low (1–1000), medium (1000–5000) or high (>5000) (supplemental Table 2). A t test analysis demonstrated that 22 miRNAs showed significantly different expression in the two cell lines (p < 0.05, -fold change >2), with 13 miRNAs up-regulated and nine down-regulated in 4175 cells compared with MCF10A cells (supplemental Table 3). Based on expression levels, -fold change, and novelty to cancer research (supplemental Table 3), we selected one miRNA-27b, and expression levels of miRNA-27b were further validated by quantitative real time PCR analysis.
Expression Levels of miR-27b and Its Putative Target Gene in Breast Cancer Cell Lines
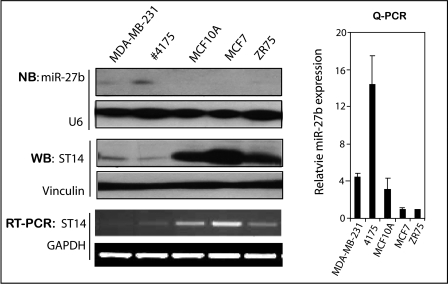
miRNAs can bind target sequences and directly regulate target genes. However, since this binding does not require an exact complementary match, individual miRNAs may regulate multiple target genes (37). Three major online data bases, TargetScan (31), PicTar (32), and MiRanda (33), can help predict potential miRNAs targets, and we used these tools to predict the target genes for miR-27b. All three data bases predicted that eight genes are putative targets of miR-27b. These targets include ST14 (suppressor of tumorigenicity), KITLG (KIT ligand), RPS6KA5 (ribosomal protein S6 kinase), CCNG1 (cyclin G1), CD28 (CD28 molecule), CDK5R1-p35 (cyclin-dependent kinase 5, regulatory subunit 1), HMGB3 (high mobility group box 3), and VAV3 (VAV3 oncogene). We selected five of them that are more relevant to cancer biology for further analysis, including ST14, cyclin G1, CD28, p35, and Vav3. Western blot analysis showed that cyclin G1, CD28, p35, and Vav3 have similar expression in highly invasive MDA MB 231, 4175, and noninvasive MCF10A. Interestingly, ST14 is very highly expressed in MCF10A cells compared with MDA MB 231 and 4175, indicating that ST14 expression levels vary in different cell types (supplemental Fig. 1 and Fig. 1).
FIGURE 1.
Expression of miR-27b and its putative target gene in human breast cell lines. Shown is analysis of miR-27b and its putative target gene, ST14. Northern blotting was performed to detect the expression levels of miR-27b (top), and U6 probe was used as a control (bottom). miR-27b expression in five cell lines was measured by QPCR, and -fold change was generated using 2−ΔΔCt and normalized for U6 snRNA. Western blot analysis (WB) showed the expression of ST14 in different cell lines. Lysates made from breast cell lines were immunoblotted with anti-ST14 (top) and with anti-vinculin antibody (bottom). RT-PCR data show the expression of ST14 (top) and control GAPDH (bottom).
We examined the expression levels of miR-27b. miR-27b expression levels were the highest in 4175, followed by MDA-MB-231, and low in ZR75 (low invasive breast cancer cell line) and MCF7 cells, by both Northern blotting and by QPCR (Fig. 1) analysis. ST14 is a transmembrane serine protease expressed at high levels in early stages of ovarian cancers and down-regulated in advanced tumors (38). Expression levels of ST14 showed an inverse relation with the expression pattern of miR-27b at both the RNA and protein levels (Fig. 1, WB and RT-PCR), suggesting that ST14 may be negatively regulated by miR-27b.
A Putative miR-27b Binding Site Exists in the ST14 3′-UTR
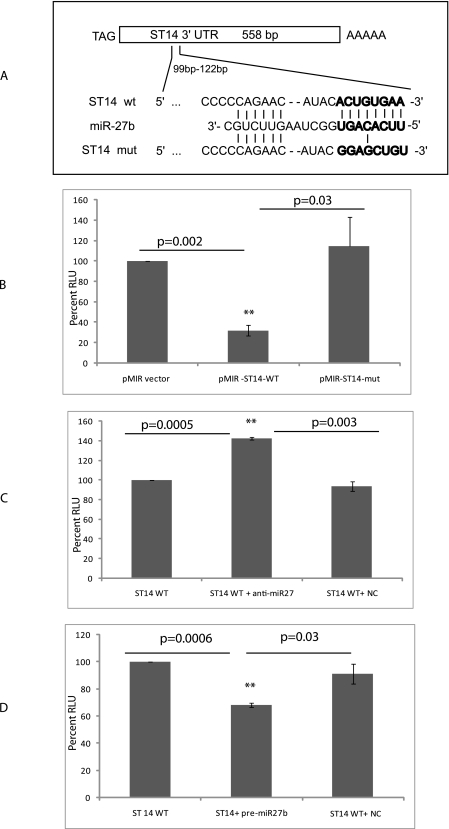
All three miRNA target algorithms predicted that the 3′-UTR of ST14 harbors a putative miR-27b binding site (Fig. 2A). To test whether the 3′-UTR of ST14 is a functional target of miR-27b, we cloned the 3′-UTR fragment containing the putative binding site into a pMIR reporter vector (pMIR-ST14-wt), transfected 4175 cells, which had the highest endogenous expression of miR-27b, and assayed for luciferase activity. The 4175 cells transfected with pMIR-ST14-wt showed a 4–5-fold decrease in luciferase activity compared with vector alone controls (Fig. 2B). To confirm the specificity of ST14 3′-UTR binding, we performed the same assay with a mutated 3′-UTR sequence (pMIR-ST14 mut). As expected, this mutant sequence did not affect the luciferase signal, suggesting that the right 3′-UTR sequence is required for this effect (Fig. 2B). These data suggest that miR-27b specifically binds to the 3′-UTR region of ST14 and reduces ST14 expression.
FIGURE 2.
ST14 3′-UTR is regulated by miR-27b. A, a schematic representation of the wild-type and mutant ST14 gene 3′-UTRs with alignment of the miR-27b binding site. B, miR-27b decreases ST14 luciferase activity. The reporter plasmids (pMIR-control, pMIR-ST14-wt, and pMIR-ST14-mut) were transiently transfected into 4175 cells, along with a β-galactosidase expression plasmid. Luciferase activities were measured after 48 h and normalized against β-galactosidase values. The data are the means ± S.D. of separate transfections (n = 3) and are shown as the ratio of firefly luciferase activity to β-galactosidase activity. The percentage of relative luciferase (RLU) activity was plotted. **, p < 0.01. C, antisense miR-27b enhances the luciferase activity driven by ST14. Cells (4175) were cotransfected with reporters and 50 nm anti-miR-27b inhibitor (Ambion). Luciferase activities were measured after 48 h. Data are expressed relative to the activity in cells transfected with an anti-miR negative control (NC) (anti-negative control). ST14WT, only ST14 vector was transfected. The data are means ± S.D. of separate transfections (n = 3). **, p < 0.01. D, the precursor of miR-27b decreases luciferase activity. ZR75 cells were cotransfected with the reporters and 100 nm pre-miR-27b precursor. Luciferase activities were measured after 48 h. Data are expressed relative to the activity in cells transfected with a pre-miR negative control (NC) (pre-negative control). The data are mean ± S.D. of separate transfections (n = 3). **, p < 0.01.
To examine whether the effect of 3′-UTR of ST14 is specific to miR-27b, we transfected 4175 cells with the pMIR-ST14-wt along with the antisense miR-27b and assayed for luciferase activity. The cells showed enhancement in luciferase activity compared with control cells (without the oligomer) or to cells transfected with the control oligomer (Fig. 2C). Also, we examined the effect of precursor miR-27b on luciferase by transfecting them into MCF10A or ZR75 cells (both cells do not express miR-27b). Transfection of the precursor miRNA with the pMIR ST14-wt plasmid showed a decreased luciferase activity in ZR75 cells (Fig. 2D) and in MCF10A cells (data not shown). Our data indicated that 3′-UTR of ST14 is specific to miR-27b.
Effects of Overexpression or Inhibition of miR-27b on Endogenous ST14 Expression
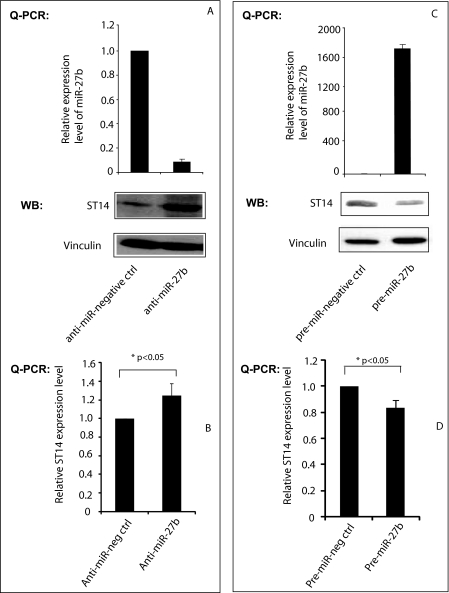
To examine whether miR-27b directly regulates endogenous ST14 levels, a 21-mer antisense miR-27b (antagomir) was transfected into 4175 cells, which express ST14 protein, and miR-27b and ST14 expression levels were examined. The anti-miR-27b, but not the control, strongly inhibited expression of miR-27b, as demonstrated by QPCR, and stimulated ST14 expression, as demonstrated by Western blotting (Fig. 3A) as well as by QPCR analysis (Fig. 3B). Next, the precursor of miR-27b was transfected into ZR75 or MCF10A (data not shown) cells, and we measured the effect on endogenous ST14. A significant overexpression of miR-27b was observed in pre-miR-27b-transfected cells but not in pre-miR-negative control cells. Also, decreased levels of ST14 were observed (Fig. 3C), as shown by Western blotting as well as by QPCR analysis (Fig. 3D). These data clearly indicate that miR-27b regulates the expression of ST14, presumably at the post-transcriptional level.
FIGURE 3.
Regulation of ST14 expression by the miR-27b. A, antisense miR-27b increases ST14 expression at the protein level. 4175 cells were transfected with 50 nm antisense miR-27b or its negative control oligonucleotide, RNA from the cells was used for QPCR of miRNA-27b, and protein was used for Western blotting (WB) using anti-ST14 antibody (top panel). QPCR data were normalized with U6 snRNA data. ST14 Western blot was stripped and reprobed with anti-vinculin antibody (bottom). B, antisense miR-27b increases ST14 at the RNA level. RNA isolated from 4175 cells transfected with antisense or its negative control was used to perform QPCR using ST14-specific primers. QPCR data were normalized with GAPDH data. C, precursor of miR-27b reduces ST14 expression. ZR75 cells were transfected with 100 nm pre-miR27b or its negative control, RNA from the cells was used for QPCR, and protein was used for Western blotting using anti-ST14 antibody (top). QPCR data were normalized with U6 small nucleolar RNA data. ST14 Western blot was stripped and reprobed with anti-vinculin antibody (bottom). D, precursor of miR-27b reduces ST14 expression. RNA isolated from ZR75 cells transfected with antisense or its negative control was used to perform QPCR using ST14 specific primers. QPCR data were normalized with GAPDH data. All experiments were repeated three times, and blots are representative of at least three separate experiments.
Expression of miR-27b and ST14 in Breast Cancer Patients
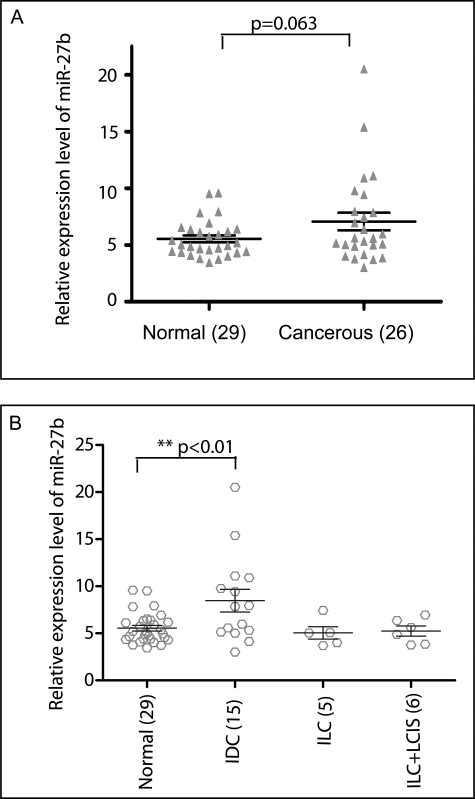
Based on our in vitro data, we suspected that miR-27b might function as an oncogene to dysregulate breast cancer cell growth. To examine this possibility in vivo, we used QPCR to measure the expression of miR-27b in cancerous tissues. First, we examined the expression of miR-27b in 26 breast cancer tissues and 29 normal breast tissues. The expression levels of miR-27b were higher in cancer patients compared with normals (p = 0.06) (Fig. 4A). Twenty-six tumor samples were divided into three groups based on their histologic subtype, and their expression levels were compared. Fifteen patients were diagnosed with invasive ductal carcinoma (IDC), five patients were diagnosed with invasive lobular carcinoma, and six samples were mixtures of invasive lobular carcinoma and lobular carcinoma in situ. As shown in Fig. 4B, miR-27b expression levels are significantly higher in IDC patients compared with normal breast. When we combined all cancerous patients data (Fig. 4A), the data were not significant (p = 0.06); however, a comparison between normals and IDC patients alone gave us a statistically significant difference (p < 0.01). It is possible that miR-27b functions are specific to IDC patients, or we may need to examine a larger sample size of other types of breast cancers to obtain statistically significant information. Nevertheless, these data suggest that miR-27b may be an important regulator of breast carcinogenesis.
FIGURE 4.
Identification of miR-27b in human cancerous breast tissues and noncancerous tissues by QPCR. QPCR was performed on total RNA as described in the methods section. A, miR-27b has higher expression in cancerous tissues (n = 26) than in noncancerous tissues (n = 29). B, miR-27b expression was analyzed in tumor tissues based on histologic type. Compared with noncancerous tissues, samples that were diagnosed as IDC had the highest expression of miR-27b (**, p < 0.01) by the t test.
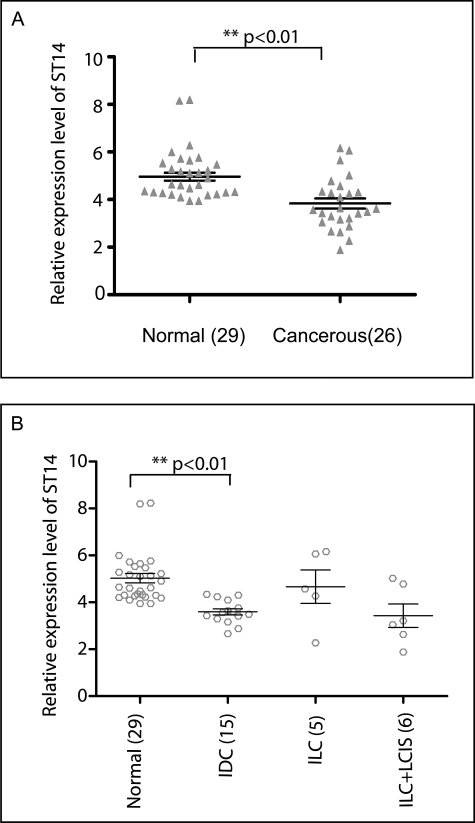
We also examined the expression levels of ST14 in vivo in human normal and breast cancer tissues. First, we compared the expression levels in 26 cancerous patients and 29 normals. As shown in the Fig. 5A, ST14 expression levels were higher in normal tissues compared with cancerous tissues (p < 0.01). Furthermore, our data indicate that normals have higher ST14 expression levels compared with subtypes of breast cancers, especially IDC samples (p < 0.01) (Fig. 5B). These results indicate that ST14 levels are significantly higher in normals compared with different types of breast cancers.
FIGURE 5.
Expression levels of ST14 gene in human cancerous and noncancerous breast tissues by QPCR. The expression levels of ST14 in human cancerous and noncancerous breast tissues were also investigated by the QPCR method, and the GAPDH was used to normalize the data. A, the relative expression level for each individual cancerous and noncancerous sample is shown. The expression data of all 26 cancerous and 29 noncancerous tissues show that ST14 expression levels are higher in noncancerous tissues than in cancerous tissues based on the mean value, and the data are statistically significant (p < 0.01). B, ST14 expression was also compared in different tumor tissues based on histologic type. Based on the mean value, tissues that were diagnosed as IDC and invasive lobular carcinoma (ILC) + lobular carcinoma in situ (LCIS), have lower expression of ST14 compared with noncancerous tissues (p < 0.01).
Effect of miR-27b and Antagomir to miR-27b on Cell Migration and Invasion
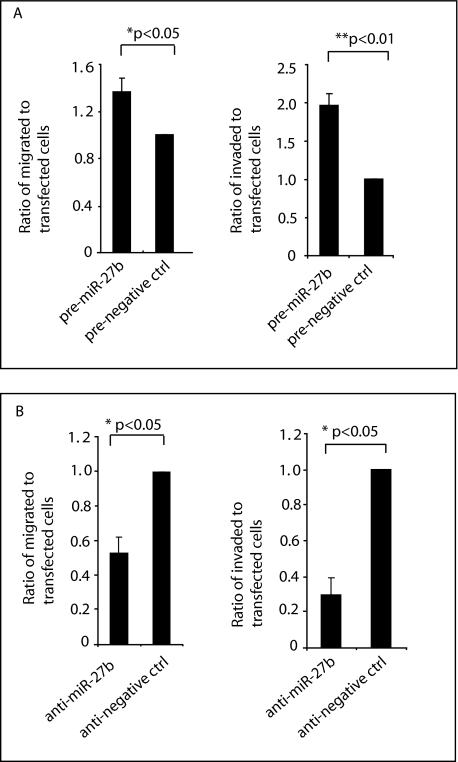
miR-27b expression is elevated in invasive breast cancer tissues, and it is involved in regulation of ST14 gene expression. This prompted us to examine the role of miR-27b in cell migration and cell invasion of breast cancer cells. ST14 is a tumor suppressor, and miR-27b reduces the expression of ST14 in highly invasive cells. We therefore transfected ZR75 cells (moderately invasive cells that do not express miR-27b) with pre-miR-27b and examined the effect on cell migration and cell invasion using a modified Boyden chamber assay (39). ZR75 cells expressing miR-27b exhibited a good enhancement in their motility (Fig. 6A, left). Invasion is a direct measure of metastatic potential and requires cell migration and proteolytic properties that allow cells to pass through a solid extracellular matrix, such as Matrigel. Consistent with cell migration data, miR-27b precursor stimulated cell invasion (Fig. 6A, right) when transfected into benign immortalized breast epithelial cells ZR75 (Fig. 6A), and all of these data suggest that miR-27b has the potential to induce tumorigenesis.
FIGURE 6.
The effect of miR-27b on human breast cancer cell migration and invasion. A, precursor of miR-27b promotes cell migration and invasion. ZR75 cells were transfected with precursor of miR-27b along with β-galactosidase plasmid (used as a marker), and a transwell migration assay was performed (left). The number of cells that had migrated to the lower surface of the filter membrane was counted in five random fields under a light microscope (×200) and normalized to the total number of transfected cells. Expression of miR-27b increased cell migration significantly (p < 0.05). Similar to the cell migration experiments, ZR75 cells were transfected with precursor of miR-27b, and cell invasion was performed (right). The number of cells that penetrated the Matrigel was counted in five random fields under a light microscope (×200). Expression of miR-27b increased cell invasion significantly (p < 0.01). B, antagomir of miR-27b inhibits cell migration and cell invasion. 4175 cells were transfected with antisense miR-27b along with β-galactosidase plasmid (used as a marker), and a transwell migration assay was performed. The number of cells that had migrated to the lower surface of the filter membrane was counted in five random fields under a light microscope (×200) and normalized to the total number of transfected cells. Inhibition of miR-27b decreased cell migration significantly (p = 0.03) (left). Similar to the cell migration experiments, 4175 cells were transfected with antisense miR-27b oligomer, and cell invasion was performed (right). The number of cells that penetrated the Matrigel was counted in five random fields under a light microscope (×200). Inhibition of miR-27b decreased cell invasion significantly (p = 0.013).
Since expression of miR-27b promotes cell migration and cell invasion, inhibition of miR-27b should inhibit these neoplastic phenotypes. Thus, we inhibited endogenous miR-27b expression in 4175 with an antisense oligonucleotide and examined cell migration and cell invasion. The antisense miRNA significantly reduced both cell migration (left) and cell invasion (right) (p < 0.05), but its scrambled control has no effect (Fig. 6B, left and right). These data further indicate that miR-27b may function as an oncogene.
Overexpression of ST14 Reduces Cell Migration and Invasion
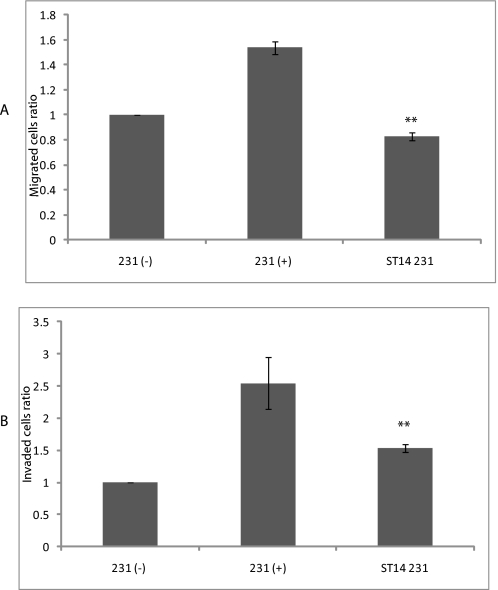
Based on the above data, we hypothesized that ST14 might affect cell motility, and thus we examined whether ST14 influences cell migration and cell invasion. ST14 was transiently transfected into MDA-MB-231 cells, and cell migration and invasion assays were performed using Boyden chamber assays as described. As shown, ST14 has a dramatic inhibitory effect on cell migration (Fig. 7A) as well as cell invasion (Fig. 7B) on highly invasive MDA-MB-231 cells, further suggesting that ST14 may have an effect on tumorigenesis/metastasis.
FIGURE 7.
ST14 inhibits tumor cell migration and cell invasion. 4175 cells were transfected with ST14 plasmid along with β-galactosidase plasmid (used as a marker), and a transwell migration assay was performed as described, showing statistically significant inhibition of cell migration. 231−, serum-starved β-galactosidase alone-transfected cells; 231+, serum-stimulated β-galactosidase alone-transfected cells; ST14 231, serum-stimulated β-galactosidase + ST14-transfected cells. Expression of ST14 decreased cell migration significantly (p < 0.01) (A). Similar to the cell migration experiments, MDA-MB-231 cells were transfected with ST14, and cell invasion was performed (B) and exhibits statistically significant (p < 0.01) inhibition of cell invasion.
Effect of ST14 and miR-27b on Cell Growth
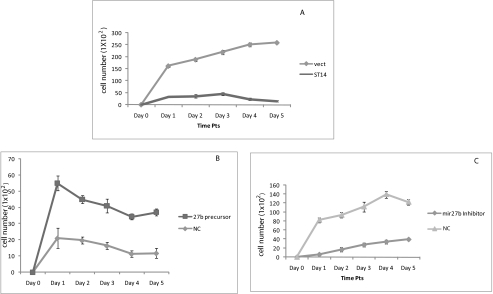
Loss of ST14 expression during cancer progression suggests that ST14 might normally function to prevent cancer progression. Cell proliferation is an important determinant of tumor growth and metastasis. To examine whether ST14 could regulate cell proliferation, we assessed the effects of ST14 on growth of MDA-MB-231 cells. Although the cells expressing vector control grew robustly upon serum induction, ST14-transfected cell growth was significantly inhibited (Fig. 8A), indicating an effect of ST14 on cell growth. Also, we examined the potential role of miR-27b on cell proliferation. As shown in Fig. 8B, pre-miR-27b-expressing cells stimulated cell growth in weakly invasive ZR75 cells. Because expression of miR-27b enhances cell proliferation, inhibition of miR-27b should decrease this cancer phenotype. An antagomir targeting miR-27b reduced cell growth of 4175 cells (Fig. 8C), providing further evidence that miR-27b may function as an oncogene.
FIGURE 8.
The effect of ST14 and miR27b on breast cancer cell growth. A, ST14 reduces tumor cell growth. β-galactosidase-transfected or β-galactosidase + ST14-transfected 4175 cells were plated and cultured for various times, and the number of proliferating cells was quantified by X-gal staining. Results shown are representative of three different experiments. B, pre-miR-27b promotes cell proliferation. Similarly, β-galactosidase-transfected or β-galactosidase + pre-miR-27b-transfected ZR75 cells were plated and cultured for various time points, and the number of proliferating cells was quantified by X-gal staining. Results shown are representative of three different experiments. C, antisense miR-27b inhibits cell proliferation. β-Galactosidase-transfected or β-galactosidase + antisense miR-27b-transfected 4175 cells were plated and cultured for various time points, and the number of proliferating cells was quantified by X-gal staining. Results shown are representative of three different experiments.
ST14 Induces G1/S Arrest and Down-regulates Cyclin E
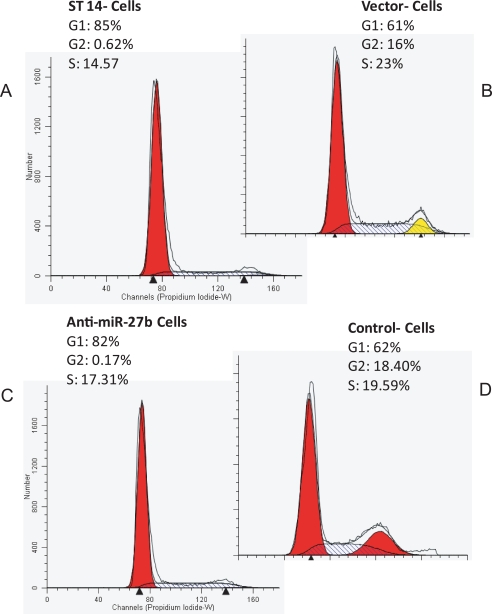
Since cell growth is tightly regulated by a series of positive and negative regulators of the cell cycle (40), we analyzed the effects of ST14 and miR-27b on cell cycle progression and its associated proteins. To determine the effects on cell cycle progression, flow cytometry was performed using propidium iodide. ST14-transfected cells showed G1/S arrest (82% compared with 61% in control), which resulted in a decrease in S phase population. Similarly, reduction of miR-27b (by using antisense miR-27b) showed accumulation of cells in G1 phase (Fig. 9).
FIGURE 9.
The effect of ST14 on cell cycle progression. 4175 cells were transfected with ST14 or anti-miR-27b, serum-starved for 24 h, and stimulated with serum. After 24 h, DNA content of incorporated propidium iodide was scanned on a flow cytometer. Each scan is derived from a representative experiment, where data from at least 10,000 events were obtained. The cell populations in G1, S, and G2 were determined using the ModFitLT software. A, 4175 cells transfected with ST14; B, vector control-transfected cells; C, anti-miR-27b transfected cells; D, control oligomer-transfected cells.
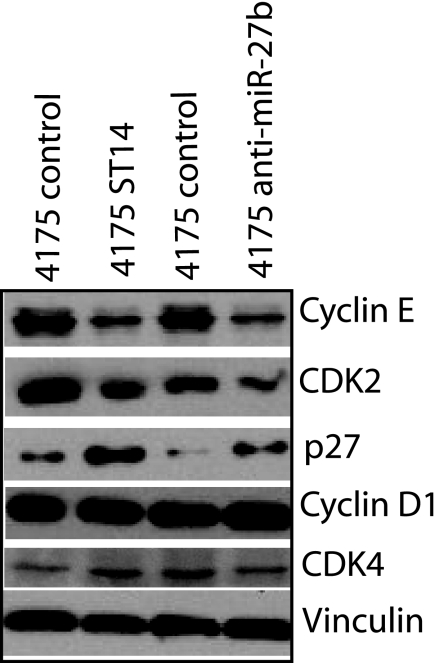
The cell cycle progression is tightly regulated by a complex network of positive and negative cell cycle-regulatory molecules, such as cyclin-dependent kinases (CDK), cyclins, and CDK inhibitors. CDK4-CDK6 (cyclin D1) and CDK2 (cyclin E) complexes phosphorylate retinoblastoma protein (pRb) in the mid to late phase of the G1 phase. Therefore, the expression levels of CDK4, CDK6, CDK2, and cyclins were examined. As shown in Fig. 10, ST14-expressing 4175 cells as well as anti-miR-27b-transfected 4175 cells decreased the expression of cyclin E but not cyclin D. Consistent with these data, CDK2 (a binding partner of cyclin E) levels also decreased in the cells. As expected, there was no change in the level of CDK4-CDK6. Furthermore, the expression levels of cyclin-dependent kinase inhibitors in the G1/S phase were also examined. As shown in Fig. 10, the expression levels of p27Kip1 significantly increased. These data suggest that ST14 affects cell growth through its effects on cell cycle-regulatory proteins.
FIGURE 10.
Action of ST14 on cell cycle-related proteins in breast cancer cells. 4175 cells were transfected with ST14 or anti-mir-27b or their controls, and cell lysates from these cells were electrophoretically separated on SDS-polyacrylamide gels and immunoblotted with an antibody against each protein and vinculin, which serves a loading control.
To further determine whether miR-27b alleviates the effect caused by ST14 on cell growth, we co-transfected miR-27b along with ST14 into 4175 cells and assayed for cell proliferation and cell cycle progression. As depicted in supplemental, miR-27b was unable to reverse the inhibitory effect of ST14 on cell growth. These data suggest that some of the effects on cell proliferation are independent of regulation of ST14 by miR-27b.
DISCUSSION
Several miRNAs function as tumor suppressors or oncogenes and regulate target gene expression at a posttranscriptional level (7). miRNAs perform important roles in human breast cancer cell growth (13, 21) and breast cancer metastasis (19). However, a comparison of a highly metastatic (lung-specific) human breast cancer cell line, 4175, and the human breast epithelial cell line, MCF10A, at the mature miRNA level has not been reported. In this study, we profiled the expression patterns of 471 mature miRNAs in these two cell lines and found differential expression of 22 miRNAs (p < 0.05). The expression patterns of miR-27b, miR-99a (data not shown), and miR-205a (data not shown) were validated by real time PCR and Northern blotting, showing that our microarray is reliable.
We found that miR-21 and miR-205 were expressed at lower levels in 4175 cells than in MCF10A cells. miR-205 is also down-regulated in prostate hormone-refractory cancerous tissues compared with benign prostatic hyperplasia (12). In contrast, both miR-21 and miR-205 act as oncogenes and are up-regulated in cancerous tissues in lungs (9), in breast (13), in tonsils (15), in ovaries (10), and in head and neck cancer cell lines (15). Recently, a study by Gregory et al. indicated that miR-200 regulates the epithelial to mesenchymal transition by targeting Zeb1 and Sip1 proteins, thereby modulating tumor metastases (24). miR-200 and miR-205 also may help establish epithelial cell lineages during embryonic development. Thus, the differential expression of miRNAs is not surprising, because miRNAs can be expressed in tissue-specific, cell line-specific, or cancer type-specific manners (8).
miRNAs are involved in many signaling pathways by regulating target genes. Although a bioinformatics analysis comparing 3′-UTRs and miRNAs can reveal multiple target genes, these targets must be confirmed experimentally. We used three online tools, TargetScan, PicTar, and Miranda, to predict the targets for miR-27b and identified ST14 and others. Through the luciferase assay, we demonstrated that at least one effective binding site is present in the ST14 3′-UTR; consistently, we observed that miR-27b is inversely correlated with ST14 in several breast cancer cell lines and tissues. We provided functional evidence of the possible role of ST14 in breast cancer by showing that forced expression of ST14 is able to reduce cell growth potential.
ST14, also named TADG-15 and MT-SP1, is a transmembrane serine protease involved in ECM degradation and may be involved in cancer migration, invasion, or metastasis (28). ST14 is overexpressed in ovarian tumors, but patients with ST14-positive tumors had substantially longer survival, suggesting that ST14 might be a prognostic marker for ovarian carcinoma (38). Our results show that the 3′-UTR of ST14 carries a putative binding site for miR-27b, and these two molecules show inverted expression patterns, indicating that ST14 is a target of miR-27b in breast cancer cells. We further evaluated miR-27b expression in matched sets of normal tissues and primary breast tumors, and again miR-27b expression was high in tumors. miR-27b expression levels are significantly higher in IDC tumors compared with normal samples (p < 0.01). Our ST14 expression data in breast cancer patients and normals indicate that ST14 expression is elevated in normals compared with cancer tissues. Also, our data show that expression levels of miR-27b and ST14 have an inverse relationship in all tissues. Furthermore, our data revealed that miR-27b promotes cell proliferation, cell migration, and cell invasion, characteristics of oncogenes. This is the first study to describe the potential oncogenic role of miR-27b in breast tumorigenesis and to show loss of expression of ST14 in breast cancer.
Our results indicate that miR-27b may function as an oncogene, whereas another study suggested it might function as a tumor suppressor despite its expression in MCF7 cells (41). Our study shows that miR-27b is overexpressed in highly invasive breast cancer cells, with expression increasing in normal (MCF10A) to moderately invasive (MCF7) to highly metastatic (MDA-MB-231) to highly metastatic exclusively to the lung (4175). miR-27a, a close homolog of miR-27b, also functions as an oncogene (42). Suppression of miR-27a in MDA-MB-231 cells decreased the expression of angiogenic genes and the percentage of MDA-MB-231 cells in S phase of the cell cycle (42). Decreased ST14 expression could result from the increased expression of miR-27b. In contrast to our findings, as discussed above, a Japanese study reported that miR-27b functions as a tumor suppressor of breast cancer in Japanese patients (41). These differences may occur because patients originated from two different continents (Asia and North America) or differed in their tumor status, estrogen receptor/prostaglandin receptor status, or histologic tumor grade. The patients in our study were estrogen receptor+/− or prostaglandin receptor+/−, and there was no association between levels of these receptors and miR-27b levels. In summary, miR-27b decreases ST14 expression in cancer cells. This is the first study to demonstrate that ST14 is negatively regulated by miR-27b post-transcriptionally via a target site in the 3′-UTR. This is also the first study to demonstrate that miR-27b stimulates invasion in breast cancer cells.
ST14/TADG15 expression is high in stage I ovarian tumors and lower in stage II/III/IV tumors (38). ST14 was identified through a subtractive hybridization analysis by Zhang et al. (43). Also, MT-SP1 was identified in the human prostate cancer cell line, PC3, by Takeuchi et al. (44). ST14/TADG15 substrates include hepatocyte growth factor, scattering factor, PAR2 (protease-activated receptor), and urokinase plasminogen activator, which affect cell proliferation, cell motility, and cell invasion (44–46). ST14 may serve as a marker for early detection of ovarian cancer. Our data indicate that ST14 reduces cell growth as well as cell invasion and cell migration, suggesting that ST14 may function as a tumor suppressor. However, TADG15 is overexpressed in 100% of primary squamous cervical tumors and 40% of cervical adenocarcinoma cell lines but not normal cervical keratinocyte control cell lines (47). Overexpression of ST14 enhances cell adhesion in colorectal cancer cells (48). Thus, ST14 has different functions in different cancer cell types, and it will be very interesting to study the in vitro and in vivo functions of ST14 in different cancers.
In the cell cycle of mammalian cells, cell division and growth are tightly controlled by a series of positive and negative regulators that act at several points throughout the cell cycle. Our data indicate that the inhibitory effect of ST14 is exerted at some point in the G1 phase. The inhibition of DNA synthesis by ST14 is associated with a reduction in the proportion of cells in the S phase and more number of cells in the G1 phase. Hence, we specifically focused on proteins that regulate the cell cycle. CDKs play an important role and promote G1/S transition by phosphorylation of the pRb protein. CDK inhibitors, such as p27Kip1 and p21Cip1 inhibit their kinase activity. ST14 down-regulates CDK2 and cyclin E expression, but not CDK4 and cyclin D1 expression. In the current study, the expression levels of p27Kip1 distinctly increased after treatment with ST14. Accordingly, current results suggest that the increase in the protein levels of p27Kip1 was accompanied by a decrease in the expression level of CDKs in the G1 phase, eventually leading to a cell cycle arrest of the G1 phase in the 4175 cells expressing ST14. However, the detailed mechanism still needs to be studied further. Furthermore, to our surprise, miR-27b failed to rescue the inhibitory effect of ST14 on cell proliferation, suggesting that the effects may be independent of connection between ST14 and miR-27b. Thus, it will be of great interest for us to understand the mechanisms of miR-27b-dependent and independent functions of ST14 in breast cancer in the near future.
Our findings are of high importance to the understanding of breast tumorigenesis, since they directly link ST14 to the regulation of cyclin-CDK2 complexes. Cyclin E plays an important role in regulation of G1/S phase transition and in tumorigenesis. Our studies provide evidence for an additional level of control in regulation of the G1/S phase transition. Cyclin D, similar to cyclin E, can enhance G1 transition; however, cyclin D1 is not regulated by ST14. The cyclin D1 and E phosphorylate and inactivate pRb protein, a well known tumor suppressor. pRb phosphorylation plays a pivotal role in controlling cellular proliferation by regulating the G1/S transition of the cell cycle. During continuous proliferation of cells, pRb is phosphorylated by the activity of G1 phase CDKs, such as CDK4/6 and CDK2, thereby liberating the factors that control the S phase entrance (40, 49, 50). Thus, ST14 may affect factors that regulate the S phase entry, which will be the subject of our future investigation. The current studies are the first to demonstrate that cyclin E-CDK2 complexes are controlled by ST14. In summary, our study suggests that ST14 may function as a tumor suppressor and miR-27b induces invasion and cell growth of breast cancer cells.
Supplementary Material
Acknowledgments
We thank all colleagues in our laboratory for help and stimulating discussions. We thank Dr. Joan Massague for generosity in providing 4175 cells. Also, we thank Dr. A. Catling for critical reading of the manuscript.
This work was supported, in whole or in part, by National Institutes of Health Grant CA 115706 and National Institutes of Health COBRE Grant RR078766. This work was also supported by Susan Komen Grant BCTR0600278, Louisiana Board of Regents Grant LEQSF-RD-A-14, and funds from Louisiana Cancer Research Consortium (to S. K. A.).

The on-line version of this article (available at http://www.jbc.org) contains supplemental Tables 1–3 and Figs. 1–3.
- miRNA
- microRNAs
- UTR
- untranslated region
- RT
- reverse transcription
- GAPDH
- glyceraldehyde-3-phosphate dehydrogenase
- QPCR
- real time quantitative PCR
- X-gal
- 5-bromo-4-chloro-3-indolyl-β-d-galactopyranoside
- IDC
- invasive ductal carcinoma
- CDK
- cyclin-dependent kinase
- pRb
- retinoblastoma protein.
REFERENCES
- 1.Ambros V. (2004) Nature 431,350–355 [DOI] [PubMed] [Google Scholar]
- 2.Lee Y., Jeon K., Lee J. T., Kim S., Kim V. N. (2002) EMBO J. 21,4663–4670 [DOI] [PMC free article] [PubMed] [Google Scholar]
- 3.Lee Y., Ahn C., Han J., Choi H., Kim J., Yim J., Lee J., Provost P., Rådmark O., Kim S., Kim V. N. (2003) Nature 425,415–419 [DOI] [PubMed] [Google Scholar]
- 4.Ambros V. (2001) Cell 107,823–826 [DOI] [PubMed] [Google Scholar]
- 5.He L., Hannon G. J. (2004) Nat. Rev. Genet. 5,522–531 [DOI] [PubMed] [Google Scholar]
- 6.Miska E. A. (2005) Curr. Opin. Genet. Dev. 15,563–568 [DOI] [PubMed] [Google Scholar]
- 7.Zhang B., Pan X., Cobb G. P., Anderson T. A. (2007) Dev. Biol. 302,1–12 [DOI] [PubMed] [Google Scholar]
- 8.Jiang J., Lee E. J., Gusev Y., Schmittgen T. D. (2005) Nucleic Acids Res. 33,5394–5403 [DOI] [PMC free article] [PubMed] [Google Scholar]
- 9.Yanaihara N., Caplen N., Bowman E., Seike M., Kumamoto K., Yi M., Stephens R. M., Okamoto A., Yokota J., Tanaka T., Calin G. A., Liu C. G., Croce C. M., Harris C. C. (2006) Cancer Cell 9,189–198 [DOI] [PubMed] [Google Scholar]
- 10.Iorio M. V., Visone R., Di Leva G., Donati V., Petrocca F., Casalini P., Taccioli C., Volinia S., Liu C. G., Alder H., Calin G. A., Menard S., Croce C. M. (2007) Cancer Res. 67,8699–8707 [DOI] [PubMed] [Google Scholar]
- 11.Lui W. O., Pourmand N., Patterson B. K., Fire A. (2007) Cancer Res. 67,6031–6043 [DOI] [PubMed] [Google Scholar]
- 12.Porkka K. P., Pfeiffer M. J., Waltering K. K., Vessella R. L., Tammela T. L., Visakorpi T. (2007) Cancer Res. 67,6130–6135 [DOI] [PubMed] [Google Scholar]
- 13.Iorio M. V., Ferracin M., Liu C. G., Veronese A., Spizzo R., Sabbioni S., Magri E., Pedriali M., Fabbri M., Campiglio M., Ménard S., Palazzo J. P., Rosenberg A., Musiani P., Volinia S., Nenci I., Calin G. A., Querzoli P., Negrini M., Croce C. M. (2005) Cancer Res. 65,7065–7070 [DOI] [PubMed] [Google Scholar]
- 14.Schetter A. J., Leung S. Y., Sohn J. J., Zanetti K. A., Bowman E. D., Yanaihara N., Yuen S. T., Chan T. L., Kwong D. L., Au G. K., Liu C. G., Calin G. A., Croce C. M., Harris C. C. (2008) JAMA 299,425–436 [DOI] [PMC free article] [PubMed] [Google Scholar]
- 15.Tran N., McLean T., Zhang X., Zhao C. J., Thomson J. M., O'Brien C., Rose B. (2007) Biochem. Biophys. Res. Commun. 358,12–17 [DOI] [PubMed] [Google Scholar]
- 16.Budhu A., Jia H. L., Forgues M., Liu C. G., Goldstein D., Lam A., Zanetti K. A., Ye Q. H., Qin L. X., Croce C. M., Tang Z. Y., Wang X. W. (2008) Hepatology 47,897–907 [DOI] [PubMed] [Google Scholar]
- 17.Nguyen D. X., Massagué J. (2007) Nat. Rev. Genet. 8,341–352 [DOI] [PubMed] [Google Scholar]
- 18.Liang Z., Wu H., Reddy S., Zhu A., Wang S., Blevins D., Yoon Y., Zhang Y., Shim H. (2007) Biochem. Biophys. Res. Commun. 363,542–546 [DOI] [PubMed] [Google Scholar]
- 19.Ma L., Teruya-Feldstein J., Weinberg R. A. (2007) Nature 449,682–688 [DOI] [PubMed] [Google Scholar]
- 20.Hossain A., Kuo M. T., Saunders G. F. (2006) Mol. Cell Biol. 26,8191–8201 [DOI] [PMC free article] [PubMed] [Google Scholar]
- 21.Zhu S., Si M. L., Wu H., Mo Y. Y. (2007) J. Biol. Chem. 282,14328–14336 [DOI] [PubMed] [Google Scholar]
- 22.Frankel L. B., Christoffersen N. R., Jacobsen A., Lindow M., Krogh A., Lund A. H. (2008) J. Biol. Chem. 283,1026–1033 [DOI] [PubMed] [Google Scholar]
- 23.Hurteau G. J., Carlson J. A., Spivack S. D., Brock G. J. (2007) Cancer Res. 67,7972–7976 [DOI] [PubMed] [Google Scholar]
- 24.Gregory P. A., Bert A. G., Paterson E. L., Barry S. C., Tsykin A., Farshid G., Vadas M. A., Khew-Goodall Y., Goodall G. J. (2008) Nat. Cell Biol. 10,593–601 [DOI] [PubMed] [Google Scholar]
- 25.Adams B. D., Furneaux H., White B. A. (2007) Mol. Endocrinol. 21,1132–1147 [DOI] [PubMed] [Google Scholar]
- 26.Scott G. K., Goga A., Bhaumik D., Berger C. E., Sullivan C. S., Benz C. C. (2007) J. Biol. Chem. 282,1479–1486 [DOI] [PubMed] [Google Scholar]
- 27.Vogel L. K., Saebø M., Skjelbred C. F., Abell K., Pedersen E. D., Vogel U., Kure E. H. (2006) BMC Cancer 6,176. [DOI] [PMC free article] [PubMed] [Google Scholar]
- 28.Darragh M. R., Bhatt A. S., Craik C. S. (2008) Front. Biosci. 13,528–539 [DOI] [PubMed] [Google Scholar]
- 29.Tsui K. H., Chang P. L., Feng T. H., Chung L. C., Sung H. C., Juang H. H. (2008) Anticancer Res. 28,1993–1999 [PubMed] [Google Scholar]
- 30.Hwang E. S., Kim G. H. (2009) Exp. Biol. Med. 234,105–111 [DOI] [PubMed] [Google Scholar]
- 31.Lewis B. P., Burge C. B., Bartel D. P. (2005) Cell 120,15–20 [DOI] [PubMed] [Google Scholar]
- 32.Krek A., Grün D., Poy M. N., Wolf R., Rosenberg L., Epstein E. J., MacMenamin P., da Piedade I., Gunsalus K. C., Stoffel M., Rajewsky N. (2005) Nat. Genet. 37,495–500 [DOI] [PubMed] [Google Scholar]
- 33.John B., Enright A. J., Aravin A., Tuschl T., Sander C., Marks D. S. (2004) PLoS Biol. 2,e363. [DOI] [PMC free article] [PubMed] [Google Scholar]
- 34.Gramantieri L., Ferracin M., Fornari F., Veronese A., Sabbioni S., Liu C. G., Calin G. A., Giovannini C., Ferrazzi E., Grazi G. L., Croce C. M., Bolondi L., Negrini M. (2007) Cancer Res. 67,6092–6099 [DOI] [PubMed] [Google Scholar]
- 35.Alahari S. K., Reddig P. J., Juliano R. L. (2004) EMBO J. 23,2777–2788 [DOI] [PMC free article] [PubMed] [Google Scholar]
- 36.Ding Y., Milosavljevic T., Alahari S. K. (2008) Mol. Cell Biol. 28,3742–3756 [DOI] [PMC free article] [PubMed] [Google Scholar]
- 37.Griffiths-Jones S., Grocock R. J., van Dongen S., Bateman A., Enright A. J. (2006) Nucleic Acids Res. 34,D140–144 [DOI] [PMC free article] [PubMed] [Google Scholar]
- 38.Tanimoto H., Shigemasa K., Tian X., Gu L., Beard J. B., Sawasaki T., O'Brien T. J. (2005) Br. J. Cancer. 92,278–283 [DOI] [PMC free article] [PubMed] [Google Scholar]
- 39.Alahari S. K., Lee J. W., Juliano R. L. (2000) J. Cell Biol. 151,1141–1154 [DOI] [PMC free article] [PubMed] [Google Scholar]
- 40.Deshpande A., Sicinski P., Hinds P. W. (2005) Oncogene 24,2909–2915 [DOI] [PubMed] [Google Scholar]
- 41.Tsuchiya Y., Nakajima M., Takagi S., Taniya T., Yokoi T. (2006) Cancer Res. 66,9090–9098 [DOI] [PubMed] [Google Scholar]
- 42.Mertens-Talcott S. U., Chintharlapalli S., Li X., Safe S. (2007) Cancer Res. 67,11001–11011 [DOI] [PubMed] [Google Scholar]
- 43.Zhang Y., Cai X., Schlegelberger B., Zheng S. (1998) Cytogenet. Cell Genet. 83,56–57 [DOI] [PubMed] [Google Scholar]
- 44.Takeuchi T., Harris J. L., Huang W., Yan K. W., Coughlin S. R., Craik C. S. (2000) J. Biol. Chem. 275,26333–26342 [DOI] [PubMed] [Google Scholar]
- 45.Parr C., Sanders A. J., Davies G., Martin T., Lane J., Mason M. D., Mansel R. E., Jiang W. G. (2007) Clin. Cancer Res. 13,3568–3576 [DOI] [PubMed] [Google Scholar]
- 46.Parr C., Jiang W. G. (2006) Int. J. Cancer 119,1176–1183 [DOI] [PubMed] [Google Scholar]
- 47.Santin A. D., Cane S., Bellone S., Bignotti E., Palmieri M., De Las Casas L. E., Anfossi S., Roman J. J., O'Brien T., Pecorelli S. (2003) Cancer 98,1898–1904 [DOI] [PubMed] [Google Scholar]
- 48.Sun L. F., Zheng S., Shi Y., Fang X. M., Ge W. T., Ding K. F. (2004) Zhonghua Yi Xue Za Zhi 84,843–848 [PubMed] [Google Scholar]
- 49.Buttitta L. A., Edgar B. A. (2007) Curr. Opin. Cell Biol. 19,697–704 [DOI] [PMC free article] [PubMed] [Google Scholar]
- 50.DeGregori J. (2006) Mol. Cell Biol. 26,1165–1169 [DOI] [PMC free article] [PubMed] [Google Scholar]
Associated Data
This section collects any data citations, data availability statements, or supplementary materials included in this article.


