Abstract
The optical setup and the performance of a prototype UV/Vis multiwavelength analytical ultracentrifuge (MWL-AUC) is described and compared to the commercially available Optima XL-A from Beckman Coulter. Slight modifications have been made to the optical path of the MWL-AUC. With respect to wavelength accuracy and radial resolution, the new MWL-AUC is found to be comparable to the existing XL-A. Absorbance accuracy is dependent on the light intensity available at the detection wavelength as well as the intrinsic noise of the data. Measurements from single flashes of light are more noisy for the MWL-AUC, potentially due to the absence of flash-to-flash normalization in the current design. However, the possibility of both wavelength and scan averaging can compensate for this and still give much faster scan rates than the XL-A. Some further improvements of the existing design are suggested based on these findings.
Keywords: Analytical Ultracentrifugation, UV/Vis Spectroscopy, Multiwavelength detection
Introduction
Analytical ultracentrifugation (AUC) is a very powerful absolute fractionating technique. As all analytical techniques, analytical ultracentrifugation relies on a detection system. In this case, it must allow for the visualization of the concentrations in the ultracentrifuge cell, namely, the distribution of the solute under study as a function of time and/or radial distance from the centre of rotation. Historically, absorption was among the first principles used to follow sedimentation processes, soon to be followed by systems based on refractometry including Rayleigh interference, Schlieren and the Lavrenko Optics [1–4]. Modern commercial machines (Beckman XL-A) are equipped with a UV/Vis absorption optics as well as a Rayleigh interference system. The limited detection options available impose practical limitations to exploring all the possibilities of the method because in principle, every kind of sample consisting of a solvent and a dissolved or dispersed phase can be investigated in an AUC. Therefore, detector development for analytical ultracentrifuges has always been an important issue to expand the capabilities of this powerful fractionating technique. Turbidity optics were developed for the determination of particle size distributions [5–7]. In addition, fluorescence optics have been described, one of which has recently become commercially available [8, 9].
The absorption optical system of the commercially available analytical ultracentrifuge, the XL-A of Beckman Coulter, introduced in 1991 and described in detail [10] is based on a photomultiplier tube detecting light at a single pre-selected wavelength delivered by a polychromatic flash lamp. This system has remained essentially unchanged ever since. In the intervening years, however, development in the semiconductor industry has been made. A substantial decrease of the price and partially also the size of semiconductor products (spectrometers, counter cards, analog to digital converters) as well as the variety of powerful programming techniques enables to develop more efficient detectors. Spectrometer technology made small, cheap, fast, and precise detection systems based on charge-coupled device (CCD) arrays commercially available. It is obvious that such a detection system would greatly expand the possibilities of analytical ultracentrifugation on several fronts, not the least being the promise that multiwavelength analysis holds for studies of multiple interacting components [11] or colloidal particles with size-dependent optical properties (quantum dots or metal nanoparticles) [12].
Other advantages include the possible gain in experimental time, even for a limited number of wavelengths, without a concomitant loss of information due to the very fast detection, as short as 10 μs with state of the art spectrometers, the associated possibility of data averaging, and a fast detection speed for quickly sedimenting samples. The potentially cheaper overall price for a functional analytical ultracentrifuge is also promising, if such a spectrometer could be built into a preparative ultracentrifuge. Attempts to adapt such spectrometers to the special situation of the ultracentrifuge have been recently described [13, 14] and hold promise for future applications. The obvious advantages of multiwavelength detection were already described for the first generation detector together with some measurement examples and basic system performance [13, 14].
In this contribution, we wish to describe some modifications made to the original first generation detector design by Bhattacharyya et al. [13, 14] and report the performance of the current second generation prototype design as compared to the commercial system available in the XL-A. This way, current limitations will become apparent, indicating directions for further improvements.
Materials and methods
The prototype machine (henceforth called MWL-AUC or MWL detector if referred to the detector for short) of the first generation described in [13] has been modified with respect to a simplification of the already existing hardware [13, 14] as described below.
Flash lamp
The original flash lamp (Hamamatsu L4633-01) with a maximum repetition rate of 100 Hz and a self-built fiber coupling [13] was replaced by a faster Xenon flash lamp module (high power Xe flash lamp L-9456-12 from Hamamatsu Photonics GmbH, Herrsching, Germany, and a suitable power supply) which can be directly coupled into an optical fiber via an SMA 905 adapter. It has a maximum flash rate of 530 Hz, allowing for a more than fivefold increase of the repetition rate, resulting in a possible scan repetition speed of < 2 ms provided the spectrometer is fast enough. This is the case in software triggering mode for the USB2000 and with hardware triggering mode for the new USB4000 spectrometer (both Ocean Optics). The standard deviation of the light intensity, as stated by the manufacturer, is 1.5%. Low flash-to-flash intensity variation is important, as the system does not yet have an intensity normalization routine.
Detector arm and spectrometer mount
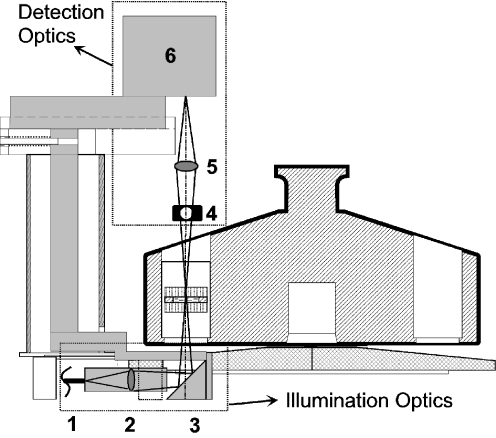
In the first-generation setup, the light from the flash lamp was coupled into the centrifuge via an optical fiber and a vacuum feedthrough, passed the measurement cell, and was imaged onto a 25- or 50-μm slit. Then it was fed back into a fiber out of the centrifuge until it reached the entrance slit of the spectrometer (typically 25 μm). The disadvantage of this setup was that the light had to pass two narrow slits, which significantly limited the light intensity available at the detector. We have improved the design in the second-generation detector in a way that the UV/Vis spectrometer entrance slit (Ocean Optics, USB 2000) is now mounted on top of the detector arm at the focal position of the colliminating lens where the light was coupled into the fiber again in the first-generation design. The new setup is schematically shown in Fig. 1.
Fig. 1.
The detector arm. 1 A 600-μm patch fiber UV/Vis (Ocean Optics); 2 The collimating lens system (self-built), f = 20.6-mm biconvex; 3 90° Quartz prism; 4 Iris diaphragm for reducing light intensity; 5 Focusing biconvex lens (40 mm); 6 Spectrometer. The light path is also shown schematically
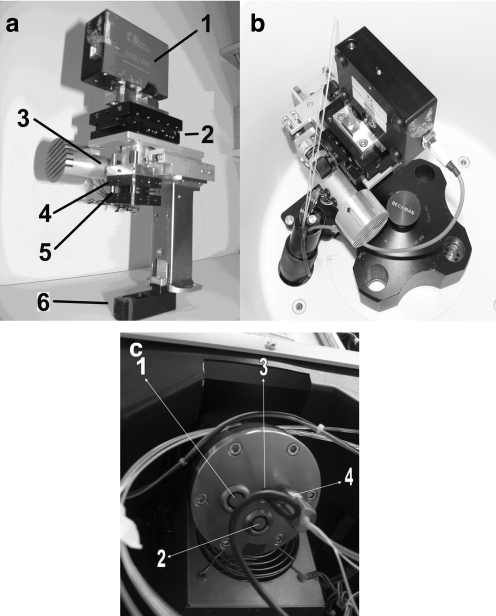
The advantage of this setup is the combined use of the spectrometer entrance slit (25 μm) as radial and wavelength aperture for the spectrometer. In this way, a much higher intensity can be obtained at the detector. The maximum intensity can actually be so high that the spectrometer is maxed out over the entire wavelength detection range. This makes the application of an iris necessary to limit the light intensity (4 in Fig. 1). The entire setup of the second-generation detector arm is still modular—it can fit into every preparative and analytical Beckman ultracentrifuge. Actually, the described detector design is a modular replacement of the XL-A UV/Vis absorption optics. Due to the reversible detector setup, the detector is exchanged against the XL-A detector within an hour’s time. The hardware of the detector arm with mounted spectrometer is shown in Fig. 2 as well as the mounted detector arm in the ultracentrifuge. The socket of the flash lamp is replaced by a mount for vacuum feedthroughs for fibers and cables as a hardware module for vacuum feedthroughs (Fig. 2c).
Fig. 2.
a Photograph of the detector arm: 1 Spectrometer; 2 Table with the possibility of x–y movement; 3 Step motor; 4 Lens (40-mm biconvex); 5 Iris and 6 90° Quartz prism. b The arm fitted in the centrifuge. c Photograph of the vacuum feedthrough: 1 Electronic feedthrough for step motor; 2 Electronic feedthrough for spectrometer; 3 Electronic connection for TTL pulse for rpm measurements; 4 Optical feedthrough for fibers
Imaging optics
To simplify the optical alignment, we also simplified the optical path: instead of two collimating lenses as in the original first-generation design (f = 20 mm, biconvex and f = 15 mm, biconvex) [13] or the two biconvex lenses of f = 60 mm and f = 12.5 mm described in [14], we currently use only one biconvex lens (f = 40 mm) at a position optimized ex centrifugo on an optical bench to image the centre of the ultracentrifuge cell onto the detector slit to allow for a simplified detector alignment. This minimizes chromatic aberration problems, which are inevitably associated with the use of lenses for white light as well as the optical alignment procedure of the detector itself.
Overall, the second-generation detector has a faster more powerful flash lamp combined with an improved hardware optical arm design, allowing for a much higher light intensity combined with a much simplified optical alignment as compared to the first generation detector [14]. All lenses were purchased from LINOS Photonics GmbH (Göttingen, Germany).
Optical tests
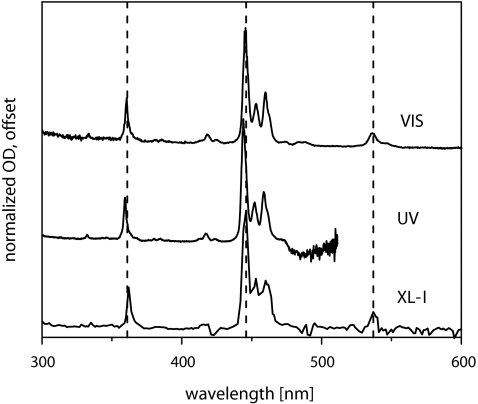
To determine the wavelength accuracy of both optical systems, an Ho2O3 centerpiece was used (as supplied with the original purchase of the XL-A AUC from Beckman Instruments, Palo Alto, CA, USA). Characteristic sharp peaks were expected (among others) at 361/446/537 nm [15]. For determining the accuracy of the absorbance readings at different wavelengths, two kinds of reference solutions were prepared. For measuring data at 302 nm, solutions of KNO3 (Sigma) at various concentrations were freshly prepared in water. Solutions of universal indicator pH 4–10 (Merck, Darmstadt, Germany) were prepared in buffer solution of pH 4 (Metrohm, Herisau, Switzerland). These were measured at 525 nm in the XL-A and MWL-AUC. These solutions were then measured on a benchtop spectrometer (lamba 2 UV/VVis spectrometer from Perkin Elmer, Überlingen, Germany), a Beckman Coulter XL-A and the MWL-AUC. To obtain a measure of the precision of the data, we recorded radial scans and averaged them over the entire length of the solution column. No averaging was performed for the single data points. For the measurements with the benchtop spectrometer, data points were recorded every 500 ms over a total time of 60 s and averaged. Mean values and standard deviations thus obtained are reported. Data were normalized to compensate for different optical path lengths (12 mm for analytical ultracentrifuges and 10 mm for the benchtop spectrometer).
To determine the intrinsic noise and the baseline accuracy of the data at different wavelengths, an empty hole of a rotor was flashed with 1, 10, and 100 point averaging over the entire range of wavelengths available. Wavelength resolution was set to 1 nm for the XL-A. All measurements were performed at 3,000 rpm in a fully evacuated centrifuge chamber at 25 °C. The setting of the multiplexer of the MWL-AUC was adjusted so that only a single flash was recorded per integration interval. The intensity of light impinging on the spectrometer was limited to about 80% saturation at the most intensive peaks of the intensity spectrum.
To determine the optical resolution, a 200-μm slit vaporized onto a standard AUC cell window (provided by BASF AG) was imaged at several wavelengths. The slit window was mounted together with a normal window on a single sector cell such that the slit was facing the inside surface of the centerpiece.
Results
General aspects
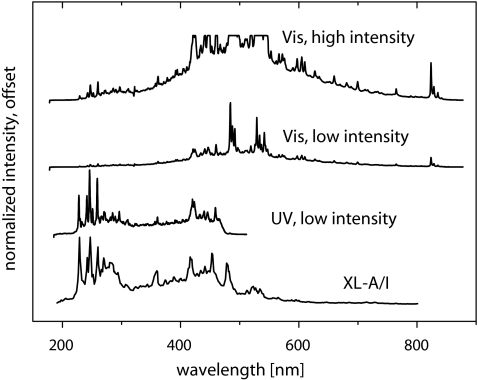
Our modifications of the optics greatly enhanced light intensity in the vacuum chamber as compared to the first generation detector described in [13] (Fig. 3).
Fig. 3.
Intensity distributions for USB2000 spectrometers with different in-built diffraction gratings as compared to the XL-A. Vis Diffraction grating optimized for the Visible spectral range, high/low intensity, the iris opened maximally/minimally. With the iris maximally opened, the maximum intensity of the spectrometer (4,000 counts) is reached, and the spectrometer is maxed out at these wavelengths. UV Diffraction grating optimized for the UV range. With the iris maximally opened, about 70% of the available channels are saturated; these data are therefore not shown. Note that the flash lamp used in the MWL-AUC is different from the one of the XL-A. Due to the design of the spectral dispersion/detection system in the USB2000 spectrometers, the raw intensity spectra for the different spectrometers are a convoluted function of both the emission spectrum of the flash lamp and the preinstalled diffraction grating of the spectrometer itself
This obviously leads to a better performance of the detection systems especially in the UV range and allows some fine tuning of the intensity for the wavelength range most suitable for the experiment at hand by adjusting the amount of light via the iris. In this respect, the spectrometer with a diffraction grating optimized for the Visible region is certainly the most flexible. However, in terms of traditional protein measurements, the UV spectrometer is more appropriate as shown in Fig. 3. The detected UV lamp spectra of the XL-A and MWL detectors agree quite well so that a similar performance can be expected in the UV range. While the MWL UV signal decreased to 0 at about 480 nm, the XL-A signal only slowly decreases up to 800 nm, but at a very low intensity level as compared to the UV. On the other hand, the MWL Visible signal still has sufficient intensity at wavelengths up to >800 nm, suggesting the interesting possibility of measuring in the near IR (>800 nm), already with the existing flash lamp and spectrometer. A combination of a UV optimized spectrometer with one optimized for the visible wavelength to near IR range is therefore better for the detected intensities as compared to the broadband detection of the XL-A. However, it must be stated that at maximum, 4,000 counts are possible with the currently applied 12-bit USB2000 spectrometer (Ocean optics). Application of the current state-of-the-art USB4000 16-bit spectrometers (Ocean optics) enable up to 16,000 counts, which can enable a higher flexibility and dynamic range using this spectrometer.
The data density for the XL-A is on the order of 0.5–0.6 points per nanometer, as expected from the limited precision of the gear train driving the diffraction grating. According to the Beckman specifications of 4 nm, this amounts even to only 0.25 data points per nanometer.
With the USB2000 spectrometers from Ocean optics, the total number of data points available is 2,048 (already 3,648 with the follow-up model USB 4000); therefore, as a function of the spectral range of the spectrometer, the data density is on the order of 6 and 3 points per nanometer for the UV- and Vis-optimized spectrometers, respectively. Although this does not reflect the actual wavelength resolution, which is limited, amongst other factors, by the band pass of the diffraction grating and its groove density, it offers plenty of data points for averaging, thus reducing the noise of the data without affecting the accuracy of the wavelength positions.
Radial resolution
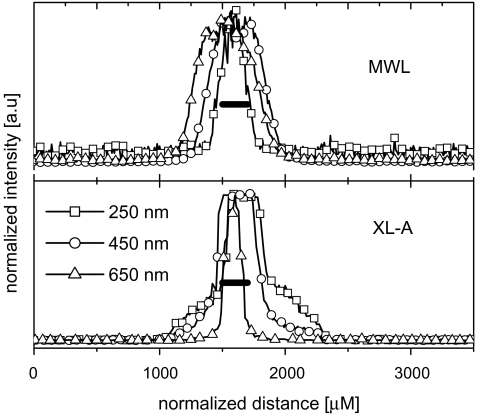
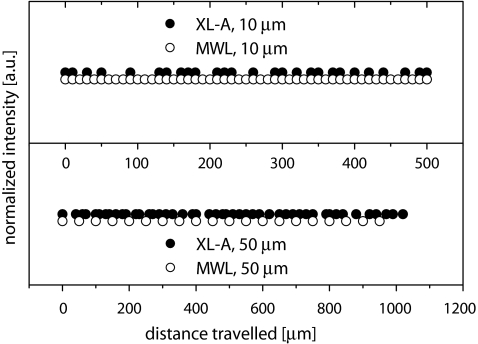
In the current design of the MWL-AUC, a certain degree of wavelength dependence of the radial resolution is expected because lens optics is used with the associated chromatic aberration problems. Such wavelength dependence of the radial resolution is indeed observed in our measurements of a 200-μm slit (Fig. 4): The apparent radial resolution decreases with increasing wavelength, quite in contrast to the situation with the XL-A, which is likely a result of optical alignments. It can also be seen from Fig. 4 that the MWL-AUC is already capable of delivering a higher radial resolution than the Xl-A, especially in the UV wavelength range most suitable to biological polymers. Note that the step motor used in the MWL-AUC (Zaber T-LA-28-SV) is capable of delivering a radial resolution of better than 1 μm. The accuracy of the radial positioning is ±0.1 μm, as given by the manufacturer. A possibility to eliminate the unwanted wavelength dependence of the radial resolution would be to remove lenses altogether from the optical path. The use of a mirror-based optical system could be a useful possibility to achieve this to maintain a beam of parallel light illuminating the sample, as has been already discussed in [13], but the required mirrors with small focal lengths have to be custom-made (unpublished results). We note that the radial step size of the XL-A, although set to 10 μm, corresponded, on average, to approximately 19 μm in these measurements, whereas it was 10 μm for the MWL-AUC, as set in the software. Whether this is a characteristic of the individual XL-A used in these measurements or a more generalized phenomenon remains to be determined, but the 9-μm inaccuracy of the XL-A is well within the radial accuracy specifications of 50 μm given by Beckman. At any rate, the radial precision of the MWL-AUC’s step motor greatly exceeds that of the XL-A servo motor. As shown in Fig. 5, the radial spacing of the measurement points is very regular, especially when compared to the radial spacing of data points from the XL-A. Moreover, the radial position of the data points obtained for the MWL-AUC is very reproducible without detectable radial variation, from repeated measurements. This is a clear advantage for methods which apply pairwise subtraction of consecutive scans to obtain a time derivative of the concentration profiles. However, the radial accuracy was not independently determined other than from the standard radial calibration using a normal counterbalance cell. The time required to scan the whole radial length of a cell (5.8–7.2 cm) is comparable for both systems. The MWL-AUC currently takes 1:17/2:00/6.51 min at 50/30/10 μm distance between consecutive data points, whereas the XL-A takes 1:13/1:44/5:01 min at 50/30/10 μm.
Fig. 4.
A slit of 200 μm was imaged using the MWL-AUC and the XL-A at different wavelengths. The thick solid bar represents a distance of 200 μm. The wavelength resolution is dependent on wavelength. It is higher in the UV wavelength range for the MWL-AUC, but higher in the Visible range for the XL-A
Fig. 5.
Reproducibility of the step size for the MWL and the XL-A AUCs for 10- and 50-μm step size, respectively, for a scan of a cell. Not all data points of the MWL detector (50 μm) are shown for clarity reasons
Wavelength accuracy
In contrast to the XL-A, where the wavelength positions have to be calibrated internally from the intensity spectrum of the flash lamp, the USB2000 spectrometer is shipped pre-calibrated by the manufacturer. The calibration constants are a characteristic of each spectrometer. As can be seen from Fig. 6, the wavelength accuracy of the XL-A and the two USB2000 spectrometers used in our MWL-AUC are comparable. Whereas the Beckman specification of the wavelength accuracy is only 4 nm, the CCD array spectrometers can be tuned to a very high accuracy by choosing the correct groove density or line spacing of the grating at the expense of the wavelength range (http://www.oceanoptics.com/Products/bench_grating_usb.asp).
Fig. 6.
Wavelength accuracy of the XL-A and the MWL-AUC. An HO2O3 centerpiece was used to record absorbance spectra as shown. The dotted vertical lines indicate the positions for three characteristic peaks at 361, 446, and 537 nm, respectively
In the spectrometers applied in this study, a groove density of 600 was chosen together with a 25-μm slit and a wavelength range of 650–670 nm, yielding a wavelength resolution of about 1.3 nm for the applied optical spectrometers (see http://www.oceanoptics.com/technical/rangeandres_usb.asp). However, application of higher groove densities will yield a higher wavelength resolution at the expense of the wavelength range with the same 25 μm slit like 0.3 nm for a 2,400-mm-1 grating with a spectral range of only 140 nm. (see http://www.oceanoptics.com/technical/rangeandres_usb.asp). Nevertheless, the most reasonable compromise appears to be a wavelength range of about 600 nm combined with a wavelength resolution of 1.2–1.3 nm, which is more accurate and much more reproducible than the wavelengths from the XL-I. Therefore, the approximately 3 pixels per nanometer can already be used for effective data averaging without loosing spectral resolution.
Due to the pre-calibration and fixed position of the diffraction grating for the USB2000 spectrometers, wavelength positions can be expected to be stable over, in principle, the lifetime of the spectrometers. This clearly increases reproducibility and reliability of repeated independent measurements with this type of optics. The USB2000 spectrometers with which the data in Fig. 6 were recorded have been in use in our lab for more than 2 years.
Absorbance accuracy and linearity
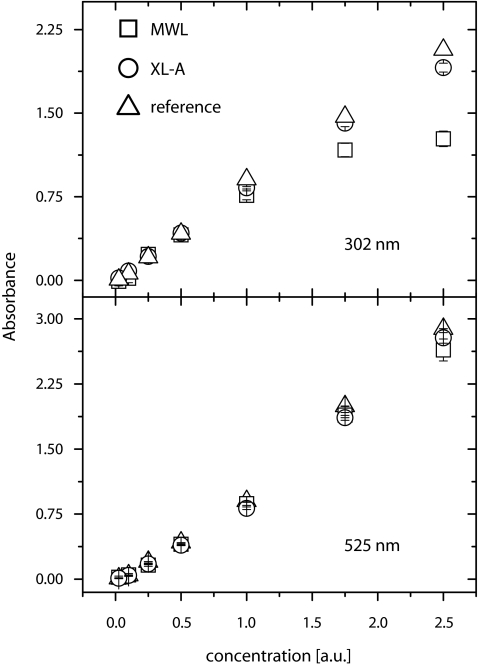
We measured the absorbance accuracy in two wavelength regions, in the near UV (302 nm) and in the Visible (525 nm; Fig. 7).
Fig. 7.
Absorbance accuracy of the MWL-AUC at different wavelengths. The reference are data measured by a benchtop double-beam spectrometer (model lambda 2 from Perkin Elmer)
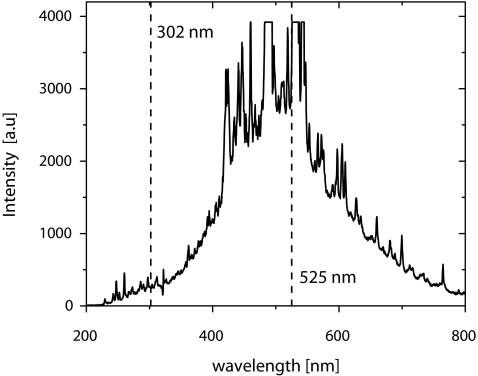
This was done to explore the influence different light intensities might have on the accuracy and linearity of the absorbance readings. Generally, data for the MWL-AUC and the XL-A compare well to those measured from a benchtop spectrometer. Differences exist for the range of linear data. This range was found to be very much dependent on the initial light intensities, I0. At 302 nm, data recorded with the MWL-AUC become nonlinear at an OD of about 0.8, whereas those for the XL-A are still linear well above an OD of 1. At 525 nm, data appear linear for the MWL-AUC and the XL-A up to an OD of 1.5. From the intensity spectrum for the MWL-AUC for these measurements (Fig. 8), it is apparent that at 302 nm, I0 at the detector was on the order of 265 counts, a very low value. At 525 nm, I0 was approximately 3,600 counts, close to the maximum number of 4,000 counts. However, the light intensity can be fine-tuned to a certain degree via the Iris (vide supra) to improve I0, and hence, linearity of the data in the desired wavelength range.
Fig. 8.
Reference intensities I0 of the absorbance measurements shown in Fig. 6. The dotted vertical lines indicate the two wavelengths at which data were recorded
The dark noise of the spectrometer is on the order of 5–10 counts. The standard deviation of the data was slightly worse for the MWL-AUC compared to the XL-A, being in the order of ±0.03 OD compared to ±0.02 OD, respectively, at 302 nm, whereas it was at ±0.02 OD and ±0.01 OD at 525 nm. The precision of the benchtop photometer was two orders of magnitudes below these values at both wavelengths. The slight decrease in absorbance precision for the MWL-AUC appears to be caused not only by the raw intensities of the measurements but also by other factors specific to our setup.
Intrinsic noise of the data
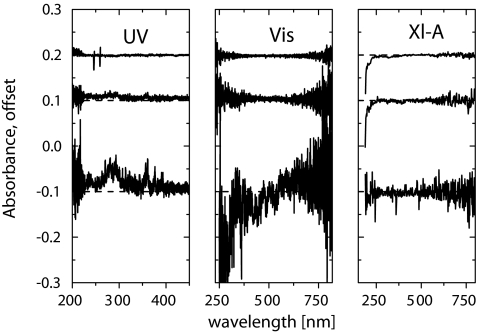
To qualitatively compare the intrinsic noise of the data at different wavelengths and the baseline accuracy, we monitored an empty hole of a rotor over the full accessible wavelength range and at a number of averages. As can be seen from Fig. 9, the noise of the data between the different centrifuge designs is comparable, except for the measurement with no averaging where the USB2000 spectrometers are performing worse than the XL-A, in agreement with the findings from the absorbance measurements (vide supra). One plausible explanation for this observation could be the absence of flash-to-flash intensity normalization for the MWL-AUC, which quickly averages out. In future designs, this normalization of the flash lamp intensity for every wavelength will be achieved by a second identical spectrometer monitoring the intensity of the lamp after a small part of the light was deviated to this spectrometer by a beam splitter. With 10 and 100 point averaging, the noise level appears to be similar for the XL-A and the MWL-AUC. Baseline stability is satisfactory in all cases, provided enough averages are being taken. The lack of baseline stability for measurements is a direct reflection of the absence of flash-to-flash normalization as well.
Fig. 9.
Noise comparison between the XL-A and the MWL-AUC. Spectra were taken with 1/10/100 point averaging, shown as the bottom/middle/top spectrum, respectively. Dotted horizontal lines indicate the offset true baselines. Due to the higher point density for the USB2000 spectrometers, the spectra appear broader as they are in reality. Note the differences in scale of the abscissae. The respective statistical data are: UV(1), −0.016 ± 0.029; UV(10), 0.007 ± 0.009; UV(100), 0.001 ± 0.005; Vis(1), −0.011 ± 0.059; Vis(10), 0.004 ± 0.010; Vis(100), −0.002 ± 0.003; XL-A(1), −0.003 ± 0.017; XL-A(10), −0.001 ± 0.006; XL-A(100), −0.002 ± 0.004. UV scanned 200–500 nm; Vis scanned 250–800 nm, and XL-I scanned 200–800 nm
One of the greatest possibilities of the new MWL-AUC can also be gathered from Fig. 9: While it took only about 15 s to record a full wavelength spectrum with 100 points averaging with the USB2000 spectrometers, the spectrum with the XL-A took approximately 180 min to complete. The gain in experiment time without losing information is obvious. Besides the noise generated by the lamp intensity variation, a further source of noise is that the computer for the detector control and data acquisition does not work in real time. In the present Labview-based program, the lack of real-time operation generates slight variations in the generation of the triggering of lamp and spectrometer, as we now use software triggering of the spectrometer which allows for faster data acquisition (down to 2 ms for the applied USB2000) than the hardware triggering mode, which was applied in the earlier described setup (50-ms integration time) [13]. With this change, we eliminated the noise caused by the response time difference of spectrometer and flash lamp, which were triggered by the same pulse. As the flash of the flash lamp is very short and in the order of 3–4 μs, slight variations of the trigger pulse timing will cause noise.
However, when using software triggering of the spectrometer with an integration that is long enough for whole rotation of rotor even at the highest rotational speed, the timing of the spectrometer triggering with respect to the turning rotor can not be determined anymore in contrast to hardware triggering. There is a small probability that the spectrometer starts to acquire data in the middle of a flash, which leads to an intensity drop of the detected intensity. For further development, we are planning to solve this problem by using much faster USB4000 spectrometers with hardware triggering as fast as 10 μs and to calibrate the response time of spectrometer and flash lamp to the same trigger pulse. In addition, we will use a real-time system to ensure correct timing.
Discussion
Compared to the results presented in an earlier contribution on a first-generation MWL detector prototype, progress has been made on the issue of light intensity available at the detector. With the current modifications, it is possible to bring more light into the vacuum chamber than the dynamic range of the CCD chip can digest. This is a mandatory requirement for precise, linear, accurate—and hence useful—measurements with the MWL-AUC and is clearly apparent from our data. Due to the very broad distributions of intensities over the available wavelength range and the clear correlation with linearity of the recorded data, we have added to the software of the MWL-AUC the feature that the spectrum of I0 is being stored together with the corresponding measurements. This will allow for the definition of linearity ranges after the experiment has been performed. The higher dynamic range of the USB4000 spectrometers will be of great benefit in this respect too.
We wish to point out that the performance of the MWL-AUC is comparable or already superior to the Beckman Coulter Xl-A, currently the only commercially available ultracentrifuge worldwide. This is remarkable, as the MWL-AUC still is very much an experimental prototype and the XL-A a finished product for which clear specifications exist. Again, this can be taken as an indication that we are only starting to get glimpses of the speed, accuracy, resolution, and precision that will be possible with an optimized version of our design. It should be pointed out that this increased performance does not come at a higher price. We estimate the total investment in an MWL machine to be about only half the amount necessary for the purchase of an XL-A. As the design of the MWL-AUC is such that other detectors can be accommodated as well, a cheap, precise and multidetector analytical ultracentrifuge appears within reach. The more serious limitations of the current design are the absence of flash-to-flash normalization, which would increase the baseline accuracy of the absorbance readings at low degrees of averaging and the reliance on software for multiplexing the flash lamp. In our hands, this has proven to be extremely sensitive to minor flaws in cables, insulations, soldering, etc. A computer-independent hardware trigger is very much desirable. Chromatic aberration still is an issue which should be dealt with in future developments by application of mirror optics. From a practical point of view, however, as the radial resolution already achievable is equal or superior to the XL-A, this should not hinder first experiments already taking advantage of the increased information available with the MWL-AUC. It should also encourage other users of the centrifuge to start building their own MWL-AUCs, as it is a modular system which can be easily adapted to any of the Beckman XL ultracentrifuges and likely also a bunch of older machines. Ideally, the new users can contribute their ideas and practical experiences to the development process and, therefore, make it available to the scientific community.
In recent years, most of the progress in analytical centrifugation has been in the fields of software and analysis. Current algorithms and computer programs make complicated analyses easier and user-friendly than ever before such that even the amateur user of the technique is sometimes confronted with the limitations of the hardware. With the introduction of the XL-A in 1991, the situation was very much the opposite, and the availability of the commercial machine sparked and catalyzed many developments which we now take for granted. It will be fun to see what exciting new experiments and software will be developed once the hardware of the analytical ultracentrifuge is again ahead of the analytical possibilities.
Acknowledgments
We acknowledge the excellent work of Hendrik Pitas from the electronic workshop (MPIKG) during the whole detector development. Financial support by BASF and the Max-Planck Society is also gratefully acknowledged.
References
- 1.Schachman HK (1992) Is there a future for the ultracentrifuge? In: Harding SE et al (ed) Analytical ultracentrifugation in biochemistry and polymer science. Royal Society of Chemistry, Cambridge
- 2.Svedberg T, Pedersen KO (1940) The ultracentrifuge. Clarendon, Oxford
- 3.Lloyd PH (1974) Optical methods in ultracentrifugation, electrophoresis and diffusion: with a guide to the interpretation of records. Clarendon, Oxford
- 4.Lavrenko P, Lavrenko V, Tsvetkov V (1999) Shift interferometry in analytical ultracentrifugation of polymer solutions. Progr Colloid Polym Sci 113:14
- 5.Scholtan W, Lange H (1972) Bestimmung der Teilchengrößenverteilung von Latices mit der Ultrazentrifuge. Kolloid Z Polym 250:782 [DOI]
- 6.Müller HG (1989) Automated determination of particle-size distributions of dispersions by analytical ultracentrifugation. Colloid Polym Sci 267:1113 [DOI]
- 7.Mächtle W (1992) Analysis of polymer dispersions with an eight-cell-auc-multiplexer: high resolution particle size distributions and density gradient techniques. In: Harding SE et al (ed) Analytical ultracentrifugation in biochemistry and polymer science. Royal Society of Chemistry, Cambridge
- 8.Schmidt B, Riesner B (1992) A fluorescence detection system for the analytical ultracentrifuge and its application to proteins, nucleic acids, viroids and viruses. In: Harding SE et al (ed) Analytical ultracentrifugation in biochemistry and polymer science. Royal Society of Chemistry, Cambridge
- 9.MacGregor IK, Anderson AL, Laue TM (2004) Fluorescence detection for the XL-I analytical ultracentrifuge. Biophys Chem 108:165 [DOI] [PubMed]
- 10.Giebeler R (1992) The Optima XL-A: A new analytical ultracentrifuge with a novel precision absorption optical system. In: Harding SE et al (ed) Analytical ultracentrifugation in biochemistry and polymer science. Royal Society of Chemistry, Cambridge
- 11.Balbo A, Minor KH, Velikovsky CA, Mariuzza RA, Peterson CB, Schuck P (2005) Studying multiprotein complexes by multisignal sedimentation velocity analytical ultracentrifugation. Proc Natl Acad Sci U S A 102:81 [DOI] [PMC free article] [PubMed]
- 12.Cölfen H, Pauck T Antonietti M (1997) Investigation of quantum size colloids using the XL-I ultracentrifuge. Progr Colloid Polym Sci 107:136–147
- 13.Bhattacharyya SK, Maciejewska P, Börger L, Stadler M, Gülsün AM, Cicek HB, Cölfen H (2006) Development of a fast fiber based UV/Vis multiwavelength detector for an ultracentrifuge. Progr Colloid Polym Sci 131:9–22 [DOI]
- 14.Bhattacharyya SK (2006) Development of Detector for Analytical Ultracentrifuge. PhD-thesis, University of Potsdam
- 15.Beckman C (1991) XL-A manual. Fullerton, USA


