The image quality of the one-tenth dose image, which was severely degraded by quantum noise, could be improved markedly to nearly the same level of the routine dose images by using the highly constrained back-projection-local reconstruction noise-reduction algorithm, without substantial loss of quantitative accuracy.
Abstract
Purpose:
To prospectively evaluate the accuracy of computed tomographic (CT) perfusion measurements of renal hemodynamics and function obtained by using images acquired with one-tenth the typical radiation dose and postprocessed with a highly constrained back-projection (HYPR)–local reconstruction (LR) noise-reduction technique.
Materials and Methods:
This study was approved by the institutional Animal Care and Use Committee. Two consecutive CT perfusion acquisitions were performed in 10 anesthetized pigs over 180 seconds by using routine (80 kV, 160 mAs) and one-tenth (80 kV, 16 mAs) dose levels. Images obtained with each acquisition were reconstructed with identical parameters, and the one-tenth dose images were also processed with a HYPR-LR algorithm. Attenuation changes in kidneys were determined as a function of time to form time-attenuation curves (TACs). Extended gamma-variate curve-fitting was performed, and regional perfusion, glomerular filtration rate, and renal blood flow were calculated. Image quality was evaluated (in 10 pigs), and the agreement for renal perfusion and function between the routine dose and the one-tenth dose HYPR-LR images was determined (for 20 kidneys) by using statistical methods. Statistical analysis was performed by using the paired t test, linear regression, and Bland-Altman analysis.
Results:
TACs obtained with the one-tenth dose were similar to those obtained with the routine dose. Statistical analysis showed that there were no significant differences between the routine dose and the one-tenth dose acquisitions in renal perfusion and hemodynamic values and that there were slight but statistically significant differences in some values with the one-tenth dose HYPR-LR–processed acquisition. The image quality of the one-tenth dose acquisition was improved by using the HYPR-LR algorithm. Linear regression and Bland-Altman plots showed agreement between the images acquired by using the routine dose and those acquired by using the one-tenth dose with HYPR-LR processing.
Conclusion:
A 10-fold dose reduction at renal perfusion CT imaging can be achieved in vivo, without loss of accuracy. The image quality of the one-tenth dose images could be improved to be near that of the routine dose images by using the HYPR-LR noise-reduction algorithm.
Supplemental material: http://radiology.rsna.org/lookup/suppl/doi:10.1148/radiol.2531081677/-/DC1
© RSNA, 2009
Current computed tomographic (CT) perfusion techniques require the acquisition of 30 seconds or more of serial stationary scans. The time-attenuation curve (TAC) over the tissue or organ of interest is used, with various models of single- and multiple-compartment flow, to estimate parameters such as absolute blood flow and volume and vascular permeability (1–3). For oncologic applications, increased tissue perfusion has been studied to assess tumor malignancy and potential response to therapy, while in ischemic disease applications, blood flow is correlated to tissue viability (1,4–7). Thus, CT perfusion imaging may have a clinical role in both oncologic and cardiovascular applications. Although the radiation dose for medically indicated CT examinations may present a very small increase in risk for an individual, concern about the increase in population cumulative dose has heightened with the increase in CT utilization. Additionally, with CT perfusion studies, skin injury (deterministic risk) is possible if the examination is improperly performed. To avoid such injury, the technique factors per serial scan must be kept relatively low so that the cumulative examination skin dose is below the threshold for skin injury. This, however, results in increased noise and artifact levels that may compromise the quantitative accuracy of the technique. Hence, methods to decrease image noise at the same or decreased radiation dose levels are highly desirable. The highly constrained back-projection (HYPR) technique allows reconstruction of serial images from highly undersampled data (8). In HYPR, individual time frames are obtained by unfiltered back projection of normalized sinograms using anatomic constraints provided by a composite image. A modified algorithm—HYPR–local reconstruction (LR)—permits the use of a longer temporal window in the formation of the composite image, resulting in increased signal-to-noise ratio (SNR) and quantitative reconstruction accuracy (9).
Despite the potential clinical utility, in vivo CT assessment of renal hemodynamics and function in patients is not common, primarily because of concerns regarding radiation dose. The purpose of this study was to prospectively evaluate the accuracy of CT perfusion measurements of renal hemodynamics and function obtained by using images acquired with one-tenth the typical radiation dose and postprocessed with the HYPR-LR noise-reduction technique.
Materials and Methods
Experimental Protocol
This animal study was approved by our institutional Animal Care and Use Committee.
Ten anesthetized domestic female pigs (weight range, 43–51 kg) (Manthei Hog Farm, Elk River, Minn) underwent CT perfusion imaging performed by using a dual-source 64-section multidetector CT system (Definition DS; Siemens Healthcare, Erlangen, Germany) at both the typical radiation dose level and a one-tenth dose level. A pigtail catheter (Super Torque; Cordis, Warren, NJ) was advanced through one jugular vein into the right atrium for contrast medium injection. Each CT study was performed to assess cortical and medullary perfusion, renal blood flow (RBF), and glomerular filtration rate (GFR) (10–16). One to 2 seconds before scanning, a 0.5-mL bolus of contrast medium (Isovue 370; Bracco Diagnostics, Princeton, NJ) per kilogram of body weight was injected into the right atrium by using a power injector connected to the catheter by a 36-inch contrast medium–filled tube (10–16). For the routine CT perfusion acquisition, scanning was performed at 80 kV and 160 mAs in the sequential mode, with 24 × 1.2-mm collimation and a 0-mm table feed (17). By using a 0.33-second gantry rotation time and full reconstruction, 70 multiscan exposures (vascular phase) were acquired with a 0.66-second interval, followed by another 70 scans (tubular phase) with a 1.98-second interval, bringing the total scanning time to about 3 minutes. This relatively long scan duration results in a high dose level (volume CT dose index = 386.4 mGy). The estimated skin dose level was approximately half the volume CT dose index (approximately 193.2 mGy) (18). As a reference, deterministic effects may occur for skin doses as low as 1000 mGy in a single dose (19). After a 2000-mGy single dose, skin reddening may occur (20).
For each exposure, four contiguous 7.2-mm sections were scanned and reconstructed with a B35f kernel (medium smooth). However, only one of the four images was used in the perfusion analysis, which resulted in 140 consecutive time sequence images. We usually selected the section that best showed the renal hilus, because the structures (cortex, medulla, main vessels) were easily discernible at that level and renal curvature was minimal, thus decreasing the risk of volume averaging artifacts. Respiration was suspended at end expiration for the first 70 scans, and assisted ventilation was provided between scans during the last 70 scans.
After a 15-minute rest, studies were repeated by using a low-dose CT perfusion acquisition. The low-dose acquisition used identical scanning and reconstruction parameters as our routine CT perfusion acquisition except that the radiation dose level was reduced to one-tenth the original dose (volume CT dose index = 39.2 mGy) by lowering the tube current–time product to 16 mAs.
HYPR-LR Image Processing
The images acquired with both the routine dose level and the one-tenth dose level were reconstructed on the CT console by using a filtered back-projection algorithm. However, the images acquired with the one-tenth dose level were further processed by using the HYPR-LR noise-reduction algorithm, which can markedly improve the SNR in this time-resolved application. Compared with other noise-reduction methods, HYPR-LR can greatly reduce the noise while preserving edges (ie, high spatial resolution), with minimum computational cost (21). Mathematically, the algorithm can be expressed as follows:
where IH(t) is the HYPR-LR processed individual time frame, F is a convolution kernel, It is the normal filtered back-projection reconstruction of an individual time frame, IC is the composite image and ⊗ represents the convolution operation. The composite images were formed by superimposing several or all of the acquired time frames. Obviously, one constraint of using HYPR-LR is that the algorithm requires motion-free images across the scan duration. The other constraint is the convolution kernel size. The kernel size should be as small as possible to avoid signal overaveraging between different areas. The SNR level of HYPR-LR–processed images is primarily determined by the SNR level of the composite image, provided the number of pixels in the convolution kernel is comparable to the number of time frames used to form the composite images (9,21). As a rule of thumb, a composite of 10 frames would save roughly 10 times the radiation dose because the ensemble average of the 10 frames can be viewed as an image with exposure 10 times higher than that of a single image. A more detailed description of the working mechanism of HYPR-LR is provided in Appendix E1 (Appendix E1 [online]). In our studies, we used sliding composite images with a temporal window of 11 frames centered at each frame. A 5 × 5-pixel uniform square kernel was used for the convolution kernel F.
Image Analysis
Images acquired with the routine dose, the one-tenth dose, and the HYPR-LR–processed one-tenth dose were transferred to workstations for display and analysis with a software package (ANALYZE; Biomedical Imaging Resource, Mayo Clinic, Rochester, Minn). Image quality was evaluated in terms of the background SNR (in 10 pigs). The background SNR was measured by calculating the ratio of the mean CT number over the standard deviation of pixels within the region of interest (ROI). The ROI was set at the erector spinae muscle region. The area of the ROI used for the background SNR calculation was 4.76 cm2 over 1998 pixels. ROIs in the kidney were manually traced on the cross-sectional images that showed the vascular phase from the aorta, bilateral renal cortex, and medulla (in 20 kidneys) (J.D.K., with 9 years of experience). These ROIs were transferred to the other images in the series automatically. Average tissue attenuation in each image was automatically calculated, and the changes in attenuation over time were plotted as TACs. These TACs were fitted by using extended gamma-variate curve-fitting algorithms and the curve-fitting parameters used to obtain measures of renal function (15). The parameters obtained from the vascular curve in each region of the kidney were used to calculate regional perfusion. Our study focused on conventional and clinically applicable measures of renal function, and subsequent peaks were not analyzed for tubular dynamics. For each peak observed in the ROI, the area under the curve and its first moment were calculated. Blood volume (BV) was subsequently calculated as the area under the tissue vascular curve divided by the area under the aortic curve. The first moment of the curve was assumed to represent mean transit time (MTT) in seconds, starting at the appearance of contrast material in the kidney. Regional perfusion (in milliliters per minute per cubic centimeter of tissue) was then calculated as BV/MTT. RBF (in milliliters per minute) was subsequently calculated as the sum of cortical and medullary blood flows, each obtained as the product of the perfusion and volume of the respective region. GFR (in milliliters per minute) was calculated from the right and left cortical TACs by utilizing the slope of the proximal tubular curve, aortic area, and cortical volume (15).
Renal volumes were determined by using data from a separate scan during the same study (14). In that scan, a short central venous injection of iopamidol (0.5 mL/kg over 5–6 seconds) was administered to sustain corticomedullary differentiation (vascular phase) throughout the volume scan. The renal volume scan was performed in the helical mode (240 mAs; 120 kV; pitch, 1.2; and B40 medium kernel) to obtain contiguous 5-mm-thick levels from pole to pole for measurements of cortical, medullary, and whole-kidney volumes.
Statistical Analysis
Statistical comparisons among routine dose, one-tenth dose, and one-tenth dose with HYPR-LR processing acquisitions were performed by using the paired t test with Bonferroni adjustment. To ensure that the overall significance level was 5%, each comparison was performed at a significance level of P < .0167 (ie, .05/3). Correlation coefficients and least-square regressions (forced through zero) were calculated to assess the relationship between the routine dose and the one-tenth dose with HYPR-LR processing assessments. Bland-Altman analysis was also applied to further evaluate the agreement between the routine dose and the one-tenth dose with HYPR-LR processing assessments (22).
Results
Image Quality Improvement with HYPR-LR
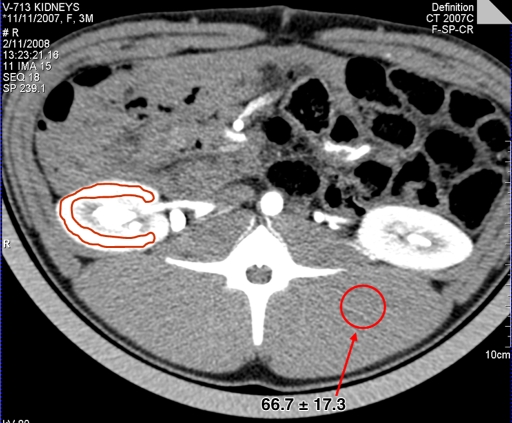
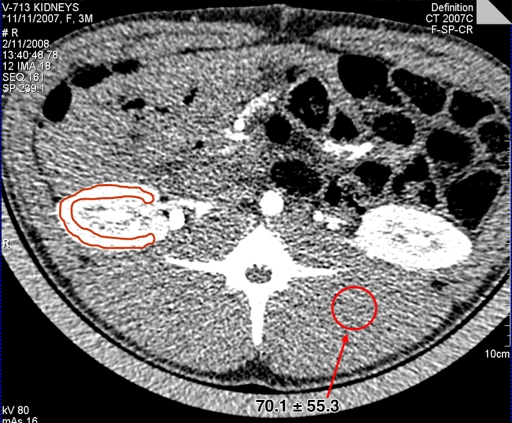
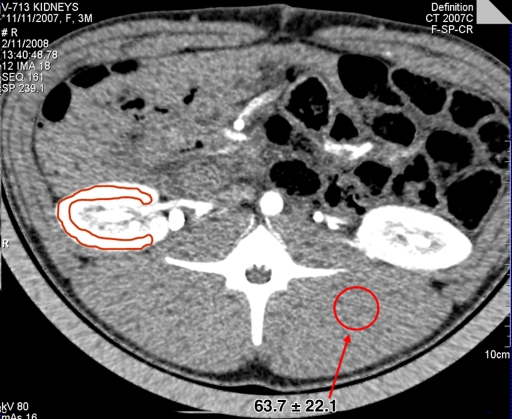
Image quality was evaluated in terms of the background SNR (in 10 pigs) (Fig 1). The mean background SNRs (the ratios of mean CT number over the standard deviation of pixels within the ROI) for the routine dose, one-tenth dose, and one-tenth dose HYPR-LR images were 4.18, 1.29, and 2.96, respectively. The SNR was improved to 3.83 with the use of a 10 × 10 convolution kernel. However, further increasing the kernel size is not very helpful because the SNR is primarily determined by the number of frames used in the composite image (9). In addition, there is also a risk of crosstalk from different anatomic areas if a larger kernel is used (9).
Figure 1a:
Renal perfusion CT images obtained with (a) routine dose level (80 kV, 160 mAs), (b) one-tenth dose level (80 kV, 16 mAs), and (c) HYPR-LR–processed one-tenth dose level. Means and standard deviations of CT numbers at a selected ROI (arrow) in the back muscles are also shown. The highlighted renal contour is the region of the renal cortex.
Figure 1b:
Renal perfusion CT images obtained with (a) routine dose level (80 kV, 160 mAs), (b) one-tenth dose level (80 kV, 16 mAs), and (c) HYPR-LR–processed one-tenth dose level. Means and standard deviations of CT numbers at a selected ROI (arrow) in the back muscles are also shown. The highlighted renal contour is the region of the renal cortex.
Figure 1c:
Renal perfusion CT images obtained with (a) routine dose level (80 kV, 160 mAs), (b) one-tenth dose level (80 kV, 16 mAs), and (c) HYPR-LR–processed one-tenth dose level. Means and standard deviations of CT numbers at a selected ROI (arrow) in the back muscles are also shown. The highlighted renal contour is the region of the renal cortex.
TAC Findings
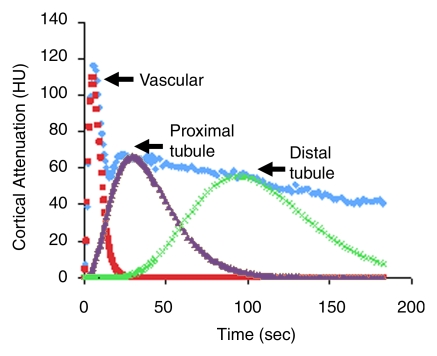
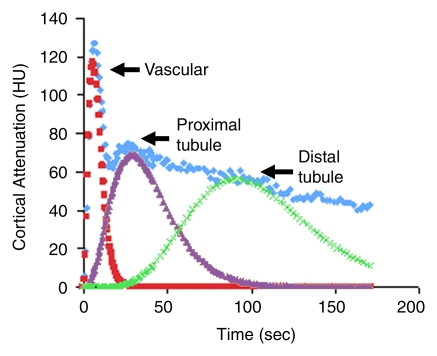
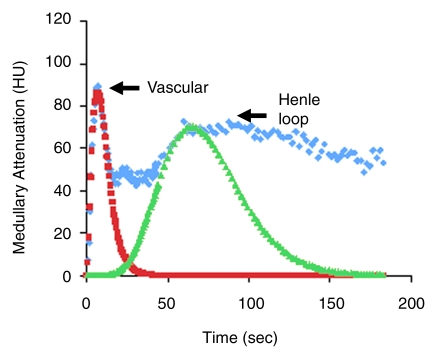
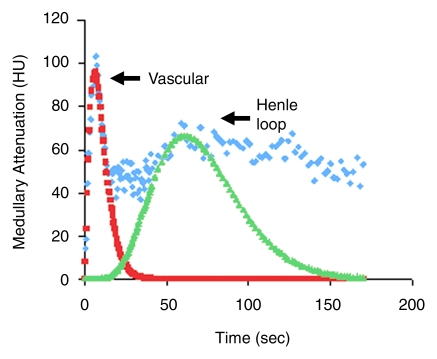
In the renal cortical TAC, three sequential peaks represented displacement of the contrast material bolus along the cortical vascular compartment, proximal tubule, and distal tubule (Fig 2), as inferred from the timing, sequence, and location of the peaks. The medullary TAC (Fig 2) exhibited two peaks, corresponding to the transit of the contrast material in the blood vessels, followed by tubular fluid arrival via the loop of Henle. TACs obtained with the routine dose and the one-tenth dose HYPR-LR–processed images were qualitatively similar in shape.
Figure 2a:
Representative cortical TACs obtained in one pig by using (a) the routine radiation dose level and (b) the one-tenth dose level with HYPR-LR processing. The renal cortical TAC exhibited three sequential peaks, representing displacement of the contrast material bolus along the cortical vascular compartment, proximal tubule, and distal tubule, as inferred from the timing, sequence, and location of the peaks. TACs obtained with the routine dose images and the one-tenth dose HYPR-LR–processed images were qualitatively similar in shape.
Figure 2b:
Representative cortical TACs obtained in one pig by using (a) the routine radiation dose level and (b) the one-tenth dose level with HYPR-LR processing. The renal cortical TAC exhibited three sequential peaks, representing displacement of the contrast material bolus along the cortical vascular compartment, proximal tubule, and distal tubule, as inferred from the timing, sequence, and location of the peaks. TACs obtained with the routine dose images and the one-tenth dose HYPR-LR–processed images were qualitatively similar in shape.
Renal Hemodynamics
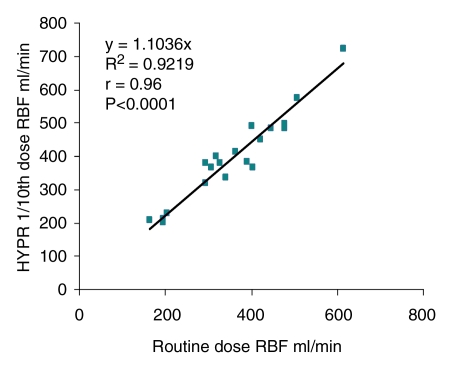
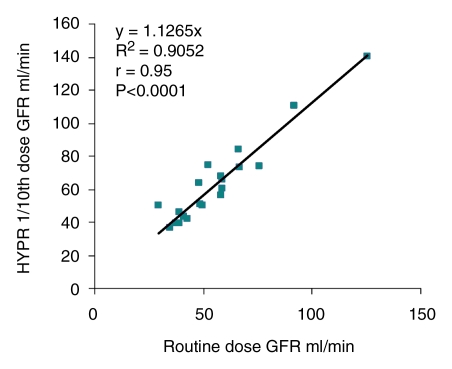
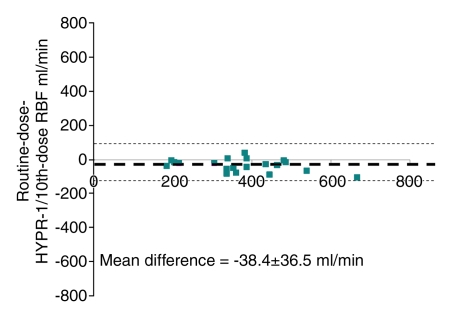
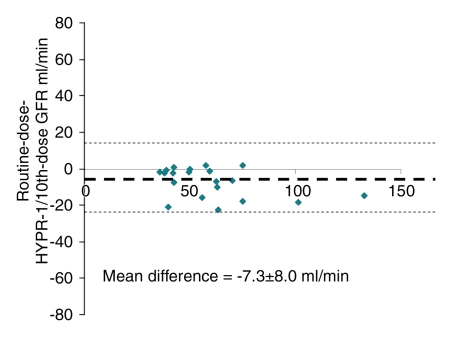
The quantitative values of single-kidney perfusion, RBF, and GFR obtained with the routine dose level, the one-tenth dose level, and the one-tenth dose level with HYPR-LR processing were similar (Table 1). The paired t test analysis (Table 2) showed that there was no statistically significant difference between the routine dose and the one-tenth dose data, while some values were slightly but statistically significantly higher with the one-tenth dose HYPR-LR processed data. Nevertheless, further analysis showed that the RBF and GFR values obtained with the routine dose level and those obtained with the HYPR-LR processed one-tenth dose level were significantly correlated (R2 = 0.92 and R2 = 0.91, respectively), and the slopes were close to 1 (Fig 3). The corresponding Pearson product-moment correlation coefficients (r values) were 0.96 (P < .0001) and 0.95 (P < .0001), respectively. Bland-Altman plots showed good agreement between the routine dose level and the HYPR-LR–processed one-tenth dose level for all the parameters, with slight overestimation with HYPR-LR (Fig 4).
Table 1.
Renal Hemodynamic and Function Measurements Obtained in Pigs with Routine Dose, One-Tenth Dose, and One-Tenth Dose HYPR-LR–Processed 64-Section Multidetector CT Images

Note.—Data are means ± standard deviations.
* In 20 kidneys.
† Obtained with 80 kV and 160 mAs.
‡ Obtained with 80 kV and 16 mAs.
Table 2.
Results of Paired Two-tailed t Test for Comparison of Swine Renal Hemodynamic and Function Measurements Obtained with Routine Dose, One-Tenth Dose, and One-Tenth Dose HYPR-LR–Processed 64-Section Multidetector CT Images

Note.—Data are P values. A Bonferroni adjustment was performed (α = .0167 [ie, .05/3]). P < .0167 indicates a statistically significant difference.
* In 20 kidneys.
Figure 3a:
Representative medullary TACs obtained in one pig by using (a) the routine dose level and (b) the one-tenth dose level with HYPR-LR processing. The medullary TAC exhibited two peaks, corresponding to the transit of the contrast material in the blood vessels, followed by tubular fluid arrival via the loop of Henle. TACs obtained with the routine dose images and the one-tenth dose HYPR-LR–processed images were qualitatively similar in shape.
Figure 3b:
Representative medullary TACs obtained in one pig by using (a) the routine dose level and (b) the one-tenth dose level with HYPR-LR processing. The medullary TAC exhibited two peaks, corresponding to the transit of the contrast material in the blood vessels, followed by tubular fluid arrival via the loop of Henle. TACs obtained with the routine dose images and the one-tenth dose HYPR-LR–processed images were qualitatively similar in shape.
Figure 4a:
(a, b) Correlation and (c, d) Bland-Altman plots describe the relationship between the routine dose and the one-tenth dose HYPR-LR–processed images. The CT values of (a, c) RBF and (b, d) GFR were obtained in basal conditions. In c and d, dotted line = mean difference, and dashed lines = 2 standard deviations of the mean.
Figure 4b:
(a, b) Correlation and (c, d) Bland-Altman plots describe the relationship between the routine dose and the one-tenth dose HYPR-LR–processed images. The CT values of (a, c) RBF and (b, d) GFR were obtained in basal conditions. In c and d, dotted line = mean difference, and dashed lines = 2 standard deviations of the mean.
Figure 4c:
(a, b) Correlation and (c, d) Bland-Altman plots describe the relationship between the routine dose and the one-tenth dose HYPR-LR–processed images. The CT values of (a, c) RBF and (b, d) GFR were obtained in basal conditions. In c and d, dotted line = mean difference, and dashed lines = 2 standard deviations of the mean.
Figure 4d:
(a, b) Correlation and (c, d) Bland-Altman plots describe the relationship between the routine dose and the one-tenth dose HYPR-LR–processed images. The CT values of (a, c) RBF and (b, d) GFR were obtained in basal conditions. In c and d, dotted line = mean difference, and dashed lines = 2 standard deviations of the mean.
Discussion
Despite the high level of noise in images obtained with the one-tenth radiation dose, we observed that cortical perfusion assessments obtained with the one-tenth dose were similar to those obtained with the routine dose, and the two correlated significantly. Medullary perfusion, RBF, and GFR assessments were not statistically different between the one-tenth dose and the routine dose data. This fact could be explained by the strong iodine attenuation signal in the highly perfused kidney, which was much higher than the noise level in the images obtained with the one-tenth dose. Notably, the parameters (cortical perfusion, medullary perfusion, RBF, GFR) obtained with the one-tenth dose were slightly higher than the parameters obtained with the routine dose. Because we performed the two perfusion studies consecutively (15 minutes apart), the small difference between the one-tenth dose and the routine dose may be due to intrinsic and physiologic rather than technical factors.
Although we could acquire good quantitative information from the noisy images obtained with the one-tenth dose, improved image quality would be helpful in many ways. For example, the visual appreciation of anatomic structures in images obtained with the routine dose was much better than that in the noisy images. Images with less noise also show much clearer organ boundaries, which is helpful when studying smaller ROIs. Therefore, noise-reducing algorithms are highly desirable. Different from conventional noise-reducing techniques, such as low-pass filtering, edge-preserving algorithms, HYPR-LR can preserve high spatial resolution with minimum computation cost by using the spatial-temporal correlation between the images. Our study demonstrates that the noise in the images obtained with the one-tenth dose could be greatly reduced by using the HYPR-LR algorithm without loss of quantitative accuracy. A simple background SNR calculation shows that the image quality of the noisy images could be improved to nearly the same level of the routine dose images by using HYPR-LR. Quantitative assessments of cortical perfusion, RBF, and GFR were slightly higher with the one-tenth dose with HYPR-LR processing data compared with the routine dose data and the one-tenth dose without HYPR-LR processing data, while values obtained with the latter data were largely similar to those obtained with the routine dose data (with the exception of GFR). The reason for the slight overestimation of renal function with the one-tenth dose with HYPR-LR processing data is unclear and will need to be investigated in further studies. Nevertheless, the differences were small and likely not hemodynamically meaningful, and linear regression and Bland-Altman analyses showed that the parameters obtained with the one-tenth dose with HYPR-LR processing were strongly correlated with the parameters obtained with the other two methods.
One limitation of our study was that the kidney motion caused by breathing was artificially reduced by suspension of the animal's respiration. The animals received assisted ventilation approximately twice during the 3-minute scans. With human perfusion studies, motion of the perfused organs could be a problem. In particular, the accuracy of the HYPR-LR algorithm may be degraded if there is substantial motion during the scan process. In that situation, image registration would need to be performed first, wherever kidney motion occurs, prior to HYPR-LR processing, or specific scan sequences designed to circumvent this artifact would need to be performed.
The other limitation was that no animals with decreased perfusion were examined. A contrast material bolus dose of 0.3–0.5 mL/kg is often used in CT measurements of cardiac or renal perfusion in humans with both normal and reduced perfusion (11–13). In our experiment, the contrast material bolus was about 37.5 mL for a 75-kg pig, which corresponds to 0.5 mL/kg and was thus a typical contrast material bolus for a perfusion study. With a reduced contrast material bolus, the measurements would still be accurate as long as the amount of contrast material in the studied perfused organ is sufficient to provide strong enhancement of the CT numbers. However, the TAC measurements with the one-tenth dose images may not be accurate for a poorly perfused organ (eg, a very sick kidney) because of the poor contrast-to-noise ratio. In this situation, it is expected that the substantial noise reduction achieved by using HYPR-LR will improve the contrast-to-noise ratio and provide more obvious benefit than in the current study.
In addition, the order of the studies was not randomized. While this might have contributed to slight overestimation of renal function with HYPR-LR, considering the fact that the one-tenth dose image acquisition sequence (on which the HYPR-LR processing was based) yielded functional parameters similar to those of the routine dose acquisition, other technical HYPR-LR–related issues were more likely involved.
We also note that the data analyses in our study were performed on the basis of only a single section. In fact, the HYPR-LR noise-reduction method can also be applied to entire volume measurements. New technologic advances in CT (eg, wider detector coverage, periodic spiral scans) make it possible to perform perfusion CT for an entire organ. Thus, HYPR-LR can play an important role in whole-organ perfusion measurement in future studies.
Practical application:
Multidetector CT combines minimal invasiveness with tomographic capability, which enables the study of both single-kidney and regional renal function with wider availability, greater technical flexibility, and superior spatial resolution than those achievable with nonradiation methods such as electromagnetic flow probe and intravascular Doppler wire techniques. Newer-generation multidetector CT scanners provide an opportunity for clinical CT perfusion studies with higher spatial and temporal resolution. In particular, the accuracy and reproducibility of multidetector CT measurements of renal perfusion, tubular function, and myocardial perfusion have been demonstrated in animal studies (14,16).
However, concerns regarding radiation exposure have hindered useful multidetector CT perfusion imaging in human studies. Our study demonstrates the feasibility of obtaining minimally invasive quantitative measurements of in vivo renal hemodynamics and function by using multidetector CT with a 10-fold lower radiation dose. This may facilitate integration of such studies into clinical practice. It should be noted that a dual-source multidetector CT system was used in our study, but the method would be equally applicable to single-source multidetector CT systems.
In conclusion, in an animal model, a 10-fold radiation dose reduction is possible for abdominal CT perfusion imaging, especially in highly perfused organs such as the kidneys, where there is strong iodine attenuation signal. Our study demonstrates the feasibility of obtaining noninvasive measurements of in vivo renal hemodynamics and function by using one-tenth the typical dose used for renal perfusion CT imaging. The image quality of the one-tenth dose image, which was severely degraded by quantum noise, could be improved markedly to nearly the same level of the routine dose images by using the HYPR-LR noise-reduction algorithm, without substantial loss of quantitative accuracy. These results may have important clinical implications, as the HYPR-LR–processed one-tenth dose level approach may facilitate application of this method for measurements of renal hemodynamics and function in vivo in humans.
Advance in Knowledge.
By using a highly constrained back-projection–local reconstruction noise-reduction algorithm, the feasibility of in vivo quantitation of renal hemodynamics and function by using one-tenth of the radiation dose typically used at renal perfusion CT was demonstrated.
Implications for Patient Care.
Our study results may lead to in vivo assessment CT perfusion imaging for measurement of renal hemodynamics and function in humans.
Our study results also may facilitate CT myocardial perfusion studies in vivo in humans.
Supplementary Material
Acknowledgments
The authors thank Charles A. Mistretta, PhD, for his assistance with the use of the HYPR algorithm. The authors are also grateful to Diane R. Eaker, MS, for her help handling CT images and to Kristina Nunez, BA, BS, for her assistance with manuscript preparation.
Received September 19, 2008; revision requested November 11; revision received February 23, 2009; accepted March 19; final version accepted April 29.
A.N.P. and C.H.M. supported by Siemens Healthcare.
Funding: This research was supported by the National Institutes of Health (grants R01EB007986, RR-18898, HL085307, and DK73608).
Abbreviations:
- GFR
- glomerular filtration rate
- HYPR
- highly constrained back projection
- LR
- local reconstruction
- RBF
- renal blood flow
- ROI
- region of interest
- SNR
- signal-to-noise ratio
- TAC
- time-attenuation curve
References
- 1.Dugdale PE, Miles KA, Bunce I, Kelley BB, Leggett DA. CT measurement of perfusion and permeability within lymphoma masses and its ability to assess grade, activity, and chemotherapeutic response. J Comput Assist Tomogr 1999;23:540–547 [DOI] [PubMed] [Google Scholar]
- 2.Ng QS, Goh V, Fichte H, et al. Lung cancer perfusion at multi-detector row CT: reproducibility of whole tumor quantitative measurements. Radiology 2006;239:547–553 [DOI] [PubMed] [Google Scholar]
- 3.Patlak CS, Blasberg RG, Fenstermacher JD. Graphical evaluation of blood-to-brain transfer constants from multiple-time uptake data. J Cereb Blood Flow Metab 1983;3:1–7 [DOI] [PubMed] [Google Scholar]
- 4.Klotz E, Konig M. Perfusion measurements of the brain: using dynamic CT for the quantitative assessment of cerebral ischemia in acute stroke. Eur J Radiol 1999;30:170–184 [DOI] [PubMed] [Google Scholar]
- 5.Miles KA, Hayball M, Dixon AK. Color perfusion imaging: a new application of computed tomography. Lancet 1991;337:643–645 [DOI] [PubMed] [Google Scholar]
- 6.Fournier LS, Cuenod CA, Bazelaire CD, et al. Early modifications of hepatic perfusion measured by functional CT in a rat model of hepatocellular carcinoma using a blood pool contrast agent. Eur Radiol 2004;14:2125–2133 [DOI] [PubMed] [Google Scholar]
- 7.Laghi A. Multidetector CT (64 slices) of the liver: examination techniques. Eur Radiol 2007;17:675–683 [DOI] [PubMed] [Google Scholar]
- 8.Mistretta CA, Wieben O, Velikina J, et al. Highly constrained backprojection for time-resolved MRI. Magn Reson Med 2006;55:30–40 [DOI] [PMC free article] [PubMed] [Google Scholar]
- 9.Johnson KM, Velikina J, Wu Y, Kecskemeti S, Wieben O, Mistretta CA. Improved waveform fidelity using local HYPR reconstruction (HYPR LR). Magn Reson Med 2008;59:456–462 [DOI] [PMC free article] [PubMed] [Google Scholar]
- 10.Lerman LO, Filickinger AL, Sheedy PF, Turner ST. Reproducibility of human kidney perfusion and volume determinations with electron beam computed tomography. Invest Radiol 1996;31:204–210 [DOI] [PubMed] [Google Scholar]
- 11.Lerman LO, Bell MR, Lahera V, et al. Quantification of global and regional renal blood flow with electron beam computed tomography. Am J Hypertens 1994;7:829–837 [DOI] [PubMed] [Google Scholar]
- 12.Lerman LO, Bentley MD, Bell MR, Rumberger JA, Romero JC. Quantitation of the in vivo kidney volume with cine computed tomography. Invest Radiol 1990;25:1206–1211 [DOI] [PubMed] [Google Scholar]
- 13.Lerman LO, Radriguez-Porcel M, Sheedy PF, Romero JC. Renal tubular dynamics in the intact canine kidney. Kidney Int 1996;50:1358–1362 [DOI] [PubMed] [Google Scholar]
- 14.Daghini E, Primak AN, Chade AR, et al. Assessment of renal hemodynamics and function in pigs with 64-section multidetector CT: comparison with electron-beam CT. Radiology 2007;243:405–412 [DOI] [PubMed] [Google Scholar]
- 15.Krier JD, Ritman EL, Bajzer Z, Romero JC, Lerman A, Lerman LO. Noninvasive measurement of concurrent single-kidney perfusion, glomerular filtration, and tubular function. Am J Physiol Renal Physiol 2001;281:F630–F638 [DOI] [PubMed] [Google Scholar]
- 16.Daghini E, Primak AN, Chade AR, et al. Evaluation of porcine myocardial microvascular permeability and fractional vascular volume using 64-slice helical CT. Invest Radiol 2007;42:274–282 [DOI] [PubMed] [Google Scholar]
- 17.Flohr TG, Stierstorfer K, Ulzheimer S, Bruder H, Primak AN, McCollough CH. CT image reconstruction and image quality evaluation for a 64-slice CT scanner with Z-flying focal spot. Med Phys 2005;32:2536–2547 [DOI] [PubMed] [Google Scholar]
- 18.Bauhs JA, Vrieze TJ, Primak AN, Bruesewitz MR, McCollough CH. CT dosimetry: a comparison of measurement techniques and devices. RadioGraphics 2008;28:245–253 [DOI] [PubMed] [Google Scholar]
- 19.Bushberg JT, Seibert JA, Leidholdt EM, Jr, Boone JM. The essential physics of medical imaging Baltimore, Md: Williams & Wilkins, 2002 [Google Scholar]
- 20.Wagner LK, Eifel PJ, Geise RA. Potential biological effects following high x-ray dose interventional procedures. J Vasc Interv Radiol 1994;5:71–84 [DOI] [PubMed] [Google Scholar]
- 21.Liu X, Primak AN, Yu L, et al. Quantitative evaluation of noise reduction algorithms for very low dose renal CT perfusion imaging. In: Samei E, Hsieh J, eds. Proceedings of SPIE: medical imaging 2009—physics of medical imaging. Vol 7258 Bellingham, Wash: SPIE–The International Society for Optical Engineering, 2009;7258–7264 [Google Scholar]
- 22.Bland JM, Altman DG. Statistical methods for assessing agreement between two methods of clinical measurement. Lancet 1986;1:307–310 [PubMed] [Google Scholar]
Associated Data
This section collects any data citations, data availability statements, or supplementary materials included in this article.


