


Abstract
Projector was designed for automatic positioning of contigs from an unfinished prokaryotic genome onto a template genome of a closely related strain or species. Projector mapped 84 contigs of Lactococcus lactis MG1363 (corresponding to 81% of the assembly nucleotides) against the genome of L.lactis IL1403. Ninety three percent of subsequent gap closure PCRs were successful. Moreover, a significant improvement in the N50 and N80 values (describing the assembly quality) was observed after the use of Projector. Because increasing numbers of bacterial genomes are being sequenced, Projector provides an efficient method to close a significant number of remaining gaps in the late stages of a genome sequencing project.
INTRODUCTION
Genome sequences emerge in ever-increasing numbers. As of June 2003, 112 finished and 128 unfinished microbial genomes have been reported in the NCBI genome database (http://www.ncbi.nlm.nih.gov/). These numbers exclude genomes that were sequenced by private companies.
A consortium consisting of the Microbiology Department of University College (Cork, Ireland), the Institute of Food Research (Norwich, UK) and the Molecular Genetics Department of the University of Groningen (Groningen, The Netherlands) is sequencing the genome of the food-grade lactic acid bacterium Lactococcus lactis subsp. cremoris MG1363 by a random shotgun sequencing strategy (1,2). This methodology implies that under-represented clones require more sequence runs, which in turn leads to ‘over-sequencing’ of over-represented clones. In many cases clones overlap, yielding enlarged sequences (contigs) that are scattered over different parts of the genome. In order to position these contigs with respect to each other the scaffolding technique can be used. Smaller contigs are linked according to their position on larger DNA fragments (large insert genomic library, for instance in phage and cosmid banks or bacterial artificial chromosomes) of which only the ends are sequenced.
Other types of linkage information might be obtained by using mapping by microarray analysis (3), restriction fingerprints of large insert genomic clones (4) or the so-called ‘slalom libraries’ (5). The gaps between these linked contigs are closed by subsequent PCR strategies. When these methods are exhausted, physical gaps between contigs or scaffolds remain. These are closed by, for example, inverse PCR, anchored PCR or multiplex PCR (6). The above-mentioned procedure results in an average coverage of a genome of about 8-fold, making sequencing of a genome rather expensive and time consuming.
A significant reduction in time and costs of a sequencing project could be realized by using primer pairs in specific PCRs. This would require prior knowledge about the position and orientation of the contigs on the genome. The fact that relatedness between organisms frequently results in structural conservation of genomic regions (7,8) and in conservation within genes might aid in the positioning of contigs. Because quite a number of genomes have been sequenced and even more genomes are in an unfinished stage, the chances increase of matching an unfinished genome sequence with a finished genome sequence that is comparable in structure and nucleotide sequence. PGAAS (9) was developed to identify contigs that end in the same open reading frame (ORF). Its use is limited because (i) in many cases contigs end with repetitive elements rendering this method inadequate and (ii) in only a very few cases do two contigs end in the same ORF. The genome alignment tool MUMmer (10,11) may also be used to obtain additional contig linkage information. Because of the algorithm used, in some cases contigs are positioned at several places on the genome, requiring contig mappings to be inspected manually.
The Projector software was developed to provide an automated method to efficiently use information from increasing numbers of finished genomes for ‘smart’ gap closure by PCR. The Projector software uses a finished genome sequence (template genome) of comparable nucleotide sequence and structure as a template to position and orient contigs of an unfinished genome sequence (target genome). The positioned contigs allow prediction of sequence gap locations and sizes. Projector was tested by positioning Lactococcus lactis MG1363 contigs (target) on the genome of L.lactis IL1403 (template). Over 90% success rate was obtained in PCRs for 83 gap-closing primer pairs suggested by Projector. Projector also successfully mapped significant numbers of contigs from unfinished genome sequences from various other bacteria. We show that by using a more similar template genome, the probability that contigs of the target genome are successfully mapped increases significantly.
MATERIALS AND METHODS
System requirements
Projector runs on a Linux platform and only requires a locally installed Blastall program (ftp://ftp.ncbi.nih.gov/blast/). The version of Blastall used in this study was 2.2.3. Projector consists of eight sub-programs written in Pascal and compiled by FreePascal 1.0.6 (http://www.freepascal.org/) under Red Hat Linux release 7.2 (http://www.redhat.com). The sub-programs are linked by a shell script. All relevant Projector settings can be entered in this shell script. The system on which Projector was tested was a dual Intel Pentium III 667 Mhz with 2 Gb RAM memory. Projector had modest computer requirements for all runs: a typical mapping run took ∼7–10 min using at most 30 Mb of physical RAM memory. Blast searches took ∼6 min and the Projector sub-programs ∼30 s to run. In general, the files used by the Projector sub-programs are either of the FASTA type or of comma-delimited text file format. By using these file types, the output of each step can be checked manually if need be by using, for example, Microsoft Excel.
Mapping procedure
A typical Projector run is presented in Figure 1. The file types and purposes for each Projector sub-program (step) are listed in Table 1 (steps a–g). The complete mapping procedure consists of the following eight steps. (a) Preprocessing of the template genome (Fig. 1A): a GenBank (.gbk) file containing the template genome sequence and the ORF designations is converted into Projector file format. This file in Projector FASTA format, containing the extracted template ORFs, is subsequently processed by the formatdb program (ftp://ftp.ncbi.nih.gov/blast/) to create a Blastn compliant file index, which can be used in step c. (b) Fragmenting contigs (Fig. 1B): the contigs that are to be mapped against the template ORFs are fragmented into sequences with a length chosen by the user (in this study 300 bp was used, which was empirically determined to be the optimal size yielding the largest number of mapped contigs and the lowest number of incorrect mappings). The fragmented sequences are divided into ‘left’ (L) and ‘right’ (R) sequences. If the remaining center part of a contig is larger than the minimum size (selected by the user; in this study 300 bp was used) for use for contig mapping, it is used entirely in subsequent mapping steps. If a contig is smaller than the selected cut-off or too small to extract L and R fragments (in this study 1500 bp was used) as well as the center part, it is omitted from the Projector procedure. The reason for omitting small contigs from the mapping procedure is that small contigs are often based on low quality single sequence reads or repetitive sequences. (c) Blast search (Fig. 1C): the fragmented contigs are compared to the template ORFs using Blastn. Optionally, the user can select a cut-off expectancy value (e-value) to reduce the size of the blast output. (d) Blast result filtering (Fig. 1D): blast results are filtered and written as a Projector-specific comma-delimited file format. Again, the user can select a cut-off expectancy value (e-value) to reduce the size of the filtered blast output. (e) Mapping (Fig. 1E): for each contig, the Blastn results of all L fragments are compared to those of all R fragments. The only strict rule of Projector is that the L and R fragments mapped on the template genome must have the same orientation. The user has to provide Projector with a maximum difference of the spacing between the mapped positions of both the L and R fragments on the template genome and the original positions of L and R on the contig. The maximum difference between both spacings can be either in nucleotides or in percentage of the contig size. In the latter case, the maximum spacing difference is calculated for each contig separately. In this study 40% spacing difference was used. In addition, the user has to provide a cut-off e-value for the aligned L and R fragments (in this study 1 × e–8 was used). The blast e-values of both L and R fragments have to be better (lower) than the cut-off e-value. The spacing between both L and R fragments on the contig (which size is considered to be the ‘true’ size) is compared to the spacing between the mapped positions on the template genome of both L and R fragments (which size should be as close as possible to the ‘true’ spacing to reduce the number of incorrect mappings due to genomic rearrangements). If the difference between both spacings is larger than the difference of spacing maximally allowed, the combination of both L and R fragments are not considered to be a ‘best match’. All combinations of L and R fragments meeting the above mentioned criteria are compared. The combination with the smallest spacing difference between the positions of both fragments on the contig and on the template genome is selected as the ‘best match’. If no combination of L and R fragments satisfying the criteria is found, the center fragment (if present) is considered. A successful mapping of the center fragment is only based on the cut-off e-value (in this study 1 × e–8 was used). Finally, the user has various options to select alternative mappings. These alternatives may be selected on the basis of e-values higher than the cut-off e-value and/or spacing larger than the maximally allowed spacing difference. (f) Sorting mapped contigs (Fig. 1F): mapped contigs are sorted by position (counted from the origin of replication). (g) Generation of primer design-ready DNA sequences (Fig. 1G): DNA sequences of the ends of two neighboring contigs are extracted in the ‘preGenomePrimer’ step. With these DNA regions (the user may select the number of base pairs of the contig ends used for primer design; in this study 250 bp was used), primer design can be performed by, for example, GenomePrimer (12). With the resulting facing primer pairs, a successful PCR will yield a product that closes the gap between both neighboring contigs. Because ends of contigs may contain low quality nucleotide sequence data, the user can select whether to discard a certain number of nucleotides from the ends of the contigs (in this study 100 bp were discarded from the contig ends). (h) Creating a graphic representation of the mapped contigs (Fig. 1H): a scalable vector graphics (svg) (http://www.w3.org/Graphics/SVG/Overview.html) file is created containing the template ORF positions and the mapped contig positions. The map can be inspected by opening the svg file with a web browser (for system requirements see http://www.adobe.com/svg/systemreqs.html). The positions of the L and R fragments used for mapping of the contig are indicated. Specific information is shown for: (i) the template ORF, its name and position on the genome; (ii) the target contig, contig (or scaffold) name, the mapped position, size and the projected size; and (iii) the contig fragment used for mapping of the contig, the name of the homologous template ORF and the expectancy value. The visual representation of the map can be customized by using different arrow sizes, line thicknesses, scales and specific markings of certain ORFs (for instance repetitive elements) of the template genome.
Figure 1.
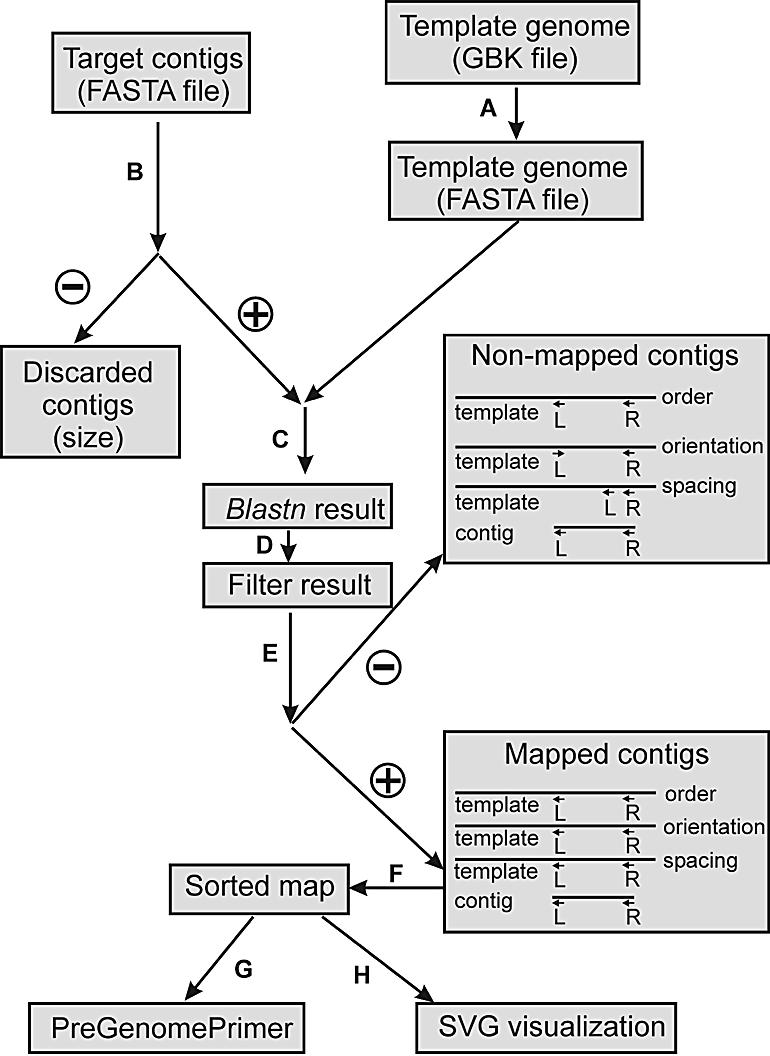
Flow chart of a Projector contig mapping run. For details see text.
Table 1. Steps involved in a typical contig mapping run of Projector.
| Step | Description | Input file | Output file | ||
|---|---|---|---|---|---|
| Format | Content | Format | Content | ||
| a | gbk2project | gbk | template genome sequence | fasta | template ORFs |
| formatdb | fasta | template ORFs | blast database | template ORFs | |
| b | chopcontig | fasta | target contigs | fasta | target contig fragments |
| c | blastn | fasta | target contig fragments (step b) | blast format | blast results |
| blast database | template ORFs (step a) | ||||
| d | blast filter | blast format | blast results (step c) | csva | blast results |
| e | map | csva | filtered blast results (step d) | csva | (alternative) mapped contigs |
| f | sort | csva | sorted mapped contigs (step e) | csva | mapped contigs sorted on position |
| g | preprimer design | csva | sorted mapped contigs (step e) | csva | gap closure primer-design templates |
| h | svg visualization | csva | sorted mapped contigs (step e) | svgb | visualization of mapped contigs |
For each step, the formats and contents of the input and output files are described.
aComma-delimited file format; can be imported in, for instance, Microsoft Excel.
bScalable vector graphics, viewable in an Internet web browser.
PCR conditions
PCRs were performed with the Extensor Hi-Fidelity PCR Enzyme Mix (AB-Gene, Epsom, UK) according to the manufacturer’s instructions using an iCycler Thermal Cycler (Bio-Rad Laboratories, Hercules, CA). Lactococcus lactis MG1363 chromosomal DNA was used as template (end concentration 6 ng µl–1).
Genome comparisons
All ORFs of a template genome were compared against the contigs of a target genome using the Blastn program. The number of ORFs giving a hit below the selected cutoff e-value (1 × e–50) divided by the total number of ORFs in the template genome results in an arbitrary value describing the similarity of the template genome to the target genome. This arbitrary value also depends on the completeness of the target genome contigs.
Software availability
Projector is available for educational and research purposes by non-profit institutions at http://molgen.biol.rug.nl/molgen/research/molgensoftware.php.
Sources of genome sequence data
Unfinished genomic sequences were obtained from the US DOE Joint Genome Institute (http://www.jgi.doe.gov). Finished genome sequences were obtained from the NCBI genome database (http://www.ncbi.nlm.nih.gov/).
RESULTS
Mapping of several target genomes
Prior to testing Projector on several freely available target genomes, the software was tested by using L.lactis IL1403 ORFs as both target (each ORF is a contig) and template sets. All IL1403 ORFs that were not discarded, were mapped at their proper positions on the IL1403 genome. Projector was tested on seven target (unfinished) genome sequences (Table 2). Many target contigs are relatively small, resulting in high numbers of contigs being discarded based on their size (results not shown). Except in the case of Clostridium thermocellum, more than 70% of the nucleotides in the organism assembly were in mapped contigs. The significant numbers of contigs that result in ‘no hit’ (Table 2) indicate that many target contigs are strain specific. The median predicted gap sizes range from 500 bp to >7 kb. The percentage of predicted gaps that might be closed in one PCR (∼15 kb maximum) ranges from 60 to almost 90. In the case of L.lactis MG1363 and L.lactis SK11 target genomes, mapping on an IL1403 template genome from which repetitive elements had been removed (repeat-masked) resulted in a reduction in the percentage of nucleotides mapped by five and four, respectively. The number of contigs that were mapped at overlapping positions decreased significantly when repeat-masked sequences were used (results not shown).
Table 2. Mapping results of some unfinished genomes against similar finished genomes.
| Genome origin | Contigs | Nucleotides (kb) in contigs | Gaps | ||||||
|---|---|---|---|---|---|---|---|---|---|
| Target genomea | Template genomeb | Total | Mapped | No hitc | Total | Mapped | Mapped (%)d | Median size | PCR (%)e |
| 1. P.fluorescens | P.aeruginosa | 316 | 137 | 31 | 6473 | 5216 | 81 | 7002 | 65 |
| 2. P.fluorescens | P.putida | 316 | 131 | 24 | 6473 | 4963 | 77 | 6838 | 59 |
| 3. L.lactis SK11 | L.lactis IL1403 | 132 | 90 | 14 | 2613 | 2505 | 96 | 5543 | 70 |
| 4. L.lactis SK11 | L.lactis IL1403f | 132 | 83 | 18 | 2613 | 2365 | 91 | 5860 | 66 |
| 5. L.lactis MG1363 | L.lactis IL1403 | 210 | 89 | 11 | 2457 | 2085 | 85 | 3196 | 84 |
| 6. L.lactis MG1363 | L.lactis IL1403f | 210 | 84 | 15 | 2457 | 1982 | 81 | 2467 | 88 |
| 7. X.oleander | X.fastidosa | 154 | 100 | 3 | 2675 | 2560 | 96 | 813 | 87 |
| 8. X.almond | X.fastidosa | 333 | 185 | 8 | 2595 | 2515 | 97 | 586 | 67 |
| 9. B.longum DJ010A | B.longum NCC2705 | 120 | 55 | 4 | 2375 | 2304 | 97 | 7357 | 65 |
| C.thermocellum | C.perfringens | 469 | 1 | 182 | 3654 | 1 | 0 | – | – |
aUnfinished (target) genomes are from: Bifidobacterium longum DJ010A, Clostridium thermocellum ATCC 27405, Pseudomonas fluorescens PfO-1, Xylella fastidosa oleander-Ann1, Xylella fastidosa almond-dixon.
bFinished (template) genomes are from: Bifobacterium longum NCC2705, Clostridium perfringens 13, Pseudomonas aeruginosa PA01, Pseudomonas putida KT2440, Xylella fastidiosa.
cNone of the DNA sequence fragments extracted from the contigs resulted in a significant Blast hit.
dPercentage mapped nucleotides is calculated by: (total nucleotides in assembly)/(number of nucleotides in mapped contigs).
ePercentage of all mapped contigs with predicted gap sizes (<15 kb) that might be closed in one PCR using the standard primer pair suggested by Projector.
fMapping was performed on a repeat-masked template genome.
Correlating genomic relatedness with mapping success
Comparing the genomic content of different bacteria is an important but difficult task and many software packages have been developed to do so (13–16). These software packages give a lot of information on genomic relatedness, but it is difficult to generate a single quality value for a genomic comparison. In order to obtain a rough estimate of the relatedness of two genomes, a simple methodology, similar to that used in Projector, was applied. For all target genomes used in this study, an estimate was made of the percentage of template ORFs present in the respective target contigs.
A similarity of 70% was calculated between the target L.lactis MG1363 contigs and the ORFs of the template L.lactis IL1403, which corresponds to the earlier reported similarity of 70–98% (17). A correlation between similarity values obtained for all bacteria (except C.thermocellum) and the percentage of nucleotides present in mapped contigs (Table 2) is given in Figure 2. Apparently, at a low percentage of similarity (20–30%) between target and template genomes a substantial number (over 70%) of the assembled nucleotides are in mapped contigs (Fig. 2, both cases of Pseudomonas fluorescens). In the case of C.thermocellum no similarity was observed between the target and template (Clostridium perfringens) genomes, resulting in only one mapped contig with low confidence (1 × e–11; Table 2).
Figure 2.

Contig mapping success plotted against the similarity between target and template sequences. The numbers identifying data points correspond to the numbers preceding the target genome names in Table 2.
Mapping of L.lactis MG1363 and gap closing PCR results
Figure 3 shows an example output (svg format) of the L.lactis MG1363 target genome mapped on a repeat-masked L.lactis IL1403 template genome. Lactococcus lactis MG1363 contigs that were mapped at overlapping positions on the template genome were omitted from the mapping procedure when the L and R fragments were also mapped at overlapping positions on the template genome. These mapping optimizations are easy and fast to implement because the whole mapping procedure takes <7 min while omitting contigs from the mapping procedure requires editing of one file only. In some cases (for instance from 448 to 480 kb; Fig. 3A), for example repetitive elements or prophages, it could be decided not to show template ORFs in the mapping output (Fig. 3A). In Figure 3B, an example is shown of four mapped contigs resulting in very small gap sizes. From this mapping it is evident that the target contigs are mapped against almost all positions of the template genome (Fig. 3A). Based on this mapping only two gaps >30 kb remain (Fig. 3A; positions 1.033–1.067 and 1.402–1.445 Mb). Contigs were sometimes observed with overlapping mapped positions (Fig. 3B and C) even though the fragments used to map both contigs did not map at overlapping positions. Blast searches with the overlapping contig sequence (overhang) against the template DNA sequence revealed no significant hits. Probably, these contig ‘overhangs’ represent an insertion in the target genome that is not present in the template genome. Conversely, positions where no contig could be mapped might represent either deletions in the target genome compared to the template genome or a sequence in the target genome that is still missing in the contig assembly.
Figure 3.

Visual output of a Projector run. Lactococcus lactis MG1363 contigs were mapped on repeat-masked L.lactis IL1403 ORFs. Template ORFs are indicated by brown-green arrowheads located directly beneath the scale (which is in nucleotides). The mapped target contigs are indicated by red arrows. The fragments (usually two) responsible for positioning of the target contig on the template genome are indicated by small green bars of which the sizes are proportional to the fragment size selected by the user. The graphic representation of contigs mapped at overlapping positions on the template genome was improved by displaying these mapped contigs in five lines beneath the template ORFs arrowheads.
Projector was used to map L.lactis MG1363 contigs on a repeat-masked IL1403 genome (Table 2, sixth entry). Contigs <1500 bp were omitted from the mapping procedure to prevent incorrect mappings due to repetitive and/or low-quality sequences. From the 83 PCRs that were performed using gap-closing PCR primer pairs suggested by Projector and GenomePrimer, 77 PCR products were obtained (93% success), with sizes ranging from 300 bp to 15 kb (the primer sequences, projected gap sizes, PCR product sizes and the first round sequencing results are listed in Supplementary Material, Table S3). From these 77 PCR products, 31 had sizes that were different from the projected gap sizes. The reasons underlying these deviations are outlined above. From the first sequencing round performed on the 77 PCR products, 18 contigs ‘fit’ in 15 (partially) sequenced gaps (Supplementary Material, Table S3).
The N50 and N80 values are often used to assess the quality of a sequence assembly. The N50 (N80) value describes a contig size at which 50% (80%) of the assembled nucleotides are in contigs of sizes larger than this value. Before the use of Projector, the N50 and N80 values were 39 and 14 kb, respectively. Because sequencing of the gap-closing PCR products is underway, the assembly after use of Projector is not yet finished. By conservatively only taking into account the gap-closing PCR products that could be sequenced from both sides (61 products; Supplementary Material, Table S3), an estimate of resulting contig sizes in the (provisional) assembly after the use of Projector was made. The contig sizes after gap closure can be estimated from: (i) the original contig sizes; (ii) the sizes of the gap-closing PCR products; (iii) their overlaps with flanking contigs (yielding an estimate for the actual gap size). From this provisional assembly the (likely underestimated) N50 and N80 values were 349 and 44 kb, respectively.
DISCUSSION
The Projector software was developed to automatically and reliably link contigs by using information of already sequenced genomes. Because many sequencing projects are confidential, Projector was developed as a ‘stand-alone’ software package, as opposed to software that use web interfaces. From Table 2 it is clear that the number of contigs in unfinished genomes can amount to up to at least 300. This large number of contigs per genome stresses the need for automated gap closing software to avoid having to position contigs manually. Using Projector has several advantages: (i) the ‘hands-on’ time is limited to ∼10 min per mapping as opposed to many hours of manual labor; (ii) mapping procedures can be highly standardized; (iii) optimization of mappings (getting rid of erroneously mapped contigs) is very easy; (iv) errors in manual mappings are avoided.
In the present study, contigs <1500 bp were considered to be ‘low quality’ and were discarded. With the underlying thought that less potential information is discarded, a contig cut-off size of 500 bp was tried in mapping procedures of L.lactis MG1363. In the resulting map, many contigs were mapped at approximately the same positions due to that these contigs contain repetitive sequences. When performing mappings, there will be a trade-off between how many contigs one wants to use for the mapping procedure and the quality (with few mappings that overlap and small gap sizes) of the resulting map. With the assumption that a number of the remaining contig sequences will ‘fit’ within gaps that are closed, the contig cut-off size has to be balanced with the percentage of gaps that can be closed in a single PCR. This assumption was in part validated by the results of the first sequencing round, where 18 remaining contigs ‘fit’ in 15 gaps (Supplementary Material, Table S3).
Projector uses the ORFs of a template genome to order contigs of a target genome. Although this methodology proved to work nicely for several prokaryotic genomes, it is not suitable for eukaryotic genomes. This is due to two major differences between prokaryotic genomes and eukaryotic genomes: (i) prokaryotic genomes consist of one circular chromosome whereas eukaryotic organisms contain several linear chromosomes; (ii) prokaryotic genomes are more ‘coding dense’ than eukaryotic genomes, e.g. often >95% of bacterial chromosomes code for proteins while the human genome contains at most 2% coding DNA.
Prokaryotic genomes contain repetitive elements or highly homologous sequences such as prophages, insertion elements and gene duplications (18). Up to 25% of the coding regions in the Bacillus subtilis genome consists of duplications (19). Omitting repetitive elements from a template DNA sequence (repeat-masking) results in less ambiguous maps in the case of L.lactis MG1363 and L.lactis SK11 (results not shown). When using the PGAAS and MUMmer software packages, it is highly recommended to repeat-mask sequences before performing the actual mapping. In the case of a small contig that ends with a repetitive element, it might be advantageous to perform the mapping on non-repeat-masked sequences. In this particular case, a successful mapping only occurs when the repetitive element is taken into account. Although it is advisable to remove repetitive elements, it is possible for Projector to perform a mapping on sequences that are not repeat-masked. The software will automatically select the contig map size that is closest to the original contig size. Only when repetitive elements that also appear elsewhere and with comparable spacing on the template genome are present on either side of a contig, it could be incorrectly mapped.
The MUMmer software package was developed as a genome comparison tool. It positions small DNA fragments (MUMs) taken from contigs on a template genome and extends them until extension is no longer possible, due to divergence in target and template sequences. Because small fragments are extended, the mapping is accurate but in some cases ambiguous. Furthermore, repetitive elements have to be filtered from the sequence data prior to using MUMmer. The recently released scaffolding software BAMBUS (http://www.tigr.org/software/bambus/) allows obtaining additional contig linking information by using MUMmer. BAMBUS does not have the possibility to automatically suggest gap closure primer pairs. In addition, in some cases scattering of contigs occurs, which results in ambiguous mappings. If that is the case, the correct contig linkage information has to be obtained manually, which is difficult because of lack of information on the mapped size of the contig on the template genome compared to the actual contig size.
The aim of PGAAS is to aid in closing gaps between contigs that end within the same ORF (9). The methodology used in PGAAS differs from that used in Projector because PGAAS attempts to position two ends from two contigs on one ORF. In Projector, the two ends within one contig must map on a template sequence with certain spacing: the mapped contig size must resemble the actual contig size as much as possible. As the authors of PGAAS state, it is imperative that the genome does not contain gene duplications or orthologous genes as otherwise two contigs could be erroneously linked. In the final stages of an assembly it is often observed that a large number of contigs end with repetitive sequences (from, for example, phages, rRNAs or IS elements; this was also the case for the L.lactis MG1363 contigs), meaning that these ends cannot be used by the PGAAS methodology.
Construction of a large insert genomic bank of the AT-rich organism L.lactis MG1363 proved to be problematic. In the case where it is difficult to obtain additional linkage information by using large insert banks, Projector might prove to be very efficient. It was successful in projecting 84 contigs (consisting of 81% of the assembled nucleotides) from L.lactis MG1363 contigs present in the end phase of the genome sequencing project. The mapped contigs on the L.lactis IL1403 template genome were accurately positioned because 93% of the gap-bridging PCRs with primers suggested by Projector and GenomePrimer were successful. Moreover, a marked improvement in the N50 and N80 values was observed after the use of Projector. Even if large insert genome banks were successfully used in a genome sequencing project, it is very probable that at a minimum of time and cost involved, a significant amount of the remaining gaps could be closed by using Projector.
Mappings of Xylella oleander and Xylella almond contigs on Xylella fastidosa (over 90% of the nucleotides were in mapped contigs with a median gap size of <1 kb; Table 2) were even more successful compared to those of L.lactis MG1363 (81% of the nucleotides in mapped contigs with a median gap size of ∼3 kb; Table 2). The correlation between mapping success and genomic relatedness (Fig. 2) indicates that by using a more similar template genome even better gap-closing PCR results could be obtained. The chance of obtaining a template genome that is similar to a genome which is being sequenced will increase with each new genome sequence being released. By using Projector routinely in future genome sequencing projects, the reduction in both time and costs may be considerable.
SUPPLEMENTARY MATERIAL
Supplementary Material is available at NAR Online.
REFERENCES
- 1.Fraser C.M. and Fleischmann,R.D. (1997) Strategies for whole microbial genome sequencing and analysis. Electrophoresis, 18, 1207–1216. [DOI] [PubMed] [Google Scholar]
- 2.Staden R., Judge,D.P. and Bonfield,J.K. (2001) Sequence assembly and finishing methods. Methods Biochem. Anal., 43, 303–322. [DOI] [PubMed] [Google Scholar]
- 3.Stjepandic D., Weinel,C., Hilbert,H., Koo,H.L., Diehl,F., Nelson,K.E., Tummler,B. and Hoheisel,J.D. (2002) The genome structure of Pseudomonas putida: high-resolution mapping and microarray analysis. Environ. Microbiol., 4, 819–823. [DOI] [PubMed] [Google Scholar]
- 4.Crowe M.L., Rana,D., Fraser,F., Bancroft,I. and Trick,M. (2002) BACFinder: genomic localisation of large insert genomic clones based on restriction fingerprinting. Nucleic Acids Res., 30, e118. [DOI] [PMC free article] [PubMed] [Google Scholar]
- 5.Zabarovska V.I., Gizatullin,R.Z., Al Amin,A.N., Podowski,R., Protopopov,A.I., Lofdahl,S., Wahlestedt,C., Winberg,G., Kashuba,V.I., Ernberg,I. et al. (2002) A new approach to genome mapping and sequencing: slalom libraries. Nucleic Acids Res., 30, e6. [DOI] [PMC free article] [PubMed] [Google Scholar]
- 6.Tettelin H., Radune,D., Kasif,S., Khouri,H. and Salzberg,S.L. (1999) Optimized multiplex PCR: efficiently closing a whole-genome shotgun sequencing project. Genomics, 62, 500–507. [DOI] [PubMed] [Google Scholar]
- 7.Romling U., Grothues,D., Heuer,T. and Tummler,B. (1992) Physical genome analysis of bacteria. Electrophoresis, 13, 626–631. [DOI] [PubMed] [Google Scholar]
- 8.Eisen J.A., Heidelberg,J.F., White,O. and Salzberg,S.L. (2000) Evidence for symmetric chromosomal inversions around the replication origin in bacteria. Genome Biol., 1, RESEARCH0011.1–011.9. [DOI] [PMC free article] [PubMed] [Google Scholar]
- 9.Yu Z., Li,T., Zhao,J. and Luo,J. (2002) PGAAS: a prokaryotic genome assembly assistant system. Bioinformatics, 18, 661–665. [DOI] [PubMed] [Google Scholar]
- 10.Delcher A.L., Phillippy,A., Carlton,J. and Salzberg,S.L. (2002) Fast algorithms for large-scale genome alignment and comparison. Nucleic Acids Res., 30, 2478–2483. [DOI] [PMC free article] [PubMed] [Google Scholar]
- 11.Delcher A.L., Kasif,S., Fleischmann,R.D., Peterson,J., White,O. and Salzberg,S.L. (1999) Alignment of whole genomes. Nucleic Acids Res., 27, 2369–2376. [DOI] [PMC free article] [PubMed] [Google Scholar]
- 12.van Hijum S.A.F.T., de Jong,A., Buist,G., Kok,J. and Kuipers,O.P. (2003) Unifrag and GenomePrimer: selection of primers for genome-wide production of unique amplicons. Bioinformatics, 19, 1580–1582. [DOI] [PubMed] [Google Scholar]
- 13.Thomas J.W. and Touchman,J.W. (2002) Vertebrate genome sequencing: building a backbone for comparative genomics. Trends Genet., 18, 104–108. [DOI] [PubMed] [Google Scholar]
- 14.Couronne O., Poliakov,A., Bray,N., Ishkhanov,T., Ryaboy,D., Rubin,E., Pachter,L. and Dubchak,I. (2003) Strategies and tools for whole-genome alignments. Genome Res., 13, 73–80. [DOI] [PMC free article] [PubMed] [Google Scholar]
- 15.Bray N., Dubchak,I. and Pachter,L. (2003) AVID: a global alignment program. Genome Res., 13, 97–102. [DOI] [PMC free article] [PubMed] [Google Scholar]
- 16.Hohl M., Kurtz,S. and Ohlebusch,E. (2002) Efficient multiple genome alignment. Bioinformatics, 18, S312–S320. [DOI] [PubMed] [Google Scholar]
- 17.Campo N., Dias,M.J., Daveran-Mingot,M.L., Ritzenthaler,P. and Le Bourgeois,P. (2002) Genome plasticity in Lactococcus lactis. Antonie Van Leeuwenhoek, 82, 123–132. [PubMed] [Google Scholar]
- 18.Yanai I., Camacho,C.J. and DeLisi,C. (2000) Predictions of gene family distributions in microbial genomes: evolution by gene duplication and modification. Phys. Rev. Lett., 85, 2641–2644. [DOI] [PubMed] [Google Scholar]
- 19.Kunst F., Ogasawara,N., Moszer,I., Albertini,A.M., Alloni,G., Azevedo,V., Bertero,M.G., Bessieres,P., Bolotin,A., Borchert,S. et al. (1997) The complete genome sequence of the gram-positive bacterium Bacillus subtilis. Nature, 390, 249–256. [DOI] [PubMed] [Google Scholar]
Associated Data
This section collects any data citations, data availability statements, or supplementary materials included in this article.