Abstract
Deinococcus radiodurans exhibits an extraordinary resistance to the effects of exposure to ionizing radiation (IR). DdrB is one of five proteins induced to high levels in Deinococcus following extreme IR exposure and that play a demonstrable role in genome reconstitution. Although homology is limited, DdrB is a bacterial single-stranded DNA-binding protein. DdrB features a stable core with a putative OB-fold, and a C-terminal segment with properties consistent with other bacterial SSBs. In solution, the protein functions as a pentamer. The protein binds single-stranded DNA but not duplex DNA. Electron microscopy and assays with two RecA proteins provide further structural and functional identification with bacterial SSB. Overall, the results establish DdrB as the prototype of a new bacterial SSB family. Given the role of SSB as a mobilization scaffold for many processes in DNA metabolism, the induction of an alternative and quite novel SSB following irradiation has potentially broad significance for the organization of genome reconstitution functions.
When first discovered in the 1950s, the bacterium Deinococcus radiodurans surprised biologists with its extraordinary capacity to survive the effects of ionizing radiation (IR)2 (1, 2). Whereas 2 Gray (Gy) represents a lethal dose of ionizing radiation for a human, and a few hundred Gy will kill most bacteria, Deinococcus can survive a dose of 5000 Gy with no lethality. Several dozen bacterial species are now known that display similar extreme resistance to ionizing radiation (2). However, Deinococcus remains the beneficiary of most research to date.
Published evidence argues that both passive and active mechanisms protect D. radiodurans from ionizing radiation-induced DNA damage. Several proposals have been put forward. Radiation resistance might involve the highly condensed and toroidal form of the Deinococcus nucleoid (3, 4). However, a broader survey of radiation-resistant bacterial species did not find a good correlation between radiation resistance and nucleoid structure (5). Radioresistance correlates with the cell's capacity to limit protein oxidation (6–8). D. radiodurans and other radioresistant species have been shown to have high ratios of intracellular manganese relative to iron ions, and the elevated ratio correlates with lower levels of protein oxidation post-irradiation, with the higher levels of manganese ion acting as a scavenger of oxygen radicals generated during irradiation (6–8). Specialized or enhanced mechanisms of DNA repair may also play a role in IR resistance.
After exposure to high levels of γ radiation, genome repair in Deinococcus proceeds in two phases. The first phase is independent of the key recombinational protein RecA. Repair in phase 1 does rely on DNA polymerase A (9), a homolog of the Escherichia coli DNA polymerase I. Knockouts of the gene encoding DrPolA render the cell very sensitive to ionizing radiation, more than almost any alteration besides a recA gene inactivation. A repair pathway has been proposed for phase 1 by Radman and colleagues (9), called extended synthesis-dependent strand annealing. Much of this first phase involves the nuclease-mediated exposure of long single strand extensions at the end of chromosomal fragments, and bringing multiple fragments together by means of simple annealing of the single strands. Replication and ligation processes play a major role in generating ever larger chromosomal constructs. This first phase makes use of a number of novel proteins that are induced to high levels by exposure to large doses of ionizing radiation. The second phase of genome reconstitution follows closely and relies on RecA.
The proteins induced in Deinococcus upon exposure to IR have been studied using microarray-based transcriptome analyses (10, 11). Five novel proteins, called DdrA, DdrB, DdrC, DdrD, and PprA, stand out in this analysis. All are induced to high levels, and all possess a documented role in genome reconstitution (10, 11). The ddrA gene encodes a distant homologue of the eukaryotic Rad52 protein (12, 13). The DdrA protein binds to the 3′-ends of single DNA strands and protects them from nuclease degradation (12, 13). The PprA protein is a distant homologue of the human XRCC5 protein. PprA binds to the ends of duplex DNA and stimulates DNA ligation (14). No function has been assigned to the DdrB, DdrC, and DdrD proteins, and careful searches of protein and gene databases provide no clues. All appear to function in a RecA-independent process (11), making them likely participants in the first phase of Deinococcus genome reconstitution.
Single-stranded DNA-binding proteins are key components of any process in DNA metabolism. Bacterial SSB proteins interact, through their highly conserved C termini, with a multitude of proteins that function in DNA metabolism (15, 16). The SSB proteins effectively act as scaffolds upon which processes in DNA metabolism are organized. In the present study, we focus on the DdrB protein. We report that DdrB is an alternative SSB protein, part of a new bacterial SSB family.
EXPERIMENTAL PROCEDURES
Enzymes and Biochemicals
Restriction endonucleases were purchased from New England Biolabs. Unless specified, other enzymes and chemicals were obtained from Fisher Scientific.
Sequence Analysis Programs
Sequences were retrieved from the GenBankTM data base and aligned using the ClustalW algorithm (17) through the JALview 2.4 alignment editor (18).
Expression and Purification of Native DdrB
The gene coding for the DR0070 protein, as indicated in GenBankTM, was amplified by PCR using primers 0070us and 0070ds from D. radiodurans R1 genomic DNA. The resulting product was inserted into the NdeI and the HindIII cloning sites of pET21a (Novagen) to yield construct pEAW296. The construct was transformed into four E. coli expression strains: STL2669 pT7pol26 (Δ(recA-srlR)306::Tn10 xonA2(sbcB-), a gift from Susan T. Lovett (Brandeis University, Waltham, MA)); pT7pol26, described in Lusetti et al. (22); BL21 (DE3) (Stratagene) and EAW68 (an E. coli K-12 strain in which seven nuclease genes have been altered by addition of His tags)3; and Rosetta strain (Novagen). Detectable expression was observed only with the Rosetta strain. This expressed protein was purified and characterized.4 Mass spectrometry analysis (time of flight mass spectrometry ES+ performed at the University of Wisconsin Biotechnology Center, Madison) of the protein indicated it corresponded to an N-terminal 11-amino acid DdrB truncation product. The corresponding sequence of that truncation product was PCR amplified from pEAW296, using primers 0070ΔN11 and 0070ds, and inserted into the NdeI and the HindIII cloning sites of pET21a to yield construct pEAW571. It is of note that the corresponding protein does not contain any cysteine or internal methionine, and therefore the purification procedure does not incorporate the use of a reducing agent (i.e. dithiothreitol or β-mercaptoethanol). Construct pEAW571 was transformed into Rosetta strain. These cells were grown in 10 liters of LB broth containing 100 μg/ml ampicillin at 37 °C to an A600 nm of 0.5. Overexpression of DdrB was then induced with 0.4 mm isopropyl 1-thio-β-d-galactopyranoside (GoldBio) and grown at 37 °C for 3 more h before harvest. The 18-g cell pellet was frozen in liquid nitrogen and thawed overnight at 4 °C in 5 volumes of R buffer (20 mm Tris-Cl, 80% cations, 100 μm EDTA, and 10% w/v glycerol). All subsequent steps were performed at 4 °C. Lyzozyme (Sigma) was added to a final concentration of 0.2 mg/ml. Cells were stirred for 2 h and then sonicated on ice. Insoluble material and cell debris were pelleted and removed by centrifugation at 38,000 × g for 1 h, and the cell lysate supernatant was brought to 30% saturation of NH4(SO4)2 (MP Biochemical) by addition of solid powder. The solution was stirred 1 h and centrifuged 30 min at 25,000 × g. The pellet was discarded, and the remaining supernatant was brought to 40% saturation by additional NH4(SO4)2. The solution was stirred overnight and centrifuged 1 h at 25,000 × g. The DdrB protein remained in the pellet and was eluted from the pellet using R buffer containing 1 m NH4(SO4)2. The resuspended protein was then loaded onto a butyl-Sepharose (Amersham Biosciences) column (bed volume equivalent to volume used to resuspend the cell pellet) using an AKTA fast-protein liquid chromatography system. The DdrB protein binds to the Butyl resin, but the column was quickly saturated and most of the DdrB protein was recovered from the late flow through with an estimated 90% purity. The protein solution was then dialyzed against R buffer and loaded onto a DEAE-Sepharose (Amersham Biosciences) column. Unexpectedly, the DdrB protein bound to the resin despite an estimated pI of 8.9. The protein was eluted over a 10-column volume gradient going from R buffer to R buffer containing 1 m KCl. DdrB completed elution before the KCl concentration reached 200 mm. The protein was again dialyzed against R buffer, loaded onto an SP-Sepharose (Amersham Biosciences) column, and eluted over a 10-column volume gradient going from R buffer to R buffer containing 1 m KCl. The DdrB protein again was fully eluted before the buffer reached 200 mm KCl. Fractions containing >99% pure protein (as estimated from SDS-PAGE) were pooled, dialyzed against R buffer, aliquoted, snap frozen in liquid nitrogen, and stored at −80 °C. The purified protein was free of any detectable nuclease activity.
Extinction Coefficient Determination
The native extinction coefficient for DdrB was determined as described in a previous study (19). Three determinations at three different concentrations of DdrB gave an average extinction coefficient of ϵ280 = (2.65 ± 0.12) × 104 m−1cm−1.
Western Blot
Wild-type (strain R1) and ΔddrB (strain TNK102 (11)) D. radiodurans cells were grown in TGY2× medium (described in Ref. 20) to an A600 nm of 1.5 and pelleted. Half of the cells were then irradiated on ice for 540 min at 7.4 Gy/min (total dose of 4000 Gy) in a Mark I (J. L. Shepherd) 137CsCl irradiator. The other half was left on ice next to the irradiator. The cell were then allowed to recover for 3 h in fresh TGY2× medium, pelleted again, and frozen at −80 °C until use. Cells were lysed by addition of 1 volume of Laemmli cracking buffer and boiling for 5 min at 100 °C and loaded onto two 17% SDS-PAGE gels. The two gels were run together at 200 V for 2 h. One of the gels was stained with Coomassie Brilliant Blue R250, and the other one was transferred onto an Immobilon polyvinylidene difluoride membrane (Millipore) using standard procedures. The membrane was blocked with phosphate-buffered saline-Tween containing 5% milk and incubated 2 h at 21 °C with a chicken anti-DdrB polyclonal IgY antibody (GeneTel Laboratories, LLC, Madison, WI). After extensive washes in phosphate-buffered saline-Tween, the membrane was incubated with rabbit anti-chicken IgG coupled with horseradish peroxidase (Sigma), washed again, and revealed using a SuperSignal West Pico kit (Thermo Scientific).
Analytical Ultracentrifugation
To prepare samples for sedimentation equilibrium 100 μl of frozen stock DdrB was dialyzed four times for 2 h against 20 mm Tris-Cl, 80% cation (pH ∼ 7.8), 100 mm KCl at 4 °C. The protein concentration of the resulting sample was 154 μm. The final dialysate was used to dilute aliquots of this stock to concentrations of 24.12 μm, 11.99 μm,and 5.85 μm. 100 μl of each sample was placed in 12-mm double-sector charcoal-filled Epon centerpieces with ∼110 μl of the final dialysate as reference. Centrifugation was performed at 25 °C in a Beckman model XL-A analytical ultracentrifuge. The protein gradients were recorded every 2–3 h until they became superimposable. Equilibrium data were recorded at 279 nm for speeds of 3,600, 6,300, 8,700, 12,000, and 18,000 rpm in that sequence. Non-sedimenting absorbance in each sample was determined by high speed (36000 rpm) depletion at the end of the run and was <0.014 for all samples. The dialysate density at 25 °C was calculated as 1.00243. The partial specific volume was calculated from DdrB composition as 0.728 ml/g. The data from the three samples at five speeds were globally tested against models of a single and two species. Programs for analysis were written in Igor Pro (Wavemetrics Inc.) by Darrell R. McCaslin.
Native Molecular Weight Determination by Gel Filtration
DdrB native molecular weight was approximated by gel filtration fast-protein liquid chromatography on an AKTA system. A Sephacryl S-300 16/60 HR gel filtration column (Amersham Biosciences) was used at a flow rate of 0.5 ml/min of a buffer containing 20 mm Tris-Cl, 80% cation, 100 μm EDTA, 100 mm KCl, and 10% w/v glycerol at 4 °C (final pH 7.8). The column was calibrated using Sigma Gel Filtration Molecular Weight Markers: blue dextran (2000 kDa), apoferritin (443 kDa), β-amylase (200 kDa), bovine serum albumin (66 kDa), carbonic anhydrase (29 kDa), and cytochrome c (12.4 kDa). The blue dextran and carbonic anhydrase were run first; the other standards were run together in a separate run, both in a final volume of 500 μl at the concentration recommended by the manufacturer. Approximately 3.6 mg of DdrB in 500 μl were loaded in an independent run. The elution volume of blue dextran determined the void volume (Vo), and the total volume (Vt) was determined according to the dimensions of the column. The peak elution volumes (Ve) were calculated from the chromatogram, and fractional retentions, Kav, were calculated using the equation: Kav = (Ve − Vo)/(Vt − Vo). A standard curve was determined by plotting the Kav of the protein standards against the log10 molecular weight of the standards. The obtained curve regression analysis had an R2 of 0.9989. The molecular weight of DdrB was approximated by comparing its Kav value to the standard curve.
Limited Proteolysis of DdrB
To perform limited proteolysis, 1 mg/ml (48 μm) DdrB was digested by 2 μg/ml (74 nm) subtilisin (Sigma) in 20 mm Tris-Cl, 80% cation, 150 mm NaCl, 1 mm EDTA, and 1 mm dithiothreitol (final pH = 7.8). Reactions were set at 21 °C for times ranging from 0 to 120 min and quenched by addition of phenylmethylsulfonyl fluoride (Calbiochem) to a final concentration of 1 mm. Phenylmethylsulfonyl fluoride was added before the protease for the initial time point. The samples were then analyzed on a 17% SDS-PAGE gel. Part of the sample digested for 5 min was also analyzed by mass spectrometry using ESI-QTrap for precise mass determination of the corresponding polypeptides.
Electrophoretic Mobility Shift Assay
Fluorescent (5′-6FAM, OCN324) and standard (OCN325) 50-mer DNA or fluorescent 20-mer RNA (5′-6FAM, OCN345) oligonucleotides were ordered from IDT (Integrated DNA Technologies Inc.). The double-stranded DNA was obtained by annealing 10 μm OCN324 with 10 μm complementary oligonucleotide OCN325 in 20 mm Tris, 80% cation, 50 mm NaCl, 1 mm EDTA after heating to 90 °C and slow cooling to room temperature. 50 μm (in nucleotides) of the oligonucleotides was incubated with various concentrations of DdrB ranging from 10 nm to 10 μm in 50 mm Tris-Cl, 80% cation (pH 7.8), 5 mm MgCl2, 20 mm KCl, and 3% glycerol for 10 min at 37 °C (Table 1). The samples were then run on a 4% native PAGE for 2 h at 150 V at 4 °C. The positions of the fluorescent oligonucleotides were analyzed using a Typhoon scanner (Amersham Biosciences).
TABLE 1.
Oligonucleotides used in this study
Fluorescent oligonucleotides are indicated by an F- and contain a 5′ 6-FAM (6-carboxyfluorescein).
| Name | 5′ to 3′ sequence |
|---|---|
| 0070 us | GGAAGAGCATATGTGTTATGTTATTTACGTAAGGAGGAGGCAGATG |
| 0070ds | CCAAGCTTTTAGAACGGCGTTTCTTCTTCCTGACCGGGCTG |
| 0070N11 | CCATATGCATATGCTGCAGATTGAATTTATCACCGACCTGG |
| OCN324 | F-TGCCTCGCGGTAGCTCTTCTCGGAGCGCACGATTCGCACTGCTGATGTTC |
| OCN325 | GAACATCAGCAGTGCGAATCGTGCGCTCCGAGAAGAGCTACCGCGAGGCA |
| OCN345 | (RNA) F-UGCCUCGCGGUAGCUCUUCU |
Electron Microscopy
Carbon films, mounted on 400-mesh electron microscopy grids, were first activated by a brief glow-discharge treatment (21). Activated grids were used immediately for spreading. Samples for electron microscopy were prepared by mixing DNA and the protein (either DdrB, E. coli SSB or D. radiodurans SSB). The experiment consisted of a 10-min preincubation with either 0.6 μm DdrB and 6 μm nucleotides M13mp18 circular single-stranded DNA (protein 1/10th concentration of nucleotides) at 30 °C, or 1 μm EcSSB and 10 μm nucleotides M13mp18 circular single-stranded DNA (protein 1/10th concentration of nucleotides) at 37 °C, or 0.5 μm DrSSB and 10 μm nucleotides M13mp18 circular single-stranded DNA (protein 1/20th concentration of nucleotides) at 37 °C. The reaction mixture described above having the DdrB protein and the DNA was diluted 8 times with 150 mm NaCl, 10 mm Hepes 33% anion, and 10% glycerol (final pH 7.5). The reaction mixtures having EcSSB and DNA and the one having DrSSB and the DNA were spread undiluted.
An 8-μl drop of each sample was immediately adsorbed to the activated carbon film for 3 min. The grid was then touched to a drop of 150 mm NaCl, 10 mm Hepes 33% anion, and 10% glycerol (final pH 7.5) followed by floating on a fresh drop of the same for 1 min. The sample was stained by touching to a drop of 5% uranyl acetate followed by floating on a fresh drop of the same solution for 30 s. Finally, the grid was washed by touching to a drop of double distilled water followed by immersion in two 10-ml beakers of double distilled water. After the sample was dried, it was rotary shadowed with platinum. This protocol is designed for visualization of complete reaction mixtures, and no attempt was made to remove unreacted material. Although this approach should yield results that give a true insight into reaction components, it does lead to samples with a high background of unbound proteins. The DNA molecules bound by proteins were compared at an identical magnification for each sample. Imaging and photography were carried out with a TECNAI G2 12 Twin Electron Microscope (FEI Co.) equipped with a GATAN 890 charge-coupled device camera. Digital images of the nucleoprotein filaments were taken at 67,000× magnification.
ATPase Assays
The E. coli and D. radiodurans RecA proteins were purified as described in a previous study (22), D. radiodurans SSB was purified as described before (23), and E. coli SSB was purified as described (24). The RecA ATPase reactions were made in 25 mm Tris acetate 91% cation (pH 7.5), 5% glycerol, 3 mm potassium glutamate, 10 mm magnesium acetate, 1 mm dithiothreitol (GoldBio), and 5 μm (as total nucleotides) circular ssDNA from bacteriophage M13mp18 (7229 nucleotides) prepared as described in a previous study (25). The reaction mixtures also contained an ATP regeneration system comprising 3 mm phospho(enol)pyruvic acid (Sigma), 1.5 mm NADH (Sigma), 10 units/ml pyruvate kinase (Sigma), and 10 units/ml of l-lactic dehydrogenase (Sigma). Where indicated, EcRecA and DrRecA were added at a concentration of 3 μm. ATP (Sigma) at 3 mm was used to initiates the reactions. EcSSB, DrSSB, and DdrB were added at a concentration of 0.5 μm. The reactions were carried out at 37 °C and monitored by measuring the loss of NADH through the reading of A380 nm using a Cary Bio 300 (Varian). The kcat values were calculated using the slopes of the curves representing the micromolar amount of ATP hydrolyzed (or micromolar NADH converted to NAD+) per minute, using ranges of time points where the linear regression R2 has a value above 0.95 and assuming one RecA protein binds to three nucleotides. Each assay was at least repeated three times.
RESULTS
Re-annotation of the D. radiodurans DdrB Protein
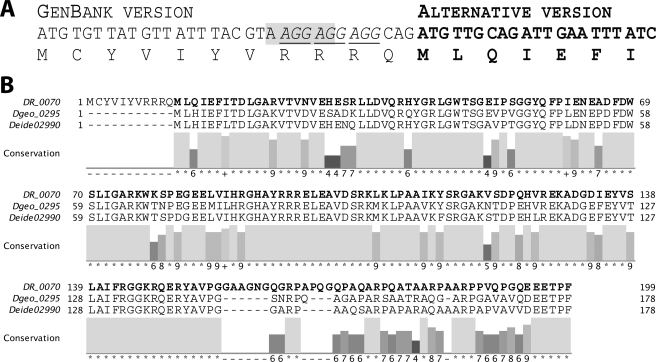
We first sought to work with the ddrB gene (D. radiodurans gene DR0070) as annotated in GenBankTM, although we were cognizant of occasional polymorphisms encountered relative to the D. radiodurans gene annotation (e.g. see Refs. 23, 26). Multiple attempts to express the DdrB protein in E. coli overexpression strains failed. Only the Rosetta strain (Novagen) permitted a minimal expression of what appeared, after purification and mass spectrometry determination, to be a truncated version of DR0070 missing the first 11 amino acids (data not shown). That truncated version was 20.8 kDa instead of the expected 22.3 kDa, and its translation began at the second methionine of DR0070. Analysis of the DR0070 gene sequence allowed the identification of a D. radiodurans ribosomal binding site, AAGGAG (27–29), at an optimal 8 nucleotides upstream the alternative initiation codon (Fig. 1A). In addition, the 11 codons prior to the possible new start codon include three repetitions of the very rare E. coli arginine codon AGG, leading to the stalling of most translation events in E. coli. A BLAST search against public databases, using DdrB as the query, allowed the identification of only two proteins with significant similarity to DR0070: Dgeo0295 from Deinococcus geothermalis and Deide02990 from Deinococcus deserti, exhibiting 72 and 71% identity, respectively, with the truncated gene from D. radiodurans. Interestingly, the alignment of the proteins from the three Deinococcus species indicates that both D. geothermalis and D. deserti DdrB proteins have translation starts corresponding to the alternative (second) D. radiodurans DdrB methionine (Fig. 1B). We cloned and overexpressed the DR0070 truncated version that will be referred to as DdrB hereafter (Fig. 2A). This shorter DdrB version overexpressed extremely well in the Rosetta strain. We obtained an estimated 4 g of DdrB from 18 g of cell paste, representing 22% of cell mass. Chicken polyclonal antibodies were raised against the purified DdrB protein and used against non-irradiated and irradiated wild-type and ΔddrB D. radiodurans cell extract separated on a 17% SDS-PAGE (Fig. 2B). The Western blot revealed for the irradiated wild type a single reacting protein that shared the same size as the purified DdrB (Fig. 2C). DdrB could not be detected in the non-irradiated wild-type, as well as in the deletion strain. Put together, these data indicate that the 20.8-kDa DdrB is the actual version expressed in D. radiodurans. The corrected ddrB nucleotide sequence data reported are available in the Third Party Annotation Section of the DDBJ/EMBL/GenBankTM databases under the accession number TPA: BK006794.
FIGURE 1.
The actual D. radiodurans DdrB protein is shorter than indicated in GenBankTM. A, nucleotide sequence of ddrB showing the ribosome binding site eight nucleotides upstream of the second ATG in the annotated open reading frame. The three consecutive rare (in E. coli) arginine codons are underlined. B, alignment of the DdrB protein sequences from the three Deinococcus species sequenced to date. The actual DdrB sequence is in boldface. DR0070, D. radiodurans; Dgeo0295, D. geothermalis; and Deide02990, D. deserti. The numbers below each position are calculated by the JALview program and reflect the degree of conservation of physicochemical properties in each column; 0 denotes no conservation, 1 to 9 reflect increasing levels of conservation (high numbers reflect amino acid substitutions in the same physicochemical class), and * indicates perfect conservation.
FIGURE 2.
Expression and purification of the actual DdrB expressed in D. radiodurans. A, 12% SDS-PAGE stained with Coomassie Brilliant Blue R250, showing whole Rosetta cell extracts before (1) and after (2) 2 h of isopropyl 1-thio-β-d-galactopyranoside (0.1 mm) induction of DdrB expression from pEAW571. 3, purified DdrB. B, 17% SDS-PAGE stained with Coomassie Brilliant blue R250 presenting D. radiodurans cell extracts. 1, unirradiated TNK102 (D. radiodurans ΔddrB strain). 2, irradiated TNK102. 3, unirradiated and 4, irradiated wild-type D. radiodurans. Lane 5 is again a sample of purified DdrB protein. C, Western blot from identical gel transferred on a polyvinylidene difluoride membrane and probed using a chicken polyclonal anti-DdrB IgY antibody. For all panels, M corresponds to the Precision Plus Protein Standards (Bio-Rad) with corresponding sizes indicated in kilodaltons.
DdrB Contains the Conserved SSB C Terminus Motif That Interacts with SSB Partners
Other than the other two DdrB genes described above, from bacterial species closely related to Deinococcus, the BLAST search using DdrB as a query uncovered few significant homologies except for one. There was a notable homology (48% similarity, 24% identity) over an extended region of 127 amino acid residues between DdrB and the C-terminal domain of the DnaE protein from Aurantimonas sp. SI85-9A1. The region in which the homology occurred corresponded to the oligonucleotide/oligosaccharide-binding domain (OB-fold) of the polymerase. OB-fold domains are commonly used by proteins to bind ssDNA (30). Although the OB-fold structure is well conserved, the corresponding sequences diverge greatly between proteins and OB-folds can generally not be predicted from sequence analysis only (31). DdrB is too small to be a polymerase. However, its size, 20.8 kDa, is similar to most bacterial SSB proteins (16, 32, 33).
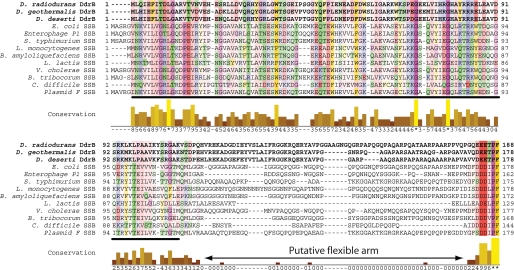
We carried out more detailed data base searches with PSI-BLAST, but did not identify additional DdrB homologues. To further examine the potential SSB relationship, we compared the sequences of the DdrB proteins encoded by the three sequenced Deinococcus species with those of various bacterial SSB proteins (Fig. 3). The alignments showed very little sequence conservation except for the last six amino acids. This conserved C terminus is significant, because this is the point of interaction between other bacterial SSBs and proteins involved in DNA metabolism. In the case of the E. coli SSB, 14 different interaction partners have been identified (15, 16). The DdrB C-terminal motif ([ED]-EETPF>) differs slightly from the common SSB motif ([DE](3)-[ILPV]-PF>). The three acidic residues are Glu in DdrB rather than the aspartate residues generally found in SSB. DdrB also includes a threonine residue where a hydrophobic residue is generally found in the SSB proteins. However the last two residues are perfectly conserved. The results reveal a relationship between the DdrB and SSB C termini, but also suggest that DdrB may have interaction partners that differ from those that presumably interact with the Deinococcus SSB protein. D. radiodurans DdrB also has a calculated pI of 8.9, differing from the typically acidic pI values for bacterial SSBs (5.59 for E. coli SSB and 5.48 for D. radiodurans SSB).
FIGURE 3.
An alignment of DdrB and bacterial SSB sequences using Clustal-W. DdrBs and SSBs exhibit very limited homology in the OB-fold domain (underlined) but share an analogous C-terminal motif ([DE](3)-X-PF>, where X is Thr in DdrB and a hydrophobic residue in SSB proteins) used by SSBs to interact with partners. The flexible arm between the OB-fold domain and the conserved C-terminal motif can be distinguished as the region of limited sequence similarity. DdrB from the three sequenced Deinococcus species were compared with a panel of bacterial SBB proteins: NP_418483 from E. coli, YP_006485 from Enterobacteria phage P1, BAB91629 from Salmonella typhimurium, CAC98260 from Listeria monocytogenes, ABS76124 from Bacillus amyloliquefaciens FZB42, AAL02359 from Lactococcus lactis subsp. cremoris, AAC72352 from Vibrio cholerae, CAK01796 from Bartonella tribocorum CIP 105476, YP_001090187 from Clostridium difficile 630, and BAA97930 from Plasmid F.
Limited Proteolysis Reveals a Stable Protein Core in DdrB Corresponding to the Putative OB Fold
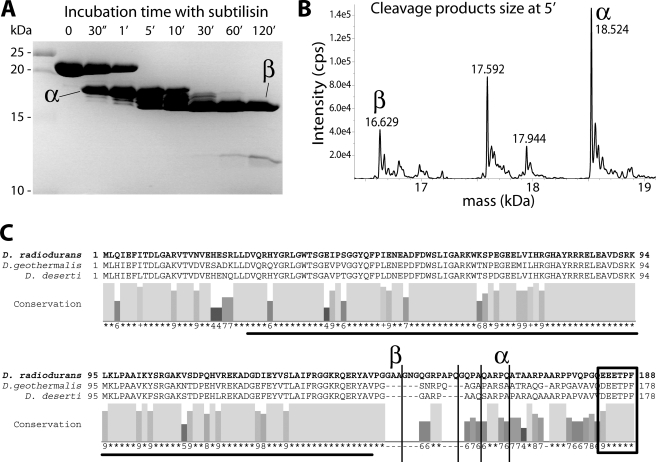
The alignment of the three DdrB proteins reveals a region between the putative OB-fold domain and the C-terminal motif that differs greatly between the three proteins (Fig. 4). The variation contrasts strikingly with the good conservation observed in the other two regions of the protein. This observation indicates the possible presence of an unstructured flexible arm linking the C terminus interaction motif to the OB-fold core domain, as is observed for the SSB proteins (34). To investigate that possibility, we performed limited proteolysis experiments. Gentle subtilisin treatments rapidly produced four similarly sized fragments with sizes ranging from 16.6 to 18.5 kDa (Fig. 4A). Mass spectrometry analysis indicated that these fragments correspond to C-terminal truncation products with cleavage sites within the putative flexible arm (Fig. 4, B and C). An initial cleavage site removes the last 20 amino acids, and further incubation with the protease removes an additional 21 amino acids. The putative OB-fold core domain was quite resistant to further proteolysis treatments. This result is similar to what has been observed for the SSB proteins, where the C-terminal tail is more readily cleaved than the OB-fold domain (35, 36), and indicates that DdrB possesses a similar structural organization.
FIGURE 4.
Limited proteolysis produces cleavage within the predicted unstructured domain, between the putative OB-fold and the C terminus motif similar to that used by SSB proteins to interact with partners. A, incubation of DdrB protein (48 μm) at room temperature with a low concentration of subtilisin (74 nm) shows the appearance over time of two main cleavage products: α, and later a species we label β that proves more resistant to the protease. B, mass spectrometry size determination, using ESI-Qtrap, allowed the identification of the exact corresponding DdrB subsequences for the products present after 5 min of incubation. C, cleavage sites (vertical lines) reported on D. radiodurans DdrB sequence (bold), aligned with DdrBs from D. geothermalis and D. deserti, showing their occurrence in the unconserved region that corresponds to a putative flexible arm between the potential OB-fold domain (underlined) and the C terminus motif (box).
DdrB Is a Pentamer
Single-stranded DNA-binding proteins (SSB/RPA) from the three domains of Life form multimeric structures exhibiting at least four OB-folds per stable oligomer (37, 38). Most bacterial SSBs are tetramers of subunits containing a single OB-fold. However, the SSBs from the Deinococcus-Thermus genera constitute an exception and form homodimers of subunits containing two OB-folds (39). To determine the oligomeric state of native DdrB in solution, the purified protein was analyzed by analytical ultracentrifugation and gel filtration.
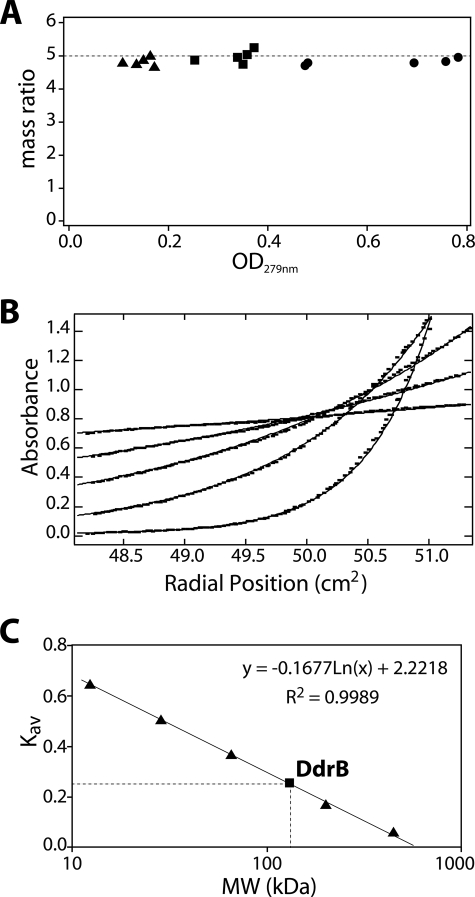
The sedimentation equilibrium data were best described as a single species. The fitting parameters gave an average molecular mass of the protein complex in solution of 98.9 kDa. Surprisingly, the apparent molecular mass at three different concentrations is consistently close to five times that of calculated monomeric protein (20.8 kDa) indicating that DdrB forms a homogeneous population of pentamers under these conditions (Fig. 5A).
FIGURE 5.
Native DdrB is a pentamer in solution. A, sedimentation equilibrium performed using analytical ultracentrifugation for three DdrB concentrations (▴, 5.85 μm; ■, 11.99 μm; and ●, 24.12 μm) at five speeds (3,600, 6,300, 8,700, 12,000, and 18,000 rpm from right to left for each concentration) indicates DdrB is consistently pentameric. The plot represents the ratio for each condition between the observed mass of the protein complex (average value of 98.9 kDa) and the mass of DdrB monomer (20.8 kDa) against the average A279 nm reading of each gradient. B, fitting of the observed sedimentation equilibrium data (squares) against a model of a single species of pentamers (lines). The best fit is obtained with a mass ratio of 4.75. Results shown are from the most concentrated sample (24.12 μm) for the five tested speeds. C, gel filtration of the globular protein standards (▴) and DdrB protein (■) on a Sephacryl S-300 HR column. Apoferritin (443 kDa), β-amylase (200 kDa), bovine serum albumin (66 kDa), carbonic anhydrase (29 kDa), and cytochrome c (12.4 kDa) were used to calibrate the column. The best-fit line was generated using the Kav of the standards against their molecular weight (MW) as represented by the equation. Native DdrB presented a Kav of 0.258, which corresponds to an apparent size of 133 kDa.
The native molecular weight was also approximated using gel filtration analysis. The purified protein displayed a symmetrical elution peak indicating the presence of a single species corresponding to a fractional retention Kav of 0.258 on our Sephacryl S-300 column (Fig. 5B). Using a standard molecular mass curve generated for the column, this value corresponds to an apparent mass of 133 kDa. The native molecular mass approximation for DdrB under these conditions is 6.38 times that of the monomer (20.8 kDa) and 1.28 times what is expected from a pentamer. Because sedimentation equilibrium results correspond to a homogeneous population of pentamers, the results from the gel-filtration column suggest that the shape of DdrB deviates from that of the globular standards used for the calibration. In the same kind of gel-filtration experiment, both EcSSB and DrSSB displayed an apparent molecular mass of 1.3 times that of their respective multimeric structure (23).
DdrB Specifically Binds to ssDNA
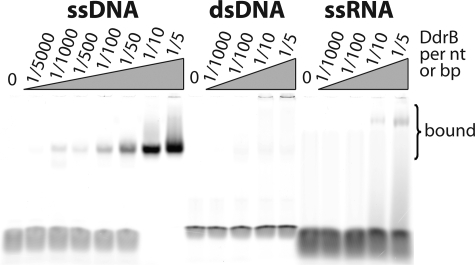
To assess whether DdrB can bind nucleic acids, we performed electrophoretic mobility shift assays using ssDNA, dsDNA, and ssRNA oligonucleotides. The ssDNA mobility was reduced by addition of DdrB at a ratio of 1 protein per 1000 nucleotides and higher, and was completely shifted at a ratio of 1 DdrB for 10 nucleotides (Fig. 6). The ssRNA and dsDNA mobility was not significantly affected by even the highest tested DdrB concentrations, indicating that DdrB specifically interacts with single-stranded DNA.
FIGURE 6.
Electrophoretic mobility shift assay indicates DdrB binds to ssDNA. Increasing concentrations of DdrB from 10 nm to 10 μm (corresponding to ratios of 1/5000 and 1/5 DdrB to total nucleotides, respectively) were incubated with 50 μm nucleotides ssDNA, dsDNA, and ssRNA fluorescent oligonucleotides (Table 1) and loaded onto a 4% native PAGE. Only the ssDNA was significantly shifted by DdrB.
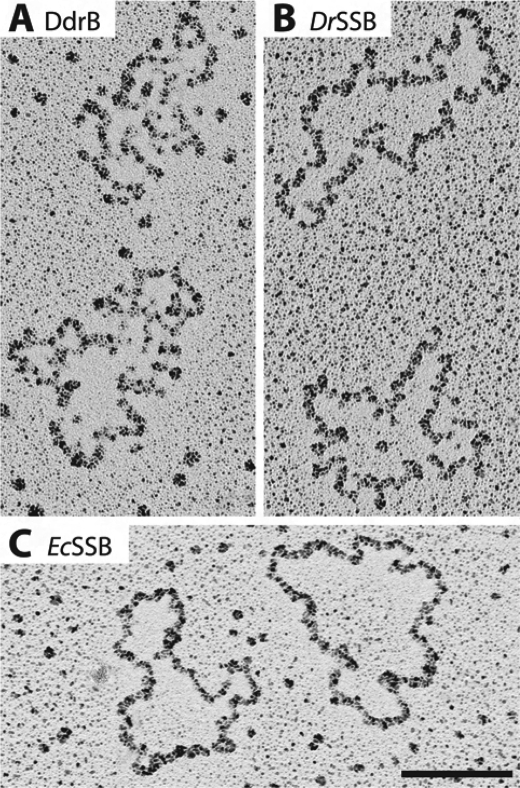
We performed electron microscopy observations to compare the ssDNA-binding configuration of DdrB with that of SSB proteins from D. radiodurans and E. coli. Similar to the SSB proteins under these conditions, DdrB binds to the ssDNA in a coating that often resembles beads on a string (Fig. 7). No partially coated DNA molecules could be observed.
FIGURE 7.
Electron microscopy. DdrB (A) coats M13mp18 circular ssDNA similarly to D. radiodurans (B) and E. coli (C) SSB proteins. For all experiments, the protein (DdrB or SSB) was preincubated with circular ssDNA and prepared for electron microscopy as described under “Experimental Procedures.” The bar represents 100 nm.
DdrB Modulates the Formation of RecA Protein Filaments
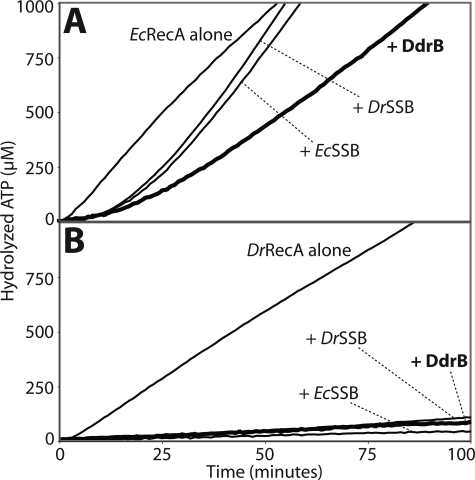
The bacterial recombinase RecA hydrolyzes ATP when it is bound to ssDNA. Thus it is possible to measure RecA binding to DNA by monitoring its ATPase activity (40, 41). Following a slow nucleation step, the length of the RecA filament depends on the dynamic equilibrium between the filament elongation on one end and RecA dissociation from the other extremity. The SSB and RecA proteins compete with each other for accessing the ssDNA. In E. coli, the interactions between the two proteins are complex, because EcSSB-coated DNA restrains the EcRecA nucleation step but facilitates the elongation of an existing EcRecA filament by removing ssDNA secondary structures. To investigate whether DdrB can affect RecA DNA binding activity similarly to the SSB proteins, we compared the effects of E. coli and D. radiodurans SSB proteins with those of DdrB on E. coli and D. radiodurans RecA ATPase activities. The effects of SSB on RecA activities are generally independent of the species of origin of the SSB. Thus, the effects represent a test of SSB-like function whether or not DdrB normally participates in a RecA-dependent process in vivo.
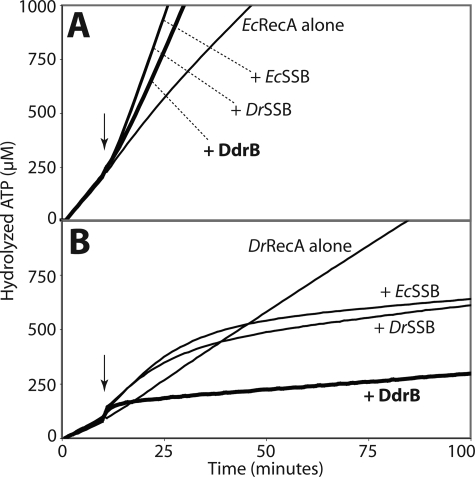
In the presence of ssDNA and ATP at 37 °C, EcRecA hydrolyzes ATP with an average kcat of 11.4 min−1 (Fig. 8A). If EcSSB or DrSSB is then added, the rate of ATP hydrolysis increases to a kcat close to 30 min−1, confirming the positive effect of the presence of SSB proteins on EcRecA filament elongation. Interestingly, in the same conditions the two SSBs had a different effect on DrRecA activity (Fig. 8B). The ATPase activity was initially increased from a kcat of 6.9 min−1 to kcat values of ∼10 min−1 after addition of EcSSB and DrSSB. But later, the ATPase activity of DrRecA is slowly reduced to a kcat of <1.2 min−1 as the DrRecA is replaced by either SSB.
FIGURE 8.
Similarly to the SSB proteins, DdrB enhances EcRecA and inhibits DrRecA ssDNA binding activities. RecA ssDNA-dependent ATPase activity, proportional to the amount of RecA bound to DNA, was monitored at 380nm to follow the loss of NADH used in the coupled ATP regeneration system. The reactions were carried out at 37 °C. 3 μm RecA protein was added first to M13mp18 circular ssDNA (5 μm nucleotides), and the reactions were initiated by the addition of 3 mm ATP. The SSB or DdrB proteins (0.5 μm each) were added 10 min after (arrow). Curves from typical experiments are represented. A, effects on E. coli RecA. The kcat of EcRecA on ssDNA alone is 11.42 ± 0.98 min−1. Addition of EcSSB and DrSSB enhanced EcRecA ATPase activity to kcat values of 30.76 ± 0.48 min−1 and 30.26 ± 1.10 min−1, respectively. Addition of DdrB had a similar but lesser effect on EcRecA yielding a kcat of 24.80 ± 0.47 min−1 (thick line). B, effects on D. radiodurans RecA. The kcat value for DrRecA alone is 6.89 ± 0.15 min−1. Addition of EcSSB or DrSSB produced an initial enhancement to kcat values of, respectively, 10.72 ± 0.36 min−1 and 9.45 ± 0.59 min−1 followed by a slow inhibition to kcat values of 0.77 ± 0.52 min−1 and 1.13 ± 0.84 min−1 with EcSSB and DrSSB, respectively. Addition of DdrB immediately decreased DrRecA ATPase activity to a kcat value of 0.59 ± 0.09 min−1 (thick line).
DdrB had essentially the same effect with both RecA proteins, enhancing the ATPase of the EcRecA and gradually inhibiting the ATPase of the DrRecA. Within these consistent patterns were quantitative differences. DdrB did not enhance ATP hydrolysis by EcRecA as much as the SSB proteins, yielding an average kcat of 24.8 min−1. After a brief increase, the inhibitory effect of DdrB on DrRecA ATPase activity was very rapid. Thus DdrB might have a stronger affinity for ssDNA than SSB, making it harder for RecA to replace it on the ssDNA. No ATP hydrolysis was observed from DdrB alone.
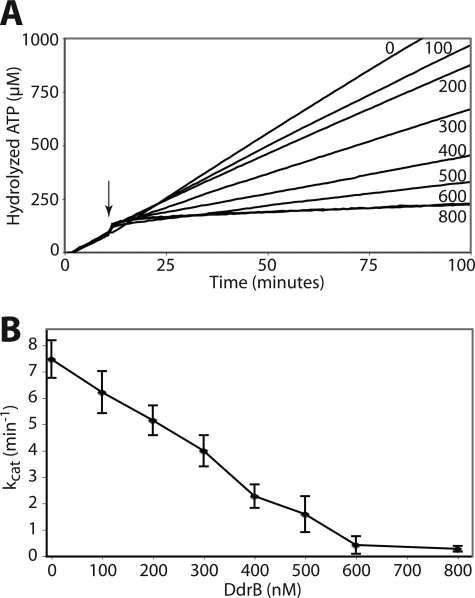
Titration of the inhibitory effect of DdrB on DrRecA ATPase activity indicated a concentration-dependent inhibition mechanism (Fig. 9). The rates of the DrRecA ATPase activity decreased proportionally to the concentration of DdrB, indicating that DdrB-coated ssDNA cannot be bound by DrRecA. However, where the SSB proteins appear to replace DrRecA after its dissociation from the ssDNA, DdrB seems to readily displace DrRecA from the ssDNA.
FIGURE 9.
DdrB inhibits DrRecA ssDNA binding in a concentration-dependent fashion. A, DrRecA ATPase reactions were carried out as described in Fig. 8. Curves from a typical experiment are represented. After 10 min, various concentrations of DdrB were added to the reaction (arrow). DdrB concentrations in nanomolar are indicated by the curves. B, loss of DrRecA binding to ssDNA (5 μm nucleotides), indicated by ATPase activity kcat values, with increasing DdrB concentrations. The error bars represent the standard deviation from three independent experiments.
When 5 μm ssDNA is present, the ATPase activity of DrRecA protein was completely suppressed when 600 nm DdrB protein was present. This indicates that DdrB saturates the ssDNA at a ratio of one DdrB monomer per 8.3 nucleotides, which corresponds to one pentamer per 42 nucleotides. This provides our first estimation of the ssDNA site binding size of the DdrB pentamer.
We also directly tested the ability of the RecA proteins to bind to SSB- or DdrB-coated ssDNA. After addition to the SSB-coated ssDNA, the EcRecA ATPase activity slowly increased to reach a kcat of 18.2 min−1 and 19.9 min−1 with EcSSB and DrSSB, respectively (Fig. 10A). On DdrB-coated ssDNA, EcRecA took longer to reach a kcat of 12.8 min−1, again suggesting that DdrB binds to ssDNA more tightly than the SSBs. As anticipated, DrRecA bound poorly to ssDNA coated by either the SSBs or DdrB, exhibiting kcat values of 1 min−1 or less (Fig. 10B).
FIGURE 10.
RecA binding to ssDNA coated by DdrB or SSB proteins. The reactions are the same as described in Fig. 8 except that SSBs or DdrB (0.5 μm each) were added first to the M13mp18 circular ssDNA (5 μm nucleotides). The RecA proteins (3 μm) and ATP (3 mm) were then added to initiate the reactions. Curves from typical experiments are represented. A, EcRecA slowly bound to SSB-coated ssDNA to reach kcat values of 18.23 ± 2.66 min−1 and 19.90 ± 2.78 min−1 with EcSSB and DrSSB, respectively (over the course of this experiment). EcRecA reached a kcat value of 12.76 ± 3.27 min−1 when ssDNA was initially bound by DdrB (thick line). B, DrRecA binding was strongly inhibited when SSB was pre-bound to ssDNA, with kcat values of 0.30 ± 0.20 min−1 and 0.75 ± 0.21 min−1 with EcSSB and DrSSB, respectively. The same result was observed when ssDNA was pre-coated by DdrB (thick line), with DrRecA reaching a kcat value of 1.04 ± 0.45 min−1.
DISCUSSION
The DdrB protein of D. radiodurans is, structurally and functionally, an SSB-like protein. The protein exhibits a stable core structure with definable homology to a known OB-fold domain. This core is attached to a relatively unstructured linker that leads to a C terminus consistent with the key properties exhibited by the bacterial SSB C termini. The DdrB protein binds specifically and tightly to ssDNA. The architecture of the DdrB-ssDNA complex revealed by electron microscopy is consistent with that exhibited by bacterial SSBs. DdrB also affects the ATPase activity of two RecA proteins with patterns similar to the effects of bacterial SSBs. We thus conclude that D. radiodurans encodes an alternative SSB protein and expresses it in response to desiccation or exposure to high doses of ionizing radiation.
Given the central role played by bacterial SSBs in organizing processes of DNA metabolism (15, 16), the presence of a new SSB during genome reconstitution could provide the cell with a unique and specific organizing center. Whereas the previously characterized D. radiodurans SSB is present and abundant during genome reconstitution (10).5 DdrB could interact with particular repair proteins, or direct the assembly of particular repair complexes. DdrB is essentially undetectable in D. radiodurans cells prior to irradiation (11) (Fig. 2C). In principle, the unique expression of DdrB during genome reconstitution could signal the presence of a novel DNA repair process.
The lack of striking sequence similarity with bacterial SSBs could reflect a long period of evolutionary divergence. Alternatively, DdrB may have arisen from an evolutionary convergence, with another protein evolving to serve the same function. Outside of the Deinococcaceae, there are no other close proteins yet present in databases. The DdrB protein may thus represent a new family of SSB proteins, so far limited to Deinococcus sp.
DdrB is the first bacterial SSB protein to exhibit a pentameric structure. A complete three-dimensional structure of the protein will be of interest. We presume that both the structure and the robust binding of the protein to ssDNA reflect its still-to-be-elucidated role in genome reconstitution.
Acknowledgments
We thank Dr. John R. Battista for providing strain TNK102 and for helpful discussions, Dr. James L. Keck for advice on the partial proteolysis experiment, and Dr. Darrell R. McCaslin for assistance with the sedimentation equilibrium study.
This work was supported, in whole or in part, by National Institutes of Health Grant GM067085.
The nucleotide sequence(s) reported in this paper has been submitted to the Gen-BankTM/EBI Data Bank with accession number(s) BK006794.
S. Saveliev and M. M. Cox, unpublished data.
- IR
- ionizing radiation
- Gy
- gray(s)
- ssDNA
- single-stranded DNA
- dsDNA
- double-stranded DNA
- ssRNA
- single-stranded RNA.
REFERENCES
- 1.Blasius M., Hüubscher U., Sommer S. (2008) Crit. Rev. Biochem. Mol. Biol. 43, 221–238 [DOI] [PubMed] [Google Scholar]
- 2.Cox M. M., Battista J. R. (2005) Nat. Rev. Microbiol. 3, 882–892 [DOI] [PubMed] [Google Scholar]
- 3.Levin-Zaidman S., Englander J., Shimoni E., Sharma A. K., Minton K. W., Minsky A. (2003) Science 299, 254–256 [DOI] [PubMed] [Google Scholar]
- 4.Frenkiel-Krispin D., Minsky A. (2006) J. Struct. Biol. 156, 311–319 [DOI] [PubMed] [Google Scholar]
- 5.Zimmerman J. M., Battista J. R. (2005) BMC Microbiol. 5, 17. [DOI] [PMC free article] [PubMed] [Google Scholar]
- 6.Daly M. J., Gaidamakova E. K., Matrosova V. Y., Vasilenko A., Zhai M., Leapman R. D., Lai B., Ravel B., Li S. M., Kemner K. M., Fredrickson J. K. (2007) PLoS Biol. 5, e92. [DOI] [PMC free article] [PubMed] [Google Scholar]
- 7.Daly M. J., Gaidamakova E. K., Matrosova V. Y., Vasilenko A., Zhai M., Venkateswaran A., Hess M., Omelchenko M. V., Kostandarithes H. M., Makarova K. S., Wackett L. P., Fredrickson J. K., Ghosal D. (2004) Science 306, 1025–1028 [DOI] [PubMed] [Google Scholar]
- 8.Fredrickson J. K., Li S. M., Gaidamakova E. K., Matrosova V. Y., Zhai M., Sulloway H. M., Scholten J. C., Brown M. G., Balkwill D. L., Daly M. J. (2008) ISME J. 2, 393–403 [DOI] [PubMed] [Google Scholar]
- 9.Zahradka K., Slade D., Bailone A., Sommer S., Averbeck D., Petranovic M., Lindner A. B., Radman M. (2006) Nature 443, 569–573 [DOI] [PubMed] [Google Scholar]
- 10.Liu Y. Q., Zhou J. Z., Omelchenko M. V., Beliaev A. S., Venkateswaran A., Stair J., Wu L., Thompson D. K., Xu D., Rogozin I. B., Gaidamakova E. K., Zhai M., Makarova K. S., Koonin E. V., Daly M. J. (2003) Proc. Natl. Acad. Sci. U.S.A. 100, 4191–4196 [DOI] [PMC free article] [PubMed] [Google Scholar]
- 11.Tanaka M., Earl A. M., Howell H. A., Park M. J., Eisen J. A., Peterson S. N., Battista J. R. (2004) Genetics 168, 21–33 [DOI] [PMC free article] [PubMed] [Google Scholar]
- 12.Harris D. R., Tanaka M., Saveliev S. V., Jolivet E., Earl A. M., Cox M. M., Battista J. R. (2004) PLoS Biol. 2, e304. [DOI] [PMC free article] [PubMed] [Google Scholar]
- 13.Gutsche I., Vujicić-Zagar A., Siebert X., Servant P., Vannier F., Castaing B., Gallet B., Heulin T., de Groot A., Sommer S., Serre L. (2008) Biochim. Biophys. Acta 1784, 1050–1058 [DOI] [PubMed] [Google Scholar]
- 14.Narumi I., Satoh K., Cui S., Funayama T., Kitayama S., Watanabe H. (2004) Mol. Microbiol. 54, 278–285 [DOI] [PubMed] [Google Scholar]
- 15.Lu D., Keck J. L. (2008) Proc. Natl. Acad. Sci. U.S.A. 105, 9169–9174 [DOI] [PMC free article] [PubMed] [Google Scholar]
- 16.Shereda R. D., Kozlov A. G., Lohman T. M., Cox M. M., Keck J. L. (2008) Crit. Rev. Biochem. Mol. Biol. 43, 289–318 [DOI] [PMC free article] [PubMed] [Google Scholar]
- 17.Thompson J. D., Higgins D. G., Gibson T. J. (1994) Nucleic Acids Res. 22, 4673–4680 [DOI] [PMC free article] [PubMed] [Google Scholar]
- 18.Waterhouse T. H., Eccleston J. A., Duffull S. B. (2009) J. Biopharm. Stat. 19, 386–402 [DOI] [PubMed] [Google Scholar]
- 19.Marrione P. E., Cox M. M. (1995) Biochemistry 34, 9809–9818 [DOI] [PubMed] [Google Scholar]
- 20.Bonacossa de Almeida C., Coste G., Sommer S., Bailone A. (2002) Mol. Genet. Genomics 268, 28–41 [DOI] [PubMed] [Google Scholar]
- 21.Grassucci R. A., Taylor D. J., Frank J. (2007) Nat. Protoc. 2, 3239–3246 [DOI] [PMC free article] [PubMed] [Google Scholar]
- 22.Lusetti S. L., Wood E. A., Fleming C. D., Modica M. J., Korth J., Abbott L., Dwyer D. W., Roca A. I., Inman R. B., Cox M. M. (2003) J. Biol. Chem. 278, 16372–16380 [DOI] [PubMed] [Google Scholar]
- 23.Eggington J. M., Haruta N., Wood E. A., Cox M. M. (2004) BMC Microbiol. 4, 2. [DOI] [PMC free article] [PubMed] [Google Scholar]
- 24.Lohman T. M., Green J. M., Beyer R. S. (1986) Biochemistry 25, 21–25 [DOI] [PubMed] [Google Scholar]
- 25.Neuendorf S. K., Cox M. M. (1986) J. Biol. Chem. 261, 8276–8282 [PubMed] [Google Scholar]
- 26.de Groot A., Dulermo R., Ortet P., Blanchard L., Guérin P., Fernandez B., Vacherie B., Dossat C., Jolivet E., Siguier P., Chandler M., Barakat M., Dedieu A., Barbe V., Heulin T., Sommer S., Achouak W., Armengaud J. (2009) PLoS Genetics 5, e1000434. [DOI] [PMC free article] [PubMed] [Google Scholar]
- 27.Ma J., Campbell A., Karlin S. (2002) J. Bacteriol. 184, 5733–5745 [DOI] [PMC free article] [PubMed] [Google Scholar]
- 28.Meima R., Lidstrom M. E. (2000) Appl. Environ. Microbiol. 66, 3856–3867 [DOI] [PMC free article] [PubMed] [Google Scholar]
- 29.Meima R., Rothfuss H. M., Gewin L., Lidstrom M. E. (2001) J. Bacteriol. 183, 3169–3175 [DOI] [PMC free article] [PubMed] [Google Scholar]
- 30.Murzin A. G. (1993) EMBO J. 12, 861–867 [DOI] [PMC free article] [PubMed] [Google Scholar]
- 31.Theobald D. L., Mitton-Fry R. M., Wuttke D. S. (2003) Annu. Rev. Biophys. Biomol. Struct. 32, 115–133 [DOI] [PMC free article] [PubMed] [Google Scholar]
- 32.Chase J. W., Williams K. R. (1986) Annu. Rev. Biochem. 55, 103–136 [DOI] [PubMed] [Google Scholar]
- 33.Lohman T. M., Ferrari M. E. (1994) Annu. Rev. Biochem. 63, 527–570 [DOI] [PubMed] [Google Scholar]
- 34.Savvides S. N., Raghunathan S., Fütterer K., Kozlov A. G., Lohman T. M., Waksman G. (2004) Protein Sci. 13, 1942–1947 [DOI] [PMC free article] [PubMed] [Google Scholar]
- 35.Williams K. R., Spicer E. K., LoPresti M. B., Guggenheimer R. A., Chase J. W. (1983) J. Biol. Chem. 258, 3346–3355 [PubMed] [Google Scholar]
- 36.Hosoda J., Moise H. (1978) J. Biol. Chem. 253, 7547–7558 [PubMed] [Google Scholar]
- 37.Raghunathan S., Kozlov A. G., Lohman T. M., Waksman G. (2000) Nat. Struct. Biol. 7, 648–652 [DOI] [PubMed] [Google Scholar]
- 38.Bochkarev A., Bochkareva E., Frappier L., Edwards A. M. (1999) EMBO J. 18, 4498–4504 [DOI] [PMC free article] [PubMed] [Google Scholar]
- 39.Bernstein D. A., Eggington J. M., Killoran M. P., Misic A. M., Cox M. M., Keck J. L. (2004) Proc. Natl. Acad. Sci. U.S.A. 101, 8575–8580 [DOI] [PMC free article] [PubMed] [Google Scholar]
- 40.Lindsley J. E., Cox M. M. (1990) J. Biol. Chem. 265, 9043–9054 [PubMed] [Google Scholar]
- 41.Morrical S. W., Lee J., Cox M. M. (1986) Biochemistry 25, 1482–1494 [DOI] [PubMed] [Google Scholar]


