Abstract
Nitric oxide (NO)-donating non-steroidal anti-inflammatory drugs (NSAIDs) represent a promising new class of drugs developed to provide a safer alternative than their conventional NSAID counterparts in chemoprevention. We tested the effects of NO-aspirin 2 on Phase I and Phase II carcinogen-metabolizing enzymes. In HepG2 human hepatoma cells and in LS180 colonic adenocarcinoma cells, NO-aspirin 2 inhibited 2,3,7,8-tetrachlordibenzo-p-dioxin (TCDD)-induced cytochrome P450 (CYP) enzyme activity and CYP1A1 and CYP1A2 mRNA expression. These effects were further characterized as being mediated through transcriptional regulation: NO-aspirin 2 inhibited binding of ligand (TCDD)-activated aryl hydrocarbon receptor to the CYP1A1 enhancer sequence; additionally, NO-aspirin 2 suppressed carcinogen-induced expression of CYP1A heterogeneous nuclear RNA. The fate of carcinogen metabolites depends not only on activation by CYP enzymes but also detoxification by Phase II enzymes. Both HepG2 and LS180 cells treated with NO-aspirin 2 showed an increase in glutathione S-transferase-P1 (GST-P1), glutamate-cysteine ligase (GCL), and NAD(P)H:quinone oxidoreductase-1 (NQO1) expression. Compared with two other NO-releasing compounds, diethylenetriamine-NO and the organic nitrate, isosorbide dinitrate, the inhibitory effects of NO-aspirin 2 on TCDD-induced CYP activity and mRNA expression were considerably more potent. Furthermore, aspirin alone had no inhibitory effect on TCDD-induced CYP activity, nor did aspirin up-regulate GCL, GST-P1, or NQO1 expression. Consequent to the effects on carcinogen-metabolizing enzymes, NO-aspirin 2 inhibited [3H]benzo[a]pyrene-DNA adduct formation and DNA damage elicited by TCDD or benzo[a]pyrene. Our results demonstrate that NO-aspirin 2 may be an effective chemopreventive agent by favorably affecting the inhibitory and enhancing effects of Phase I and Phase II carcinogen metabolism, thereby protecting DNA from carcinogenic insult.
Accumulating evidence suggests that non-steroidal anti-inflammatory drugs (NSAIDs)2 decrease the risk of developing premalignant lesions and several types of cancer (1, 2). The potential for NSAIDs to serve as chemoprotective agents has been particularly evident for colorectal cancer, as demonstrated by epidemiological and clinical studies, as well experimental animal models. Unfortunately, even at low doses, long term NSAID usage is associated with significant gastrointestinal and renal side-effects, some of which are potentially life-threatening (3, 4). In fact, in 1998, the number of deaths in the United States from NSAID complications paralleled the number of deaths from AIDS (5, 6). This has prompted the emergence of novel strategies in efforts to maintain the desired pharmacological effects of NSAIDs, while diminishing the deleterious properties. One such strategy led to the development of coxibs, selective cyclooxygenase 2 inhibitors, which, although they do in fact reduce gastrointestinal complications, are also associated with increased cardiovascular side-effects (7–9). Recent development of nitric oxide (NO)-donating NSAIDs (10) has refueled interest in utilizing this class of drugs in chemoprevention.
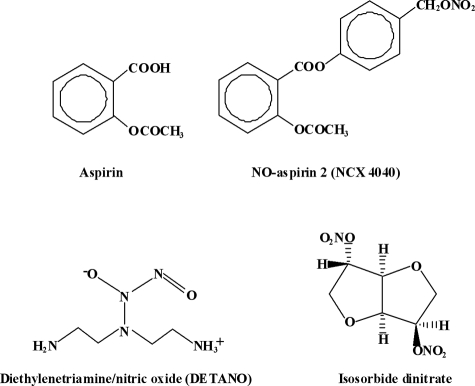
NO-NSAIDs consist of a NO-releasing moiety covalently bound to a spacer (via ester linkage), which in turn is bound to the parent NSAID (Fig. 1). NO is recognized as a key modulator in a wide array of physiological pathways (11). Of particular importance with regard to chemopreventive therapy are its effects on the gastrointestinal tract. The release of NO might compensate for NSAID-induced reductions in prostaglandin levels through the capacity of NO to increase mucosal blood circulation (12) and mucous release (13), and NO's properties of inhibiting neutrophil adherence and activation (14, 15). Notably, NO-NSAIDs are associated with a significant reduction in renal toxicity as well (16, 17).
FIGURE 1.
Structures of test compounds.
Current evidence shows that NO-NSAIDs are substantially superior compared with their NSAID counterparts with respect to a number of biological end points, including the induction of apoptosis (18–20), and inhibition of cellular proliferation (18, 20, 21), with NO-aspirin having the most potent effects (10). Studies indicate that not only are both the NSAID and the NO moieties responsible for the physiological manifestations of the drugs (22), but, particularly in the case with NO-aspirin, the intact drug works more effectively than administration of aspirin together with an organic nitrate (22–24).
Although some progress has been made in clarifying the mechanisms by which NO-aspirin affords enhanced anticancer properties, relatively little is understood concerning its superior potency and its functional role as a chemopreventive agent. Recently, our laboratory has shown that the aspirin derivative salicylamide suppresses carcinogen-metabolizing enzymes (25), and work by others has called attention to roles for aspirin and other NSAIDs in inhibiting chemically induced carcinogenesis (26). Therefore, we hypothesized that NO-aspirin 2 (nitric oxide-2-(acetyloxy)benzoic acid 4-[(nitrooxy)methyl]phenyl ester; NCX-4040) may act as a chemopreventive agent by enhancing cellular detoxification mechanisms against environmental carcinogens.
Among the compounds we tested in this report, NO-aspirin 2 was the most potent modulator of carcinogen-metabolizing enzymes; therefore, we further studied its effects on the inhibition of DNA strand breakage and carcinogen-DNA adduct formation. We found that the inhibition of Phase I enzymes together with induction of Phase II enzymes by NO-aspirin 2 resulted in a significant suppression of DNA damage caused by environmental carcinogens.
EXPERIMENTAL PROCEDURES
Materials
HepG2 human hepatoma cells and human colon epithelial cancer LS180 cells were from American Type Culture Collection (Manassas, VA). NO-aspirin 2; NCX-4040) was from Cayman Chemical (Ann Arbor, MI). RPMI 1640, Eagle's minimum essential medium with Earle's balanced salt solution, glutamine, fetal bovine serum, TRIzol, and phosphate-buffered saline (PBS) were from Invitrogen (Carlsbad, CA). TCDD was from the Midwest Research Institute (Kansas City, MO). Human recombinant CYP1A1, -1A2, and -1B1 SupersomesTM were from BD Biosciences Gentest (Woburn, MA). Omniscript kits and PCR purification kits were from Qiagen (Valencia, CA). Random primers for cDNA synthesis were from Stratagene (La Jolla, CA). TaqMan Universal PCR Master Mix, and real-time reverse transcription-PCR primers for CYP1A1, CYP1A2, CYP1B1, GCL-m, GCL-c, NQO1, GST-P1, and 18S were from Applied Biosystems (Foster City, CA). Protease inhibitors tablets were from Roche Applied Science (Indianapolis, IN). Anti-AhR rabbit polyclonal antibody was from Santa Cruz Biotechnology (Santa Cruz, CA). Protein A/G-Sepharose/salmon sperm DNA (50% slurry) was from Upstate (Charlottesville, VA). [3H]BP was from Amersham Biosciences. All other chemicals were from Sigma-Aldrich.
Cell Culture
HepG2 human hepatoma cells were grown with RPMI 1640 supplemented with 10% fetal bovine serum and 2 mm glutamine in a 5% CO2 humidified incubator at 37 °C. LS180 colon epithelial cancer cells were grown with Eagle's minimum essential medium supplemented with 10% fetal bovine serum and 2 mm glutamine, also in a 5% CO2 humidified incubator at 37 °C. For all of the treatment compounds, DMSO was used as the vehicle and did not exceed 0.1%.
CYP Enzyme Activity in Intact Cells
The ability of NO-aspirin 2 to affect CYP enzyme activity was determined in intact cells by measurement of ethoxyresorufin-O-deethylase (EROD) activity. Either HepG2 or LS180 cells, in 24-well plates, were treated with or without 1 nm TCDD, for 6 h, in the presence of the increasing concentrations of NO-aspirin 2. At the end of the incubation, the medium was decanted, and the cells were washed once with PBS. Then, medium containing 5 μm ethoxyresorufin was added. Increasing fluorescence as a result of the conversion of ethoxyresorufin to resorufin by CYP enzymes was measured using a CytoFluor multiwell plate reader (Applied Biosystems, Foster City, CA), with an excitation of 530 nm and emission at 590 nm. The reaction was allowed to run for 30 min.
Recombinant CYP1A1, -1A2, and -1B1 Activity
To determine the capacity for NO-aspirin 2 to directly inhibit CYP enzymes, recombinant enzymes were used. Recombinant CYP1A1 (0.75 μm), CYP1A2 (2.5 μm), or CYP1B1 (3.5 μm) SupersomesTM were incubated with 0.4 μm ethoxyresorufin and increasing concentrations of NO-aspirin 2 in a final volume of 100 μl of PBS, pH 7.2. The reaction was initiated by the addition of 500 μm NADPH. The reaction mixture was transferred to a 96-well plate, and EROD activity was determined as described above.
Real-time Reverse Transcription-PCR
In 6-well plates, cells were treated with or without 250 pm TCDD and the indicated concentrations of NO-aspirin 2, for 6 h. Cells were washed twice with PBS, and total RNA was isolated with TRIzol® according to the manufacturer's instructions. CDNA was synthesized from 2 μg of total RNA using random primers and the Omniscript kit according to manufacturer's instructions. Real-time PCR was performed in a reaction mixture containing 12.5 μl of TaqMan Universal PCR Master Mix, 8.75 μl of diethylpyrocarbonate water, 1.25 μl of primers, and 2.5 μl of CDNA using a Bio-Rad iCycler Real Time Detection System. All primers had a FAMTM reporter dye at the 5′-end and a non-fluorescent quencher at the 3′-end of the probe. Amplification conditions were 1 cycle at 50 °C for 2 min and 95 °C for 10 min, followed by 50 cycles at 95 °C for 15 s and 60 °C for 1 min and ended with 1 cycle at 60 °C for 1 min. All samples to be compared in the same experiments were run in the same plate. Gene expression was normalized to 18 S rRNA expression. Normalization to 18 S was done by subtracting the CT for 18 S from the CT of each CYP gene: dCTt = CTt(gene) − CTt(18S) (t = time). To calculate the -fold change (FC) in transcript level, the equation, FC = 2−ddCTt, was used.
Transcription of CYP1A1 and CYP1B1
To determine the rate of transcription of CYP1A1 and CYP1A2 genes, levels of heterogeneous nuclear RNA (hnRNA) were measured by real-time PCR as described by Elferink and Reiners (27). This assay has been well characterized as a valid substitute for nuclear run-on experiments as a measure of transcription rate (28). In 6-well plates, HepG2 cells were treated with 250 pm TCDD and various concentrations of NO-aspirin 2, for 6 h. RNA isolation and CDNA synthesis were performed as described above. Primer sequences were designed using Primer3(MIT) software. Sequences for hnCYP1A1 forward and reverse primers were CTTGGACCTCTTTGGAGCTG and TGACTGTGTCAAACCCTGGA, respectively. Sequences for hnCYP1A2 forward and reverse primers were ACAACCCTGCCAATCTCAAG and CCGTCTTTCTGTCCCCACTA, respectively. Amplification conditions for were 15 min at 95 °C, followed by 45 cycles of 15 s at 94 °C, 30 s at 60 °C, and 30 s at 72 °C. The levels of hnCYP1A1 and hnCYP1A2 were normalized to the level of 18 S rRNA expression.
ChIP Assay
Chromatin immunoprecipitation (ChIP) assays were performed using a method described by Matthews et al. (29), with minor modifications. In 75-cm2 flasks, HepG2 cells were treated with 10 nm TCDD and the indicated concentrations of NO-aspirin 2, for 1.5 h. Cells were washed with warm PBS, and protein-DNA complexes were cross-linked with 1% formaldehyde for 10 min. Cross-linking was quenched by the addition of 125 mm glycine. Cells were then washed with PBS, collected by scraping (in PBS), resuspended in 600 μl of lysis buffer (50 mm Tris-HCl, pH 8.1, 10 mm EDTA, 1% SDS, protease inhibitors) and sonicated three times for 30 s each time (Bronsen sonicator; setting 3, 50% duty cycle). The soluble chromatin was collected by centrifugation, and supernatants (200 μl) were diluted with 800 μl of dilution buffer (1.1% Triton-X 100, 1.1 mm EDTA, 16.7 mm Tris, 167 mm NaCl, protease inhibitors). An aliquot of the diluted sample (20 μl) was put aside for the input fraction. The supernatants were incubated with 40 μl of protein A/G-Sepharose/salmon sperm DNA (50% slurry) under gentle agitation for 2 h at 4 °C. The supernatants were transferred to new tubes, 1 μg of anti-AhR antibody or anti-glyceraldehyde-3-phosphate dehydrogenase was added, and the tubes were incubated overnight on a tiltboard at 4 °C. Protein A/G-Sepharose/salmon sperm DNA (30 μl of a 50% slurry) was then added, and incubation was continued for 1.5 h. Samples were spun down, and the resulting pellets were washed for 5 min in 1 ml of low salt buffer (20 mm Tris-HCl (pH 8.0), 150 mm NaCl, 2 mm EDTA, 1% Triton X-100, 0.1% SDS), 1 ml of high salt buffer (20 mm Tris-HCl (pH 8.0), 500 mm NaCl, 2 mm EDTA, 1% Triton X-100, 0.1% SDS), 1 ml of LiCl wash buffer (20 mm Tris-HCl (pH 8.0), 250 mm LiCl, 1 mm EDTA, 1% Nonidet P-40, 1% sodium deoxycholate), and two times in 1 ml of TE buffer (10 mm Tris-HCl (pH 8.0), 1 mm EDTA). Protein-DNA complexes were eluted by adding 250 μl of fresh elution buffer (1% SDS, 100 mm NaHCO3) for 30 min with rotation, and the cross-links were reversed by overnight incubation at 65 °C. DNA was purified using a PCR purification kit and eluted in 50 μl of elution buffer provided by the manufacturer. DNA was amplified by real-time PCR with conditions and primers sequences for the XRE present in CYP1A1 enhancer region, as described by Matthews et al. (29). The results were normalized to the input samples.
DNA Adduct Formation
Measurement of [3H]BP-DNA adduct formation was performed using the methods of Wen et al. (30). HepG2 cells, in 6-well plates, were treated with [3H]BP (10 μCi/well) alone, or in combination with either 1 or 10 μm NO-aspirin 2, for 9 h. Controls were treated with [3H]BP for 10 s. Two wells were pooled for each sample. Following the treatments, DNA was isolated and quantified by UV spectroscopy. [3H]BP-DNA binding was measured by liquid scintillation counting, and relative counts per minute/μg of DNA were compared between groups.
Single Cell Gel Electrophoresis (Comet Assay)
Single cell gel electrophoresis assay (31) with alkaline electrophoresis was performed according to the CometAssay protocol (TREVIGEN, Gaithersburg, MD), and under protective yellow lighting. In brief, HepG2 cells were treated with either 10 μm BP or 10 nm TCDD alone, or in combination with NO-aspirin 2 (1 or 10 μm), for 24 h. For positive controls, cells were treated with H2O2 for 30 min. Following the treatment, cells were lifted with rubber policemen and counted before being fixed on CometSlides. After SYBR Green I staining, 100 cells were screened per sample using a fluorescence microscope (Zeiss, Maple Grove, MN). The single strand breaks relax the supercoils of the DNA, allowing it to be pulled to one side in the electrophoretic field. Cells were analyzed and quantitated with TriTek CometScore version 1.5 software. The DNA damage was expressed as tail length, where tail length is the distance of DNA migration from the body of the nuclear core, and it is used to evaluate the extent of DNA damage. Undamaged cells appeared as intact nuclei without tails, whereas damaged cells had the appearance of a comet. A longer DNA tail length indicated a higher level of DNA damage.
Statistical Analysis
Statistical analyses were performed with STATVIEW Statistical Analysis Software (SAS Institute, San Francisco, CA). Differences between group mean values were determined by a one-way analysis of variance, followed by Fisher protected least significant difference post-hoc analysis for pairwise comparison of means.
RESULTS
TCDD-induced CYP Enzyme Activity in Intact Cells
The capacity for enzymatic activation of carcinogens was measured by EROD assay, which measures the conversion of ethoxyresorufin to a fluorescent product (resorufin). This conversion specifically measures CYP1A1, -1A2, and -1B1 enzyme activity, although the majority of this activity can be attributed to the 1A1 isoform. These are the principal enzymes involved in the transformation of numerous polycyclic aromatic hydrocarbon pro-carcinogens to their ultimate carcinogenic forms. Because the primary site for metabolism of environmental carcinogens is the liver, we used human hepatoma HepG2 cells. These cells are well established in the study of PAH activation, and are often utilized in pre-clinical evaluation of potential chemopreventive candidate drugs (32–34). Additionally, because the majority of reports demonstrating chemoprotective effects of NSAIDs focus on colon cancer, and because the colon represents another important site for PAH metabolism, we performed our studies in the human adenocarcinoma LS180 cell line.
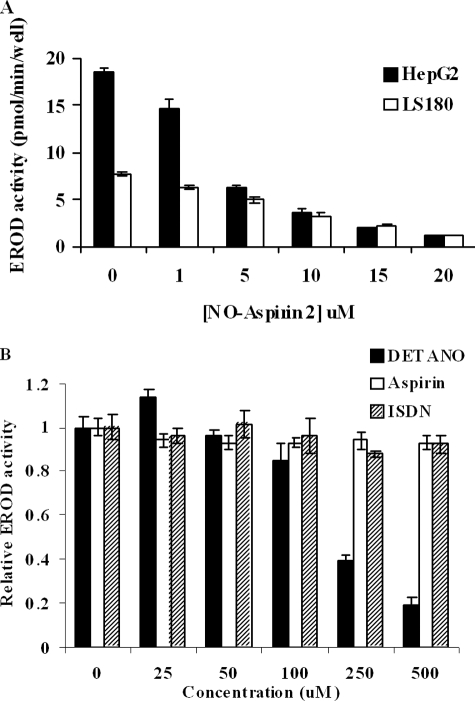
Treatment of HepG2 cells with 1 nm TCDD for 6 h resulted in an increase in EROD-specific activity from non-detectable levels in controls to 18.5 ± 0.47 pmol/min/well. NO-aspirin 2 caused a concentration-dependent inhibition of EROD activity, with an interpolated IC50 of ∼3.25 μm (Fig. 2A). In addition to TCDD, we discovered that NO-aspirin 2 effectively inhibited induction of EROD activity by two other PAHs, benzo[a]pyrene (BP) and 7,12-dimethylbenz[a]anthracene, with IC50 values of 7.5 and 2 μm, respectively (data not shown). In TCDD-treated LS180 cells, EROD-specific activity was 7.7 ± 0.27 pmol/min/well. Co-treatment with NO-aspirin 2 resulted in a concentration-dependent inhibition of EROD activity, with an interpolated IC50 of ∼7.5 μm (Fig. 2A).
FIGURE 2.
TCDD-induced CYP enzyme activity in intact cells. Measurement of Phase I enzyme activity was via EROD assay as described under “Experimental Procedures.” HepG2 and LS180 cells were treated with 1 nm TCDD and increasing concentrations of NO-aspirin 2, for 6 h (A). The effects of DETANO, isosorbide dinitrate (ISDN) and aspirin on TCDD-induced EROD activity were measured in HepG2 cells (B). n = 4; bars represent S.E.
The standard NO-releasing compound, DETANO, also inhibited TCDD-induced EROD activity, but was much less potent (IC50 ∼ 200 μm, Fig. 2B). In contrast, isosorbide dinitrate, an organic NO-donating compound, had no inhibitory effect at concentrations up to 500 μm (Fig. 2B). Furthermore, aspirin itself up to 500 μm in HepG2 cells had no inhibitory capacity toward CYP enzyme activity (Fig. 2B). In contrast to DETANO, we did not detect NO release by NO-aspirin 2 at 10 μm or 25 μm in HepG2 cells measured by chemiluminescent reaction and electrophoresis method (data not shown).
Recombinant CYP Enzyme Activity
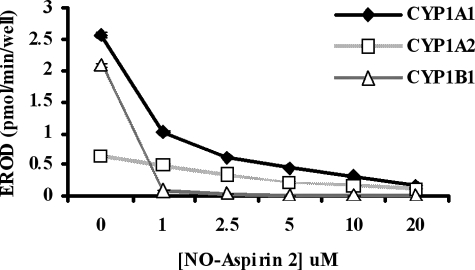
The inhibition of EROD activity by NO-aspirin 2 was also examined using recombinant CYP1A1, CYP1A2, and CYP1B1, to test for direct CYP enzyme inhibition. NO-aspirin 2 caused a concentration-dependent decrease in EROD activity (Fig. 3) from CYP1A1 (IC50 = 0.8 μm), CYP1A2 (IC50 = 3.0 μm), and CYP1B1 (IC50 = 0.6 μm).
FIGURE 3.
Recombinant CYP enzyme activity. The direct effect of NO-aspirin 2 on EROD activity was measured by using CYP SupersomesTM. Activity was measured in the presence of increasing concentrations of NO-aspirin 2. n = 4.
CYP1A1 and CYP1A2 mRNA Expression
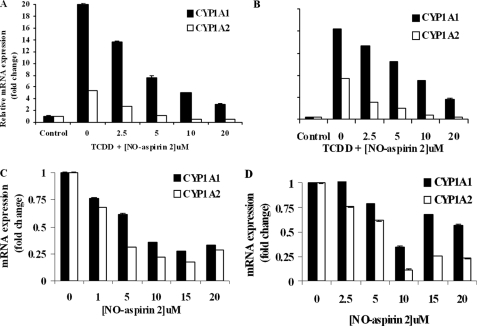
In HepG2 cells, 250 pm TCDD treatment induced CYP1A1 and CYP1A2 mRNA expression by 20- and 5-fold, respectively, compared with DMSO controls (Fig. 4A). In LS180 cells, TCDD (250 pm) treatment resulted in 41- and 19-fold increases in CYP1A1 and CYP1A2 expression, respectively, compared with controls (Fig. 4B). NO-aspirin 2 co-treatment suppressed the inductive effect of TCDD on CYP1A1 and CYP1A2 expression in both cell lines.
FIGURE 4.
CYP1A1 and CYP1A2 mRNA expression. HepG2 (A) and LS180 cells (B) were treated with 250 pm TCDD and increasing concentrations of NO-aspirin 2, for 6 h. CYP1A1 and CYP1A2 mRNA expression was measured by real-time PCR and normalized to the expression of 18 S rRNA. HepG2 (C) and LS180 cells (D) treated only with NO-aspirin 2 also showed an inhibitory effect on CYP1A expression. n = 3.
When NO-aspirin 2 was given alone (i.e. in the absence of an inducing agent), the basal expression of CYP1A1 and CYP1A2 in HepG2 cells was suppressed as well (Fig. 4C). Maximum inhibition was observed with 15 μm NO-aspirin 2, reducing expression to 27 and 17% of control levels, respectively. In LS180 cells, maximal inhibition of CYP1A1 and CYP1A2 occurred with 10 μm NO-aspirin 2, suppressing expression to 35 and 12% of control levels, respectively (Fig. 4D). There was no significant inhibitory effect by NO-aspirin 2 on CYP1B1 (data not shown).
Transcription of CYP1A1 and CYP1A2
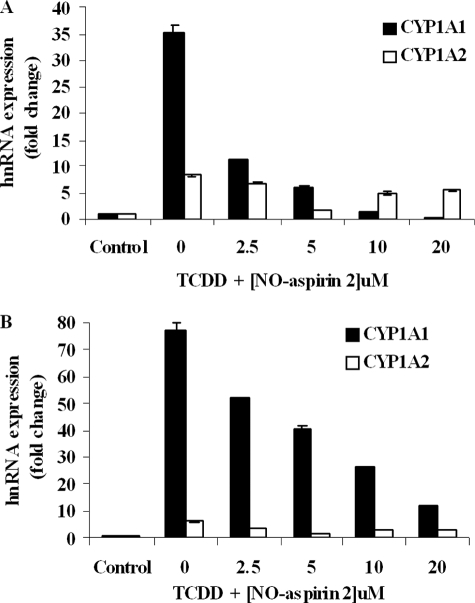
The transcription rate of CYP1A1 and CYP1A2 was measured by quantifying the level of hnRNA by reverse transcription-PCR. Incubation of HepG2 cells with TCDD (250 pm) caused a profound increase in both CYP1A1 and CYP1A2 hnRNA, by 35.1- and 8.2-fold above control levels, respectively. The stimulatory effect of TCDD on the transcription rate of CYP1A1 and CYP1A2 genes was diminished significantly by the addition of NO-Aspirin 2 (Fig. 5A). A similar trend was observed in LS180 cells in which TCDD induced CYP1A1 and CYP1A2 hnRNA by 77.0- and 6.3-fold above controls, respectively, and co-treatment with NO-aspirin 2 significantly inhibited this effect (Fig. 5B).
FIGURE 5.
Transcription of CYP1A1 and CYP1A2. HepG2 (A) and LS180 cells (B) were treated with 250 pm TCDD and increasing concentrations of NO-aspirin 2, for 6 h. CYP1A1 and CYP1A2 hnRNA expression was measured by real-time PCR and normalized to the expression of 18S rRNA. n = 3.
mRNA Expression of Phase II Enzymes
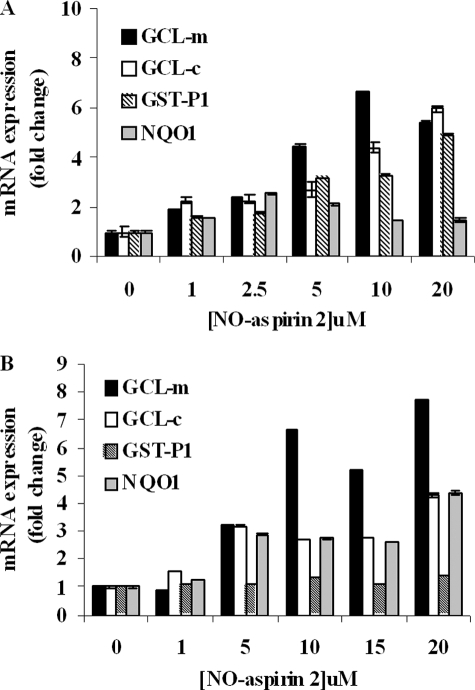
The effect of NO-aspirin 2 on the mRNA expression of carcinogen detoxification enzymes was investigated. HepG2 cells treated with NO-aspirin 2 showed increases in (glutamate-cysteine ligase-modulatory subunit) GCL-m, (glutamate-cysteine ligase-catalytic subunit) GCL-c, GST-P1, and NQO1 by up to 6.6-, 5.9-, 4.9-, and 2.5-fold, respectively (Fig. 6A). Similarly, in LS180 cells, 7.6-, 4.3-, 1.4-, and 4.4-fold increases were seen in GCL-m, GCL-c, GST-P1, and NQO1 expression, respectively (Fig. 6B). In the LS180 cells the induction of GST-P1 was not as great as exhibited in HepG2 cells. This difference in -fold increase between the two cell lines is likely due to the fact that the basal level of GST-P in human liver is extremely low (35), whereas GST-P is the major form found in most extrahepatic tissues, including the colon (36, 37); therefore, a smaller increase in hepatic GST-P expression will result in a greater -fold increase.
FIGURE 6.
mRNA expression of Phase II enzymes. HepG2 (A) and LS180 cells (B) were treated with increasing concentrations of NO-aspirin 2, alone, for 6 h. GCL-modulatory subunit, GCL-catalytic subunit, GST-P1, and NQO1 mRNA expression was measured by real-time PCR and normalized to the expression of 18 S rRNA. n = 3.
In HepG2 cells, aspirin at the highest concentration tested (1000 μm) caused a marginal, non-significant, 1.4-fold increase in GST-P1 expression (compared with controls; data not shown). There was no increase in GCL-m or GCL-c expression with aspirin treatment alone (data not shown). Our results with Phase II enzymes are in contrast to those by Patten and DeLong (38) who showed that aspirin treatment resulted in modest increases in GST and QR activities of 3.5- and 1.5-fold, respectively, compared with controls. The differences in their report may be due to use of a different cell line (HT-29 colon adenocarcinoma cells), longer assay time (24 h), and/or higher concentration tested (3000 μm).
Aryl Hydrocarbon Receptor Activation
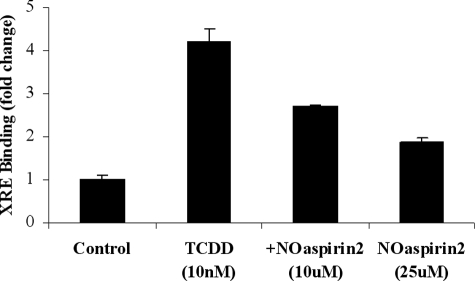
Transcriptional regulation of Phase I genes is controlled by the cytosolic AhR. We used ChIP assays to measure binding of ligand-bound AhR to the enhancer sequence (the XRE) of CYP1A1. Treatment of HepG2 cells with TCDD (10 nm) caused a significant increase in AhR translocation to the nucleus and consequent binding to the XRE. NO-aspirin 2 inhibited the TCDD-activated AhR binding to the XRE, and the inhibitory effect by NO-aspirin 2 is concentration-dependent (Fig. 7). The addition of 10 μm or 25 μm NO-aspirin 2 significantly decreased AhR activation by 47 and 70%, respectively.
FIGURE 7.
AhR activation. HepG2 cells were treated with 10 nm TCDD with and without 10 μm NO-aspirin 2, for 90 min. Binding of the AhR to the CYP1A1 XRE was measured by ChIP assay. Results are representative of three separate experiments. n = 3.
[3H]BP-DNA Adduct Formation
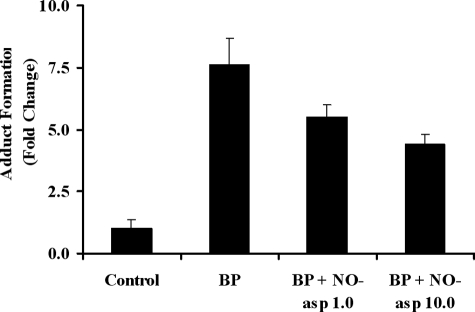
We further investigated NO-aspirin 2 on xenotoxic metabolite formation by measuring BP-DNA adduct formation as a biological end point. We found that the binding of BP to DNA in HepG2 cells was increased by 7.6-fold in the [3H]BP group, compared with controls. In the presence of [3H]BP, the addition of either 1 or 10 μm NO-aspirin 2 significantly decreased BP-DNA adduct formation by 28 and 42%, respectively (Fig. 8).
FIGURE 8.
[3H]BP-DNA adduct formation. HepG2 cells were treated with [3H]BP (10 μCi/well in 6-well plates) alone, or together with 1 or 10 μm NO-aspirin 2, for 9 h. Controls were treated with [3H]BP for 10 s. Binding of [3H]BP to DNA was measured by scintillation counting. n = 3.
Single Cell Gel Electrophoresis (Comet Assay)
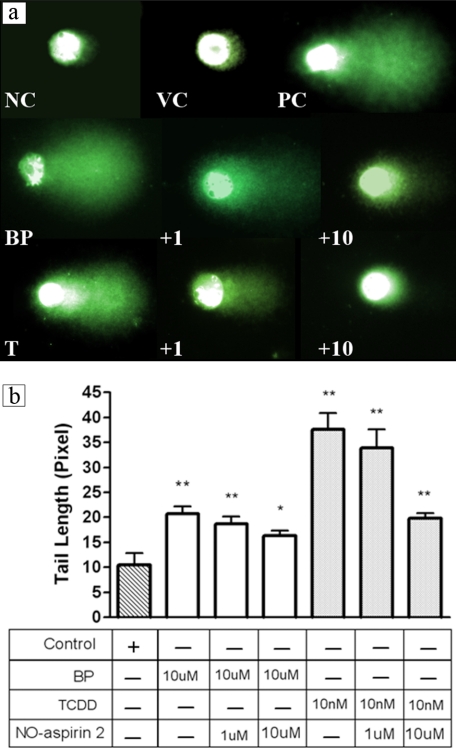
To further demonstrate the chemoprotective effect of NO-aspirin 2 at the DNA level, DNA damage (primarily in the form of single strand breaks) resulting from TCDD or BP treatment was assessed in HepG2 cells via Comet assay. Both TCDD and BP caused significant DNA strand breakage as seen by the large tails. Co-treatment with NO-aspirin 2 (1 or 10 μm) resulted in significant, dose-dependent decreases in DNA damage in both TCDD- and BP-treated cells (Fig. 9).
FIGURE 9.
a, single cell gel electrophoresis (Comet assay). HepG2 cells were treated with either 10 μm BP or 10 nm TCDD alone, or together with 1 or 10 μm NO-aspirin 2. Photographs showing SYBR Green I staining under a fluorescence microscope are representative for each treatment group. NC, negative control; VC, vehicle control and PC, positive control (H2O2); BP, 10 μm BP; +1, BP + 1 μm NO-aspirin 2; +10, BP + 10 μm NO-aspirin 2; T, 10 nm TCDD; +1, TCDD + 1 μm NO-aspirin 2; and +10, TCDD + 10 μm NO-aspirin 2. b, Comet assay resulted in decreased tail length with co-treatment with NO-aspirin 2. Overnight treatment with 10 nm TCDD or 10 μm BP extended tail length that was restored by NO-aspirin 2. Tail lengths were quantified by the CometScore software. *, p < 0.05; **, p < 0.001.
DISCUSSION
Mounting evidence has suggested a role for NSAIDs in cancer prevention. However, gastric, renal, and cardiovascular toxicity associated with use of these agents greatly diminishes their potential in human clinical studies. The adverse effects of long term aspirin usage have led to the development of a new generation of NSAIDs, which are functionally related compounds without the accompanying side-effects. NO-releasing NSAIDs are promising chemopreventive agents that are more potent than their respective parent NSAIDs, and additionally, are more safe. Although recent findings have begun to demonstrate important activities of these compounds, such as induction of apoptosis and inhibition of cell proliferation (19, 21, 39), mechanistic studies of these compounds are largely unexplored.
Because NSAIDs have been shown to inhibit PAH-induced carcinogenesis (26), in these studies we investigated the effects of NO-aspirin 2 on carcinogen-metabolizing enzymes. Environmental carcinogens, such as the PAHs, require activation by Phase I enzymes, CYP1A1, -1A2, and -1B1. Regulation of these enzymes is mediated by the cytosolic AhR, which is activated upon ligand binding. The ligand-bound receptor translocates to the nucleus where it partners with another protein, the aryl hydrocarbon nuclear translocator. Together these proteins function as a transcription factor upon binding enhancer sequences, XREs, found upstream of a number of genes, including CYP1A1, -1A2, and -1B1. Therefore, PAHs serve as ligands for the AhR and induce enzymes responsible for metabolism of the PAHs to carcinogenic forms.
TCDD (dioxin) is a ubiquitous environmental pollutant generated by a variety of industrial processes. It serves as a prototypical ligand for the AhR as it is the most potent inducer of CYP known. TCDD caused marked induction of EROD activity and CYP1A mRNA expression in both HepG2 and LS180 cells. NO-aspirin 2 potently inhibited the TCDD-induced activity and expression but not aspirin (Figs. 2A, 4A, and 4B). This inhibitory effect of NO-aspirin 2 was shown to be mediated by both direct enzyme inhibition (Fig. 3) and by regulation at the transcriptional level. The latter was confirmed from inhibition of TCDD-induced CYP1A hnRNA levels by NO-aspirin 2 (Fig. 5, A and B), because hnRNA is not affected by post-transcriptional processing, transport, or stability; furthermore, co-treatment of NO-aspirin 2 (with TCDD) also blocked the binding of TCDD-activated AhR to the CYP1A1 enhancer sequence, the XRE, as measured by ChIP assay, and it is concentration-dependent (Fig. 7).
Our results suggest that the inhibitory capacity of NO-aspirin 2 toward CYP expression cannot be accounted for by the combined effects of NO and aspirin, because neither the organic nitrate isosorbide dinitrate nor aspirin alone was an effective inhibitor (Fig. 2B). In addition, DETANO, a spontaneous releaser of NO, required a considerably higher concentration to facilitate this inhibitory effect. These findings rule out organic nitrate, NO, or aspirin and suggest that a product other than these components is responsible for the biological effects. Two recent reports have provided evidence that the apoptotic properties of NO-aspirin are not due to NO, or aspirin, but rather, metabolism of the spacer moiety to a quinone methide (40, 41). It is possible that different metabolites of NO-aspirin are responsible for its different biological effects, i.e. the quinone methide could be involved in cellular proliferation, whereas other structural aspects of NO-aspirin, such as the slow NO release, could affect changes in CYP expression. In contrast to DETANO, we did not detect early NO release at the same inhibitory concentration in our study by both chemiluminescent and electrophoresis analysis measurements.3 Additionally, the common method of thiol attack on the quinone methide may be responsible for up-regulation of carcinogen-metabolizing enzymes. Interestingly, inhibition of AhR transformation has been proposed to occur through inactivation of the thiol-dependent protease, calpain (42), and we have found that NO-aspirin 2 inhibits calpain activity.3
The ultimate fate of PAH carcinogens depends on both of Phase I and Phase II enzyme metabolism. The ubiquitous environmental contaminant, BP, is activated by Phase I enzymes, which leads to the formation of xenotoxic metabolites, including the (+)-anti-benzo[a]pyrene-trans-7,8-dihyrdrodiol-9,10-epoxide metabolite, which is the most mutagenic (43) and covalently binds DNA to form bulky adducts (44–46). Phase II metabolism of these and other epoxides leads to the formation of water-soluble products that are more readily excreted. Although there are a handful of compounds known to be activated by Phase II metabolism, such as dihaloalkane compounds, for the most part Phase II metabolism is associated with detoxification. In fact, induction of Phase II enzymes has been generally regarded as a highly efficacious means of chemoprotection (47, 48). Among the reactions by this family of enzymes, GST-mediated conjugation is believed to be a major route of detoxification of the (+)-anti-benzo[a]pyrene-trans-7,8-dihyrdrodiol-9,10-epoxide metabolite, and the π-class isoenzyme (GST-P) has been shown to be particularly efficient in this conjugation (49–51).
In addition to forming epoxides, PAHs such as BP have two other pathways leading to DNA-damaging products: 1) formation of free-radical cations (52) and 2) metabolism by aldoketoreductase 1C and catechol-o-methyltransferase to reactive quinones and reactive oxygen species. The o-quinones can also induce CYPs via an AhR-dependent manner, with a similar EC50 as BP (53); furthermore, they can entire futile redox cycles leading to oxidative damage (e.g. formation of 8′-hydroxy-2-deoxyguanosine, strand scission) of DNA (54–56), and they can introduce DNA adducts (54, 55, 57, 58), potentially leading to carcinogenesis. GSTs catalyze conjugation of BP metabolites, quinones, and reactive oxygen species (37, 51, 53, 59).
In the present studies, we show that in both HepG2 and LS180 cell lines, NO-aspirin 2 up-regulates GST-P1 mRNA expression as well as the expression of other Phase II detoxification genes: GCL-m, GCL-c, and NQO1 (Fig. 6, A and B). GCL is the rate-limiting enzyme in de novo synthesis of glutathione, which is utilized in GST conjugation reactions. The role of NQO is in the detoxification of harmful quinones, and NQO is a commonly used marker of Phase II enzyme induction. Our results are consistent with a recent report by Gao et al. (60), who demonstrated that NO-aspirin 1 (NCX4016), the structurally related meta-isoform of NO-aspirin, induced activities and protein levels of GST and NQO1, in mouse hepatoma Hepa1c1c7 and human colon cancer HT-29 cells.
There are a number of known compounds that induce both Phase I and II enzymes, such as β-naphthoflavone, and PAHs. NO-aspirin 2 is an exciting candidate for chemopreventive owing to its dual mechanism of action: inhibition of Phase I carcinogen activation mediated by the AhR pathway, with concurrent stimulation of Phase II carcinogen detoxification enzyme expression. This dual action led us to hypothesize that the net physiological effect of NO-aspirin 2 would be to protect cells from DNA damage consequent to carcinogen exposure. Our results, showing the suppression of BP-DNA adduct formation (Fig. 8) and that NO-aspirin 2 prevents genotoxicity toward DNA strand break induced by BP and TCDD (Fig. 9), strongly support our hypothesis that NO-aspirin 2 diminishes the amount of BP available in its ultimate carcinogenic form.
As seen in Fig. 9 (a and b), TCDD-treated HepG2 cells also have significant DNA strand breaks. In contrast to BP, TCDD does not bind DNA to form adducts. Instead, its genotoxic capacity is believed to be the result of oxidative damage, dependent upon CYP induction. In fact, the majority of the toxic effects elicited by TCDD are believed to require AhR induction as shown by studies utilizing AhR-deficient mice (61–63). Therefore, the suppression of TCDD-induced DNA damage underscores the importance of the effects on the AhR-mediated pathway by NO-aspirin 2 with regard to inhibiting directly and indirectly acting genotoxic agents.
In summary, environmental carcinogens such as PAHs cause DNA damage, which leads to AhR-mediated cellular transformation via formation of DNA-binding epoxides and quinones and generation of reactive oxygen species. Inhibition of Phase I enzymes and up-regulation of Phase II enzymes are important mechanisms of action that may contribute to the chemoprotective capacity of NO-aspirin 2. These mechanisms of action of NO-aspirin 2 lead to protection of DNA from genotoxic metabolite-forming environmental carcinogens. Whether the effects of NO-aspirin 2 are selective for target genes other than the Phase I and II carcinogen metabolism, i.e. DNA repair and stability genes are under our current investigation. Understanding the biological consequences attributed by NO-aspirin 2 in other target genes will enhance our knowledge and lead to toward cancer prevention against environmental carcinogens.
C. J. MacDonald, R. Y. S. Cheng, D. D. Roberts, D. A. Wink, and G. C. Yeh, unpublished data.
- NSAID
- non-steroidal anti-inflammatory drug
- NO-aspirin 2
- nitric oxide-2-(acetyloxy)benzoic acid 4-[(nitrooxy)methyl]phenyl ester (NCX-4040)
- PBS
- phosphate-buffered saline
- TCDD
- 2,3,7,8-tetrachlordibenzo-p-dioxin
- CYP
- cytochrome P450
- EROD
- ethoxyresorufin-O-deethylase
- hnRNA
- heterogeneous nuclear RNA
- ChIP
- chromatin immunoprecipitation
- GST
- glutathione S-transferase
- AhR
- aryl hydrocarbon receptor
- GCL
- glutamate-cysteine ligase
- NQO1
- NAD(P)H:quinone oxidoreductase-1
- BP
- benzo[a]pyrene
- PAH
- polycyclic aromatic hydrocarbon
- XRE
- xenobiotic response element.
REFERENCES
- 1.Thun M. J., Henley S. J., Patrono C. (2002) J. Natl. Cancer Inst. 94, 252–266 [DOI] [PubMed] [Google Scholar]
- 2.Baron J. A. (2003) Prog. Exp. Tumor Res 37, 1–24 [DOI] [PubMed] [Google Scholar]
- 3.Soll A. (1998) Am. J. Med. 105, 10S–16S [DOI] [PubMed] [Google Scholar]
- 4.Segasothy M., Samad S. A., Zulfigar A., Bennett W. M. (1994) Am. J. Kidney Dis. 24, 17–24 [DOI] [PubMed] [Google Scholar]
- 5.Bjorkman D. J. (1999) Am. J. Med. 107, 3S–8S; discussion 8S–10S [DOI] [PubMed] [Google Scholar]
- 6.Singh G., Triadafilopoulos G. (1999) J. Rheumatol. Suppl. 56, 18–24 [PubMed] [Google Scholar]
- 7.Jüni P., Nartey L., Reichenbach S., Sterchi R., Dieppe P. A., Egger M. (2004) Lancet 364, 2021–2029 [DOI] [PubMed] [Google Scholar]
- 8.Mukherjee D., Nissen S. E., Topol E. J. (2001) JAMA 286, 954–959 [DOI] [PubMed] [Google Scholar]
- 9.Mamdani M., Juurlink D. N., Lee D. S., Rochon P. A., Kopp A., Naglie G., Austin P. C., Laupacis A., Stukel T. A. (2004) Lancet 363, 1751–1756 [DOI] [PubMed] [Google Scholar]
- 10.Rigas B., Kashfi K. (2004) Trends Mol. Med. 10, 324–330 [DOI] [PubMed] [Google Scholar]
- 11.Cirino G., Wheeler-Jones C. P., Wallace J. L., Del Soldato P., Baydoun A. R. (1996) Br. J. Pharmacol. 117, 1421–1426 [DOI] [PMC free article] [PubMed] [Google Scholar]
- 12.Wallace J. L., Miller M. J. (2000) Gastroenterology 119, 512–520 [DOI] [PubMed] [Google Scholar]
- 13.Brown J. F., Keates A. C., Hanson P. J., Whittle B. J. (1993) Am. J. Physiol. 265, G418–G422 [DOI] [PubMed] [Google Scholar]
- 14.Kubes P., Suzuki M., Granger D. N. (1991) Proc. Natl. Acad. Sci. U.S.A. 88, 4651–4655 [DOI] [PMC free article] [PubMed] [Google Scholar]
- 15.Davenpeck K. L., Gauthier T. W., Lefer A. M. (1994) Gastroenterology 107, 1050–1058 [DOI] [PubMed] [Google Scholar]
- 16.Fujihara C. K., Malheiros D. M., Donato J. L., Poli A., De Nucci G., Zatz R. (1998) Am. J. Physiol. 274, F573–F579 [DOI] [PubMed] [Google Scholar]
- 17.Muscará M. N., McKnight W., Del Soldato P., Wallace J. L. (1998) Life Sci. 62, PL235–240 [DOI] [PubMed] [Google Scholar]
- 18.Williams J. L., Borgo S., Hasan I., Castillo E., Traganos F., Rigas B. (2001) Cancer Res. 61, 3285–3289 [PubMed] [Google Scholar]
- 19.Konturek P. C., Kania J., Burnat G., Hahn E. G. (2006) J. Physiol. Pharmacol. 57( Suppl 12), 15–24 [PubMed] [Google Scholar]
- 20.Yeh R. K., Chen J., Williams J. L., Baluch M., Hundley T. R., Rosenbaum R. E., Kalala S., Traganos F., Benardini F., del Soldato P., Kashfi K., Rigas B. (2004) Biochem. Pharmacol. 67, 2197–2205 [DOI] [PubMed] [Google Scholar]
- 21.Kashfi K., Ryan Y., Qiao L. L., Williams J. L., Chen J., Del Soldato P., Traganos F., Rigas B., Ryann Y. (2002) J. Pharmacol. Exp. Ther. 303, 1273–1282 [DOI] [PubMed] [Google Scholar]
- 22.Wallace J. L., Ignarro L. J., Fiorucci S. (2002) Nat. Rev. Drug Discov. 1, 375–382 [DOI] [PubMed] [Google Scholar]
- 23.Kashfi K., Borgo S., Williams J. L., Chen J., Gao J., Glekas A., Benedini F., Del Soldato P., Rigas B. (2005) J. Pharmacol. Exp. Ther. 312, 978–988 [DOI] [PubMed] [Google Scholar]
- 24.Stefano F., Distrutti E. (2007) Curr. Top Med. Chem. 7, 277–282 [DOI] [PubMed] [Google Scholar]
- 25.MacDonald C. J., Ciolino H. P., Yeh G. C. (2004) Cancer Res. 64, 429–434 [DOI] [PubMed] [Google Scholar]
- 26.Rao C. V., Reddy B. S. (2004) Curr. Cancer Drug Targets 4, 29–42 [DOI] [PubMed] [Google Scholar]
- 27.Elferink C. J., Reiners J. J., Jr. (1996) BioTechniques 20, 470–477 [DOI] [PubMed] [Google Scholar]
- 28.Ryu D. Y., Levi P. E., Fernandez-Salguero P., Gonzalez F. J., Hodgson E. (1996) Mol. Pharmacol. 50, 443–446 [PubMed] [Google Scholar]
- 29.Matthews J., Wihlén B., Thomsen J., Gustafsson J. A. (2005) Mol. Cell. Biol. 25, 5317–5328 [DOI] [PMC free article] [PubMed] [Google Scholar]
- 30.Wen X., Walle U. K., Walle T. (2005) Carcinogenesis 26, 803–809 [DOI] [PubMed] [Google Scholar]
- 31.Singh N. P., McCoy M. T., Tice R. R., Schneider E. L. (1988) Exp. Cell Res. 175, 184–191 [DOI] [PubMed] [Google Scholar]
- 32.O'Brien P. J., Irwin W., Diaz D., Howard-Cofield E., Krejsa C. M., Slaughter M. R., Gao B., Kaludercic N., Angeline A., Bernardi P., Brain P., Hougham C. (2006) Arch. Toxicol 80, 580–604 [DOI] [PubMed] [Google Scholar]
- 33.Schoonen W. G., de Roos J. A., Westerink W. M., Débiton E. (2005) Toxicol. In Vitro 19, 491–503 [DOI] [PubMed] [Google Scholar]
- 34.Schoonen W. G., Westerink W. M., de Roos J. A., Débiton E. (2005) Toxicol. In Vitro 19, 505–516 [DOI] [PubMed] [Google Scholar]
- 35.Awasthi Y. C., Sharma R., Singhal S. S. (1994) Int. J. Biochem. 26, 295–308 [DOI] [PubMed] [Google Scholar]
- 36.Singhal S. S., Saxena M., Awasthi S., Ahmad H., Sharma R., Awasthi Y. C. (1992) Biochim. Biophys. Acta 1171, 19–26 [DOI] [PubMed] [Google Scholar]
- 37.Hayes J. D., Pulford D. J. (1995) Crit. Rev. Biochem. Mol Biol. 30, 445–600 [DOI] [PubMed] [Google Scholar]
- 38.Patten E. J., DeLong M. J. (1999) Cancer Lett. 147, 95–100 [DOI] [PubMed] [Google Scholar]
- 39.Rosetti M., Tesei A., Ulivi P., Fabbri F., Vannini I., Brigliadori G., Amadori D., Bolla M., Zoli W. (2006) Apoptosis 11, 1321–1330 [DOI] [PubMed] [Google Scholar]
- 40.Hulsman N., Medema J. P., Bos C., Jongejan A., Leurs R., Smit M. J., de Esch I. J., Richel D., Wijtmans M. (2007) J. Med. Chem. 50, 2424–2431 [DOI] [PubMed] [Google Scholar]
- 41.Kashfi K., Rigas B. (2007) Biochem. Biophys. Res. Commun. 358, 1096–1101 [DOI] [PubMed] [Google Scholar]
- 42.Dale Y. R., Eltom S. E. (2006) Mol. Pharmacol. 70, 1481–1487 [DOI] [PubMed] [Google Scholar]
- 43.Conney A. H. (1982) Cancer Res. 42, 4875–4917 [PubMed] [Google Scholar]
- 44.Sims P., Grover P. L., Swaisland A., Pal K., Hewer A. (1974) Nature 252, 326–328 [DOI] [PubMed] [Google Scholar]
- 45.Pelkonen O., Nebert D. W. (1982) Pharmacol. Rev. 34, 189–222 [PubMed] [Google Scholar]
- 46.Melendez-Colon V. J., Luch A., Seidel A., Baird W. M. (1999) Carcinogenesis 20, 1885–1891 [DOI] [PubMed] [Google Scholar]
- 47.Talalay P. (2000) Biofactors 12, 5–11 [DOI] [PubMed] [Google Scholar]
- 48.Talalay P., Dinkova-Kostova A. T., Holtzclaw W. D. (2003) Adv. Enzyme Regul. 43, 121–134 [DOI] [PubMed] [Google Scholar]
- 49.Robertson I. G., Guthenberg C., Mannervik B., Jernström B. (1986) Cancer Res. 46, 2220–2224 [PubMed] [Google Scholar]
- 50.Hu X., Benson P. J., Srivastava S. K., Xia H., Bleicher R. J., Zaren H. A., Awasthi S., Awasthi Y. C., Singh S. V. (1997) Int. J. Cancer 73, 897–902 [DOI] [PubMed] [Google Scholar]
- 51.Sundberg K., Dreij K., Seidel A., Jernström B. (2002) Chem. Res. Toxicol. 15, 170–179 [DOI] [PubMed] [Google Scholar]
- 52.Cavalieri E. L., Rogan E. G. (1995) Xenobiotica 25, 677–688 [DOI] [PubMed] [Google Scholar]
- 53.Burczynski M. E., Penning T. M. (2000) Cancer Res. 60, 908–915 [PubMed] [Google Scholar]
- 54.Shou M., Harvey R. G., Penning T. M. (1993) Carcinogenesis 14, 475–482 [DOI] [PubMed] [Google Scholar]
- 55.McCoull K. D., Rindgen D., Blair I. A., Penning T. M. (1999) Chem. Res. Toxicol. 12, 237–246 [DOI] [PubMed] [Google Scholar]
- 56.Flowers L., Ohnishi S. T., Penning T. M. (1997) Biochemistry 36, 8640–8648 [DOI] [PubMed] [Google Scholar]
- 57.Balu N., Padgett W. T., Lambert G. R., Swank A. E., Richard A. M., Nesnow S. (2004) Chem. Res. Toxicol. 17, 827–838 [DOI] [PubMed] [Google Scholar]
- 58.Park J. H., Troxel A. B., Harvey R. G., Penning T. M. (2006) Chem. Res. Toxicol. 19, 719–728 [DOI] [PMC free article] [PubMed] [Google Scholar]
- 59.Bolton J. L., Trush M. A., Penning T. M., Dryhurst G., Monks T. J. (2000) Chem. Res. Toxicol. 13, 135–160 [DOI] [PubMed] [Google Scholar]
- 60.Gao J., Kashfi K., Liu X., Rigas B. (2006) Carcinogenesis 27, 803–810 [DOI] [PubMed] [Google Scholar]
- 61.Fernandez-Salguero P. M., Ward J. M., Sundberg J. P., Gonzalez F. J. (1997) Vet. Pathol. 34, 605–614 [DOI] [PubMed] [Google Scholar]
- 62.Shimizu Y., Nakatsuru Y., Ichinose M., Takahashi Y., Kume H., Mimura J., Fujii-Kuriyama Y., Ishikawa T. (2000) Proc. Natl. Acad. Sci. U.S.A. 97, 779–782 [DOI] [PMC free article] [PubMed] [Google Scholar]
- 63.Mimura J., Yamashita K., Nakamura K., Morita M., Takagi T. N., Nakao K., Ema M., Sogawa K., Yasuda M., Katsuki M., Fujii-Kuriyama Y. (1997) Genes Cells 2, 645–654 [DOI] [PubMed] [Google Scholar]


