

Abstract
Lipin 1 plays a crucial role in lipid metabolism in adipose tissue, skeletal muscle, and liver. Its physiological role involves two cellular functions: regulation of phosphatidate phosphatase activity and regulation of fatty acid oxidation. In this study, we have demonstrated that lipin 1 gene (LPIN1) expression is regulated by cellular sterols, which are key regulators of lipid metabolism. We have also characterized the sterol-response element and nuclear factor Y-binding sites in the human LPIN1 promoter. Using a luciferase assay, electrophoretic mobility shift assay, and chromatin immunoprecipitation assay, we demonstrated that these elements are responsible for the transcription of LPIN1 gene, mediated by SREBP-1 (sterol regulatory element-binding protein 1) and nuclear factor Y. Furthermore, we investigated whether lipin 1 is involved in lipogenesis by transfection of LPIN1 small interfering RNA. We infer that sterol-mediated regulation of lipin 1 gene transcription modulates triglyceride accumulation. This modulation involves changes in the activity of phosphatidate phosphatase.
The gene encoding lipin 1 (LPIN1) was identified with a positional cloning approach that localized the causative mutation in fatty liver dystrophic (fld) mice, a mouse model of lipodystrophy (1). Lipin 1 is abundantly expressed in adipose tissue, liver, and skeletal muscle and plays roles in lipid and glucose homeostasis (2, 3). Lipin 1-deficient mice have a reduced adipose tissue mass, mild hyperglycemia, and insulin resistance (2, 4). Conversely, enhanced lipin 1 expression in the adipose tissue or skeletal muscle of transgenic mice leads to obesity (5).
Recent studies have revealed that lipin 1 has important nuclear and nonnuclear functions that regulate lipid and energy metabolism (1). In the cytosol, lipin 1 acts as an Mg2+-dependent PAP1 (phosphatidate phosphatase type 1), catalyzing a key step in the synthesis of glycerolipids (6–8). PAP1 converts phosphatidate to diacylglycerol, which is the direct precursor of triglycerides (TG)2 and phospholipids. In the nucleus, lipin 1 acts as a transcriptional coactivator through its direct interaction with peroxisome proliferator-activated receptor γ (PPARγ) coactivator-1α (PGC-1α). Lipin 1 also activates mitochondrial fatty acid oxidative metabolism by inducing the expression of PPARα (9). Thus, through two distinct functions in the nucleus and cytosol, lipin 1 modulates lipid metabolism and glucose homeostasis (1).
In comparison with the above mentioned cellular functions of lipin 1, research on the molecular mechanism of lipin 1 expression has progressed in recent years. It has been reported that the glucocorticoid receptor regulates the mouse LPIN1 promoter by the synthetic glucocorticoid, dexamethasone (10). Lipin 1 expression is also induced by thiazolidione drugs (TZDs) and the small molecule harmine in adipocytes, both in vitro and in vivo (11, 12). These observations suggest that there should be a certain factor affecting lipogenesis and adipogenesis modulates the expression of lipin 1.
Sterol regulatory element-binding proteins (SREBPs) belong to a large class of the basic helix-loop-helix leucine zipper family of transcription factors, which regulates the biosynthesis of both fatty acids and cholesterol (13–15). Two different genes, SREBP-1 and SREBP-2, encode three SREBP isoforms (SREBP-1a, SREBP-1c, and SREBP-2) in mammalian cells (16, 17). SREBP-1a and SREBP-1c are predominantly involved in lipogenesis, whereas SREBP-2 mainly activates genes related to cholesterogenesis (18, 19). All SREBPs are synthesized as transcriptionally inactive precursors (13). When the cellular sterol level is high, SREBPs are bound to the endoplasmic reticulum. When the cellular sterol level decreases, SREBPs undergo proteolytic processing in the Golgi apparatus, resulting in the release of a mature transcription factor, which translocates to the nucleus. Mature SREBPs can bind to SREs in the promoters of target genes to regulate their transcription (20). It is also well known that either nuclear factor Y (NF-Y) or Sp1 is necessary for the sufficient transcriptional activation by SREBPs. Therefore, most of sterol-mediated promoters include either the NF-Y-binding site or Sp1-binding site in addition to SREs.
Based on these observations of lipid metabolism, we set out to examine the relationship between sterol-dependent transcriptional regulation and LPIN1 expression in human hepatoblastoma cells. In this study, we show that the regulation of lipin 1 expression is significantly influenced by intracellular sterol depletion. Knockdown of SREBP-1 by the transfection of small interfering RNA (siRNA) directed against SREBP-1 mRNA reduced lipin 1 expression. These results indicate that lipin 1 is regulated by SREBP-1 in hepatoblastoma cells. The human LPIN1 promoter was also shown to contain an SRE motif and NF-Y-binding site, which are required for its basal promoter activity and maximum sterol-mediated induction, respectively. Moreover, the suppression of lipin 1 expression by LPIN1 siRNA in hepatoblastoma cells abrogated cellular TG accumulation. These results suggest that lipin 1, modulated by cellular sterols, regulates lipid metabolism as a mediator in the de novo lipogenesis pathway.
EXPERIMENTAL PROCEDURES
Cell Culture
Huh7 and HepG2 cells were cultured in Dulbecco's modified Eagle's medium (DMEM) supplemented with heat-inactivated fetal bovine serum (5% for Huh7 cells and 10% for HepG2 cells), 100 IU/ml penicillin, and 100 μg/ml streptomycin. For the sterol depletion experiments, the cells were cultured in DMEM supplemented with lipoprotein-deficient serum (LPDS). In some experiments, cells were cultured in DMEM supplemented with either 10 μg/ml cholesterol plus 1 μg/ml 25-hydroxycholesterol or 50 μm pitavastatin (a 3-hydroxy-3-methylglutaryl coenzyme A reductase inhibitor) plus 50 μm sodium mevalonate.
Schneider line 2 (SL2) cells, a continuous Drosophila cell line, were maintained in Schneider's medium containing 100 IU/ml penicillin and 100 μg/ml streptomycin supplemented with 10% fetal bovine serum and grown at 23 °C.
RNA Extraction and Real Time RT-PCR Analysis
Total RNA was isolated from Huh7 cells using an RNA preparation kit (Nippon Gene Corp.). Total RNA was treated with DNase I, which was then inactivated with DNase I-inactivating reagent (Ambion). First-strand cDNA was synthesized from the total RNA of each cell sample using the SuperScriptTM III First-Strand Synthesis System for RT-PCR (Invitrogen) with oligo(dT)20 primer. The cDNA was then used as the template for individual PCRs with specific primer sets, which were designed with the Primer3 program (Whitehead Institute). PCRs were performed with a QuantiTect® SYBR Green PCR kit (Qiagen). Amplification specificity was verified by visualizing the PCR products on an ethidium bromide-stained 2% agarose gel. Cyclophilin A or 36B4 mRNA was used to normalize each expression datum. The primers used were as follows: 5′-CCCGACCTTCAACACCTAAAAGT-3′ and 5′-TGGACTCTTTCATCTTGTGTGGA-3′ for LPIN1; 5′-GCGTCTCCTTTGAGCTGTTT-3′ and 5′-TCACCACCCTGACACATAAACC-3′ for cyclophilin A; 5′-TGTTTCATTGTGGGAGCAGA-3′ and 5′-TGAGGCAGCAGTTTCTCCAG-3′ for 36B4; 5′-CTGCTGACCGACATCGAAGA-3′ and 5′-TCAAATAGGCCAGGGAAGTCA-3′ for SREBP-1a; 5′-GCCATGGATTGCACTTTCG-3′ and 5′-TCAAATAGGCCAGGGAAGTCA-3′ for SREBP-1c; 5′-TGTCCTGAGCGTCTTTGTGAA-3′ and 5′-GCAAAATCTCCTCTGGCGA-3′ for SREBP-2; 5′-CTTGCTGCAGGACGATATCTCT-3′ and 5′-GGGCATCGTCTCCAACTTATC-3′ for stearoyl-CoA desaturase; and 5′-ATCCCTGGGAAGTCATAGTGG-3′ and 5′-TGTCACTGCTCAAAACATCCTC-3′ for 3-hydroxy-3-methylglutaryl coenzyme A reductase.
Gene Silencing Experiments
Predesigned siRNAs targeting SREBP-1, SREBP-2, and LPIN1 mRNAs were provided by Qiagen. Huh7 cells were transfected with 25 nm siRNA using X-tremeGENE siRNA transfection reagent, as recommended by the manufacturer (Roche Applied Science). As a control, we used the AllStars Negative Control siRNA (Qiagen), the sequence of which has no significant similarity to any mammalian gene. For the siRNA experiments, total RNA was extracted using the QuickGene RNA cultured cell HC kit S (Fujifilm).
Immunoblot Analysis
To prepare whole cell extracts, Huh7 cells were lysed in 25 mm Tris-HCl (pH 7.5), 150 mm NaCl, 5 mm EDTA, 1% Nonidet P-40, 1% sodium deoxycholate, 0.1% SDS, and protease inhibitor mixture (Sigma). The cell compartment components were isolated according to the protocol in the Qiagen Qproteome cell compartment kit (Qiagen). Each cell extract was resolved on (7.5%) SDS-PAGE, and electroblotted onto nitrocellulose membranes. Western blot analyses were performed using anti-human lipin 1 antibody (R&D Systems) or anti-lamin B2 antibody (Abcam). The signals were visualized with the SuperSignal West Dura Extended Duration chemiluminescent substrate (Pierce).
For the SREBP experiments, 25 μg/ml N-acetyl-Leu-Leu-norleucinal was added directly to the medium 1 h before cell harvesting. SREBP precursors were detected with anti-SREBP-1 antibody (Santa Cruz Biotechnology, Inc., Santa Cruz, CA) or anti-SREBP-2 antibody (Perseus Proteomics).
Plasmid Constructs
The mature human SREBP-1a expression vector (pcDNA3-nSREBP1a; amino acids 1–460) was obtained by subcloning pCMV-nSREBP1a into the pcDNA3 vector (Invitrogen). The mature human SREBP-1c expression vector (pcDNA3-nSREBP1c, amino acids 1–436) was created by cloning the appropriate cDNA from HepG2-tet-off-hLXRα cells into the pcDNA3 vector (21). The murine NF-YA29-expressing plasmid (pcDNA3-NF-YA29) has been described previously (22). pPac, a Drosophila actin 5C promoter-driven expression vector, pPacβ-gal, pPAC-nSREBP1a, pPacNF-YA, pPacNF-YB, and pPacNF-YC have been described previously (22). To generate human LPIN1 promoter-reporter plasmids, the LPIN1 promoter containing nucleotides −2571 to +46 (LPIN1−2571) was isolated by PCR from human genomic DNA-extracted HepG2 cells. The promoter was cloned into the PGV-B vector (Toyo Ink). A deletion construct and site-directed mutations were introduced into the LPIN1 promoter by PCR. The nucleotide sequences of these plasmids were confirmed by sequencing them on an ABI PRISM® 310 Genetic Analyzer (Applied Biosystems).
Transfections and Luciferase Assay
DNA transfection of HepG2 cells was performed with Lipofectamine 2000 (Invitrogen), as described previously (21, 23). One day before transfection, the cells were seeded at a density of 1.5 × 10⁵ cells/well on 24-well plates. The cells were transfected with 200 ng of the LPIN1 reporter plasmid, 200 ng of pSV-β-galactosidase (Promega), and 200 ng of expression vector. Four hours after transfection, the cells were cultured in medium containing sterols (10% LPDS, 10 μg/ml cholesterol, and 1 μg/ml 25-hydroxycholesterol), LPDS (10% LPDS), or statin (10% LPDS, 50 μm pitavastatin, and 50 μm sodium mevalonate). After 20 h, assays for both luciferase and β-galactosidase activities were performed. The reporter activities are expressed as the relative luciferase activity/β- galactosidase activity.
In the experiment using the dominant negative NF-Y mutant (pcDNA3-NF-YA29), HepG2 cells were cotransfected with 200 ng of the LPIN1 reporter plasmid, 200 ng of pSV-β-galactosidase, and 50, 100, or 400 ng of the NF-YA29 expression vector. The total amount of DNA was adjusted to 800 ng by the addition of the pcDNA3 vector.
DNA transfection for SL2 cells were carried out with Lipofectamine 2000, as recommended by the manufacturer (Invitrogen). The cells were seeded at a density of 5 × 10⁵ cells/well on 24-well plates and transfected with 300 ng of luciferase reporter plasmid, 20 ng of pPac–β-galactosidase, and the indicated amount of pPac-derived expression vectors (see the figure legends). The total amount of DNA was equalized by adding the appropriate amount of pPac vector plasmid. Cells were harvested 24 h after transfection, and luciferase assays were performed as described above.
Electrophoretic Mobility Shift Assay (EMSA)
Nuclear extracts were prepared from Huh7 cells that had been cultured in DMEM supplemented with LPDS for 16 h. EMSAs were performed as described previously (21, 23). In the competition studies, a 10- or 100-fold molar excess of unlabeled DNA was added to the reaction mixture. Supershift assays were performed using anti-human SREBP-1 (Santa Cruz Biotechnology) or anti-NF-YA (Santa Cruz Biotechnology) antibody. Double-stranded DNAs composed of the following sequences were used for the binding and competition assays: wild-type human LPIN1 SRE, 5′-GTTCCTTCTCCTCTTCCGAGTGCAG-3′; mutant LPIN1 SRE, 5′-GTTCCTTCTCCTacaaaatGTGCAG-3′; positive control SRE of the low density lipoprotein receptor gene (LDLR), 5′-GAAAATCACCCCACTGCAAA-3′; wild-type LPIN1 NF-Y, 5′-GCTAGGTCCTGGGATTGGCCAGGGGGAT-3′; mutant LPIN1 NF-Y, 5′-GCTAGGTCCTGGGaggtGCCAGGGGGAT-3′; and the positive control NF-Y based on data from Santa Cruz Biotechnology, 5′-GAGACCGTACGTGATTGGTTAATCTCTT-3′ (mutated bases are shown as lowercase letters).
Chromatin Immunoprecipitation (ChIP) Assay
ChIP assays were performed as described previously (21, 23). Huh7 cells were cultured in DMEM supplemented with LPDS for 16 h. Antibody directed against SREBP-1 (Santa Cruz Biotechnology), NF-YA (Santa Cruz Biotechnology), or rabbit IgG (Santa Cruz Biotechnology) was used. The precipitated DNAs were analyzed by PCR using the primers 5′-TGGATTGTGAAACTGAGCCTCT-3′ and 5′-AGTGACTCAGCCAGGAGAGC-3′, which flank the SRE and NF-Y-binding site of the LPIN1 promoter.
Cell Extract Phosphatidate Phosphatase Assays
Huh7 cells were harvested in 0.25 m sucrose containing 2 mm dithiothreitol, 0.15% Tween 20, and protease inhibitor mixture (7). The cell lysates were centrifuged at 1000 × g for 10 min at 4 °C, and the supernatant was used for the phosphatidate phosphatase assays (24). We designed an optimum assay (100 μl final volume) for PAP1 using 100 mm Tris/maleate buffer, pH 6.5, 5 mm MgCl2, 2 mg/ml fatty acid-poor bovine serum albumin, and 100 μm phosphatidic acid labeled with [14C]palmitate (0.05 μCi/assay), which was dispersed in 66.7 μm phosphatidylcholine and 1 mm EDTA that was used to prepare the lipid substrate (7, 25). All enzyme assays were conducted at 37 °C, and reactions were stopped by adding 2.2 ml of chloroform containing 0.08% olive oil as carrier for neutral lipids. The [14C]diacylglycerol was purified using 0.8 g of basic alumina and then quantitated by scintillation counting (26). Protein concentrations (measured by the Bradford method) and the times of incubation (normally 30 min) were adjusted so that <15% of the phosphatidic acid was consumed during the incubation. Parallel incubations were performed in the presence of (5 mm) N-ethylmaleimide to inhibit PAP1 in order to compensate for any PAP2 activity in the assay. The assay was performed in duplicate for each sample.
Measurement of TG Content
Huh7 cells were transfected with control or LPIN1 siRNA for 48 h in DMEM supplemented with 5% fetal bovine serum. After 48 h, the cells were cultured for 72 h in DMEM with 5% LPDS supplemented with either 10 μg/ml cholesterol plus 1 μg/ml 25-hydroxycholesterol or 100 nm pitavastatin plus 50 μm sodium mevalonate. Cellular TG concentrations were determined by enzymatic assays using the Triglyceride E-Test Wako (Wako Pure Chemicals). Data were normalized to the amount of protein present after extraction. Protein concentrations were determined using the BCA Protein Assay (Pierce).
Statistical Analysis
All data are presented as means ± S.E. Statistical analyses were performed with the Dunn-Bonferroni test using Statcel version 2.0 (OMS Publishing Inc.).
RESULTS
Induction of the LPIN1 Gene by Sterol Depletion
To determine whether LPIN1 is regulated by intracellular sterol, human Huh7 hepatoblastoma cells were cultured for 24 h in one of three media supplemented as follows: with sterols (DMEM with LPDS, cholesterol, and 25-hydroxycholesterol), LPDS (DMEM with LPDS), or statin (DMEM with LPDS, pitavastatin, and sodium mevalonate). These media contained sterols, LPDS, and statin, in order of decreasing intracellular sterols. We measured the LPIN1 mRNA expression using quantitative RT-PCR (Fig. 1A). LPIN1 mRNA levels were induced 3.3-fold in LPDS medium relative to those in sterol-containing medium. In statin-containing medium, LPIN1 mRNA increased 7.2-fold. We then examined lipin 1 protein levels in sterol-, LPDS-, or statin-containing medium. Lipin 1 protein levels increased in the cells at lower levels of cellular sterols compared with those in cells containing higher levels of cellular sterols (Fig. 1B). These results indicate that the expression of LPIN1 is regulated in a sterol-dependent manner.
FIGURE 1.
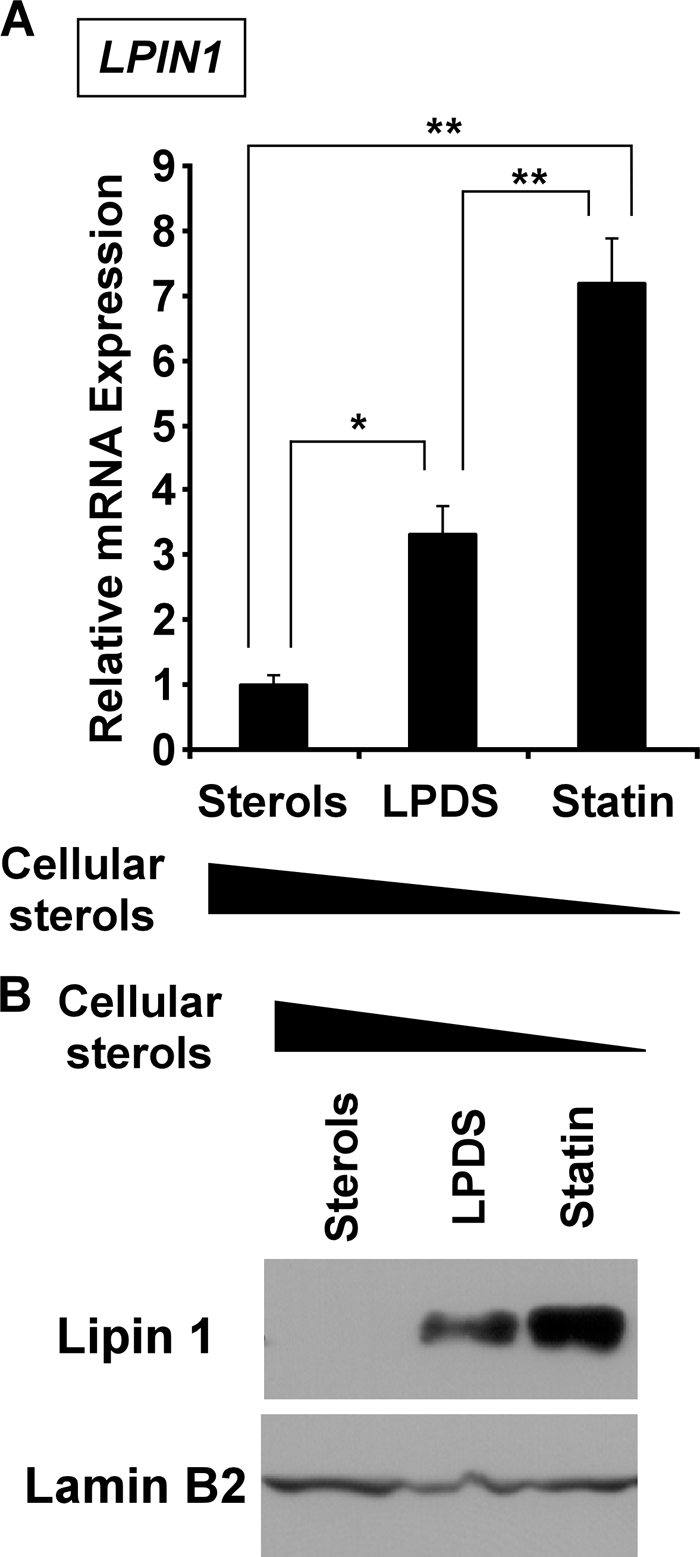
Lipin 1 expression is regulated by intracellular sterols in Huh7 cells. Huh7 cells were cultured in medium containing sterols, LPDS, or statin for 24 h. A, LPIN1 mRNA levels were normalized to those of 36B4 mRNA and are expressed relative to the normalized values of cells in cultured sterol-containing medium, set at 1. All values are expressed as means ± S.E. (n = 3). The statistical significance of LPDS or statin treatments versus sterols is indicated as follows: * (p < 0.05) or ** (p < 0.01). B, cell extracts were prepared, and aliquots (50 μg (for lipin 1) or 30 μg (for lamin B2) of protein/lane) were subjected to SDS-PAGE. Immunoblots were probed with anti-lipin-1 antibody or anti-lamin B2 antibody. The experiments were repeated three times.
SREBP-1 Gene Knockdown Affects Lipin 1 Expression
Many studies have reported that the SREBP transcription factors control the gene expression associated with lipid metabolism in response to cellular sterol levels (13). Therefore, we assumed that the LPIN1 gene is regulated by SREBP. We suppressed the expression of the endogenous SREBP gene in Huh7 cells using a SREBP-specific siRNA and examined the expression of LPIN1. Huh7 cells, cultured in LPDS medium to activate the SREBPs (SREBP-1 and SREBP-2), were treated with siRNAs. The mRNAs encoding SREBP-1a and SREBP-1c were reduced to ∼0.3-fold or to ∼0.6-fold, respectively, in cells transfected with SREBP-1 siRNA compared with those of the control cells (Fig. 2A). SREBP-2 mRNA was reduced to ∼0.2-fold in cells transfected with SREBP-2 siRNA. Consistent with the reduction in SREBP mRNA, the levels of SREBP protein were reduced in cells transfected with siRNA for the SREBPs compared with those of the control cells (Fig. 2B). We next examined whether the mRNAs of known SREBP target genes were reduced when Huh7 cells were transfected with siRNA to inhibit the expression of the corresponding genes. The expression of stearoyl-CoA desaturase mRNA, which is encoded as an SREBP-1 target gene, was reduced to ∼0.6-fold in the SREBP-1 siRNA-treated cells (Fig. 2C). In SREBP-2 siRNA-treated cells, the mRNA levels of 3-hydroxy-3-methylglutaryl coenzyme A reductase, a known target gene of SREBP-2, were reduced to ∼0.5-fold. We inferred from these results that the SREBP siRNAs functioned effectively and in a subtype-specific manner.
FIGURE 2.

Knockdown of SREBP-1 reduces LPIN1 expression in Huh7 cells. Huh7 cells were transfected with 25 nm control (cont), SREBP-1 (S-1), or SREBP-2 (S-2) siRNA under LPDS conditions. A, C, and D, total RNA was extracted for analysis by real time RT-PCR 24 h after transfection. All values are expressed as means ± S.E. (n = 3). Target mRNA levels were normalized to cyclophilin A mRNA and are expressed relative to the values for cells transfected with control siRNA (cont), set at 1. The statistical significance of SREBP siRNA versus control siRNA is indicated as follows: * (p < 0.05) or ** (p < 0.01). N.S., not significant. B, 15 h after transfection, N-acetyl-Leu-Leu-norleucinal was added to a final concentration of 25 μg/ml, and the cells were harvested 1 h later. Aliquots (10 μg of protein/lane) were subjected to SDS-PAGE, and immunoblots were probed with anti-SREBP-1, anti-SREBP-2, or anti-lamin B2 antibody. The experiments were repeated three times. E, 48 h after transfection, cell extracts were prepared, and aliquots (50 μg of protein/lane) were subjected to SDS-PAGE. Immunoblots were probed with anti-lipin-1 antibody or anti-lamin B2 antibody. The experiments were repeated three times.
We examined LPIN1 mRNA levels to analyze whether knocking down SREBPs reduces LPIN1 expression. Quantitative RT-PCR demonstrated that LPIN1 mRNA levels were reduced to ∼0.6-fold after transfection with SREBP-1 siRNA, whereas LPIN1 mRNA did not change in cells transfected with SREBP-2 siRNA (Fig. 2D). We also examined the lipin 1 protein in a Western blotting experiment. Consistent with the results for mRNA, the level of lipin 1 protein was reduced in SREBP-1-knockdown cells compared with that in the control cells (Fig. 2E). These results indicate that endogenous lipin 1 expression is regulated by SREBP-1.
Transcription Regulation of Human LPIN1 Promoter by Intracellular Sterols
To determine the transcription regulatory regions in the human LPIN1 gene that are affected by intracellular sterols, we cloned this gene from human genomic DNA and constructed a luciferase reporter plasmid containing its 5′-flanking region (nucleotides −2571 to +46). The construct was transiently transfected into HepG2 cells, and the cells were cultured with sterols, LPDS, or statin for 20 h. Fig. 3A shows that the promoter activity of the LPIN1−2571 promoter-reporter gene was significantly induced in cells cultured with LPDS or statin compared with that in cells cultured with sterols. We then constructed various deleted versions of the promoter-reporter construct and performed luciferase assays (Fig. 3A). A significant increase in luciferase activity was observed with each of two reporter genes, LPIN1−2571 and LPIN1−2428, using LPDS-containing and statin-containing media, whereas there was no increase with the LPIN1−2378 construct. These results strongly suggest that the region between nucleotides −2428 and −2378 contains the cis-acting element necessary for sterol-mediated transcriptional regulation.
FIGURE 3.

The region between nucleotides −2428 and −2378 of the human LPIN1 promoter contains sequences that mediate the induction of LPIN1 by sterol depletion. A, HepG2 cells were transfected with luciferase reporter constructs containing the indicated position of the 5′-flanking region of the LPIN1 promoter, together with pcDNA3 and pSV-β-galactosidase. Four hours after transfection, the cells were cultured in medium containing sterols, LPDS, or statin. After incubation for 20 h, the cells were harvested, and the luciferase activity was measured and normalized to the β-galactosidase activity. Values are expressed as -fold induction of the sterols (the value when PGV-B was transfected), set at 1. Values represent means ± S.E. (n = 3). Significant differences in the luciferase activities of cells treated with LPDS or statin compared with that of cells treated with sterols were determined using Dunnett's test and are indicated by asterisks (**, p < 0.01). B, schematic representation of the human LPIN1 gene between nucleotides −2428 and −2378, illustrating the SRE motif and the NF-Y-binding site. The SRE motif and NF-Y-binding site are conserved in the human and mouse LPIN1 promoters. Conserved nucleotides are indicated by asterisks.
Based on these results, we hypothesized that the human LPIN1 promoter is a direct target for SREBP-1. The preferred binding site for SREBP-1 is known as an SRE (17, 20). An alignment of the LPIN1 promoter sequences (nucleotides −2428 to −2378) of the human and mouse is shown in Fig. 3B. In a comparison of the sequences of these two species, we found that the SRE motif located between nucleotides −2413 and −2404 in the human promoter is highly conserved. Interestingly, an NF-Y-binding site is located between nucleotides −2386 and −2382 in the human LPIN1 promoter. This regulatory element perfectly matches that in the mouse promoter. Previous work has reported that SREs are located in close proximity to other positive transcription factor-binding elements, such as either NF-Y or Sp1, which are apparently essential for the optimal regulation of sterol-sensitive genes (20). The conservation of these elements suggested that this was likely to be an important regulatory sequence.
SRE and NF-Y-binding Site in the LPIN1 Promoter Are Responsible for Sterol-mediated Transcriptional Regulation
To test the hypothesis that the SRE motif and the NF-Y-binding site are responsible for LPIN1 regulation by sterols, we introduced a mutated version of these elements into the human LPIN1 promoter and performed luciferase assays (Fig. 4A). HepG2 cells were cotransfected with one of the reporter gene constructs and an expression plasmid for either human SREBP-1a-(1–460) or human SREBP-1c-(1–436) or empty vector. As under sterol-depleted conditions, the luciferase activity from the LPIN1−2571 promoter-reporter construct significantly increased in the presence of nSREBP-1a or nSREBP-1c compared with the luciferase activity in the presence of the empty vector (Fig. 4B). In contrast, mutated constructs of either the SRE (SREmut) or NF-Y-binding site (NF-Ymut) resulted in only 10% of the wild-type (LPIN1−2571) luciferase activity. A construct with mutations at both the SRE and NF-Y-binding site (SRE/NF-Ymut) caused a marked reduction in or complete abolition of luciferase activity. We also performed the luciferase assay with all the mutated constructs under sterol-depleted conditions, and the results were consistent with the results for SREBP-1 overexpression described above (supplemental Fig. S1).
FIGURE 4.

SREBP-1 and NF-Y are necessary for the activation of LPIN1 transcription. A, scheme representing the luciferase reporter gene construct containing the LPIN1 promoter sequence. Wild-type and mutated SRE or NF-Y-binding site sequences are shown. B, reporter constructs were cotransfected into HepG2 cells with pcDNA3 (mock), SREBP-1a (residues 1–460; nSREBP1a), or SREBP-1c (residues 1–436; nSREBP1c) expression vector. Twenty-four hours after transfection, the cells were harvested, and the luciferase activity was measured and normalized to the β-galactosidase activity. Values are expressed as -fold induction relative to the mock (the value when PGV-B was transfected), set at 1. Significant differences in the luciferase activities of nSREBP1a or nSREBP1c compared with the mock were determined using Dunnett's test and are indicated by asterisks (**, p < 0.01). Values represent means ± S.E. (n = 4). C, HepG2 cells were cotransfected with LPIN1−2571, pcDNA3-NF-YA29, and pSV-β-galactosidase, as described under “Experimental Procedures.” Four hours after transfection, the cells were treated with sterols, LPDS, or statin for 20 h and harvested. Values are expressed as -fold induction relative to the value observed in cells treated with sterols when no NF-YA29 had been transfected, set at 1. Significant differences in the values when compared with the value for cells not transfected with NF-YA29 and treated with statin were determined using Dunnett's test and are indicated by asterisks (**, p < 0.01). D, SL2 cells were set up and transfected with 300 ng of LPIN1−2571 and 20 ng of pPacβ-gal together with the indicated amounts of the following DNAs: 20 ng of pPacNF-YA, 20 ng of pPacNF-YB, and 20 ng of pPacNF-YC or 10 ng of pPac-nSREBP1a, as indicated. The total amount of DNA in each well was adjusted to 390 ng by adding the empty pPac vector. Twenty-four hours after transfection, the cells were harvested, and the luciferase activity was measured and normalized to the β-galactosidase activity. Values are expressed as -fold induction relative to the mock, set at 1. Significant differences in the luciferase activities of nSREBP1a, NFYA/YB/YC, or nSREBP1a/NFYA/YB/YC compared with the mock were determined using Dunnett's test and are indicated by asterisks (*, p < 0.05). Values represent means ± S.E. (n = 3).
To investigate the role of NF-Y in the effects of sterol depletion on the LPIN1 promoter, a dominant negative NF-YA mutant expression vector, NF-YA29, was cotransfected with the LPIN1−2571 promoter construct into HepG2 cells. NF-Y is a heteromeric transcription factor consisting of at least three subunits (NF-YA, NF-YB, and NF-YC) (27, 28). NF-YB and NF-YC form a tight complex, and this formation is a prerequisite for NF-YA binding to form NF-Y. NF-YA29, in which three amino acids in the DNA-binding domain of NF-YA have been mutated, forms a complex with NF-YB and NF-YC, rendering it functionally inactive as a transcription factor. As shown in Fig. 4C, NF-YA29 reduced the induction of the LPIN1 promoter by sterol depletion. These results demonstrate that both the SRE and the NF-Y-binding site are important in the regulation of LPIN1 transcription.
Having demonstrated that SREBP-1 and NF-Y are required for sterol responsiveness, we examined the ability of NF-Y to activate the LPIN1 gene together with SREBP-1 directly. For this purpose, we took advantage of a modified co-transfection assay system in Drosophila SL2 cells. The cell line does not express functional equivalents of several mammalian transcriptional regulatory proteins, including the active endogenous SREBPs and NF-Y (29). Therefore, it is an ideal cell-based assay system for the analysis of transcription factor requirements for promoter activation, because it provides a negative background (30). Fig. 4D shows the results for co-transfection assays in SL2 cells, where we evaluated the roles of NF-Y and SREBP-1a in transcriptional activation of the LPIN1 gene promoter. When the LPIN1−2571 promoter-reporter construct was co-transfected with pPac-nSREBP-1a into Drosophila SL2 cells, promoter activity was not affected. Additionally, this did not change when all three NF-Y subunits were transfected with the reporter construct. However, the luciferase activity were increased up to 2.2-fold by co-transfection of SREBP-1a and NF-Y. These results are consistent with our mammalian cell experiments and also indicate that NF-Y can function together with SREBP to transactivate the LPIN1 promoter.
SREBP-1 and NF-YA Bind Directly to Each cis-Acting Element in the LPIN1 Promoter
EMSAs of nuclear extracts prepared from LPDS-treated Huh7 cells were performed to determine whether SREBP-1 binds to the SRE in the LPIN1 promoter. When the LPIN1 SRE was used alone, a protein-DNA complex was detected (Fig. 5A, lane 2). This complex was disrupted by increasing amounts (10- or 100-fold excess) of unlabeled self-competitor (LPIN1) or the LDLR SRE (positive control) but not by the mutated SRE (LPIN1mut) probe (lanes 3–8). Supershift analysis was then performed to identify the proteins bound to the SRE. A polyclonal antibody directed against SREBP-1 resulted in the disappearance of the protein-DNA complex band, whereas a control antibody had no significant effect (lanes 9 and 10). These results demonstrate that SREBP-1 binds to the LPIN1 SRE at nucleotides −2413 to −2404.
FIGURE 5.

SREBP-1 and NF-YA bind to sequences in the promoter of the human LPIN1 gene. A, a radiolabeled DNA probe corresponding to nucleotides −2413 to −2404 of the LPIN1 promoter was incubated with nuclear extracts, with or without an excess of unlabeled probe corresponding to the LPIN1 SRE (LPIN1), the mutated SRE (LPIN1mut), or the identified SRE from the human LDLR gene (positive control). Supershift experiments were performed with anti-SREBP-1 or anti-glyceraldehyde-3-phosphate dehydrogenase (control) antibody. The closed arrowheads indicate the specific shifted bands. The experiments were repeated twice. B, a radiolabeled DNA probe corresponding to nucleotides −2386 to −2382 of the LPIN1 promoter was incubated with nuclear extracts, with or without an excess of unlabeled probe corresponding to the LPIN1 NF-Y-binding site (LPIN1), the mutated NF-Y-binding site (LPIN1mut), or the consensus binding site for NF-Y (Positive control). Supershift experiments were performed with anti-NF-YA or anti-PDI (Control) antibody. The closed and open arrowheads indicate the specific shifted bands and the supershifted bands, respectively. The experiments were repeated twice.
To investigate DNA binding activity of NF-Y at the NF-Y-binding site of the LPIN1 promoter, an EMSA was performed using this response element. A specific protein-DNA complex was detected (Fig. 5B). The complex was abolished by the addition of an unlabeled NF-Y DNA probe and was supershifted by the addition of anti-NF-YA antibody, confirming that NF-YA binds to the NF-Y-binding site of LPIN1. In a competition assay using the mutated DNA fragment, the protein-DNA complex had no significant effect. These results demonstrate that NF-Y binds to the NF-Y-binding site at nucleotides −2386 to −2382 of the LPIN1 promoter.
The binding of SREBP-1 to the LPIN1 SRE or NF-Y to the NF-Y-binding site in cells was estimated by a ChIP assay. After the chromatin had been cross-linked in LPDS-treated Huh7 cells, it was sheared by sonication. DNA-protein complexes were immunoprecipitated with antibodies directed against SREBP-1, NF-YA, or rabbit IgG (negative control). The precipitated cis elements (including SRE and the NF-Y-binding site) were detected by PCR amplification of the LPIN1 promoter fragment (nucleotides −2537 to −2345), which included the SRE (nucleotides −2413 to −2404) and the NF-Y-binding site (nucleotides −2386 to −2382). Specific amplification was detected when antibody directed against SREBP-1 or NF-YA was used but not when the rabbit IgG was used (Fig. 6). These results indicate that SREBP-1 and NF-YA bind to the cis elements in the LPIN1 promoter in Huh7 cells.
FIGURE 6.

ChIP assays reveal that SREBP-1 and NF-YA bind to the SRE and NF-Y-binding sites in Huh7 cells, respectively. ChIP assays were performed using LPDS-treated Huh7 cells. Soluble chromatin was immunoprecipitated with preimmune rabbit IgG, anti-SREBP-1, or anti-NF-YA antibody. Immunoprecipitates were subjected to PCR with a primer pair specific to the LPIN1 promoter. As a negative control, a second set of primers was used to amplify another genomic region that was not expected to interact with SREBP-1 or NF-YA. PCR was performed on the total chromatin input. The experiments were repeated three times.
Increase in Lipin 1 Protein Induced by Sterol Depletion Mediates TG Accumulation through Its PAP1 Activity
Lipin 1 has two distinct functions in lipid metabolism according to its subcellular localization (1). In the nucleus, lipin 1 acts as a transcriptional coactivator linked to mitochondrial fatty acid oxidative metabolism. In the cytoplasm, lipin 1 exhibits PAP1 activity, playing a role in TG and phospholipid biosyntheses. How does lipin 1 function in the regulation of lipid metabolism in cells? To address this question directly, we determined how the subcellular localization of lipin 1 is affected by sterol depletion. Huh7 cells were cultured in various amounts of sterol for 24 h, and extracts of these cells were fractionated into cytosol, membranes (including the endoplasmic reticulum and mitochondria), and nuclei using the Qproteome cell compartment kit from Qiagen, according to the manufacturer's instructions. As shown in Fig. 7A, the increase in lipin 1 protein induced by sterol depletion was largely observed in the cytosol and membranes. Conversely, the amount of lipin 1 in the nucleus was not modulated by sterol. These results suggest that sterol depletion affects the cellular localization/distribution of PAP1. To determine whether the increased lipin 1 induced by sterol depletion in the cytosol affects PAP1 activity, we measured the PAP1 activity in Huh7 cells treated with various amounts of sterol. As shown in Fig. 7B, PAP1 activity was induced 2.3-fold in LPDS medium relative to those in sterol-containing medium. Furthermore, in statin-containing medium, PAP1 activity increased 3.1-fold. These results indicate that PAP1 activity is regulated in a sterol-dependent manner.
FIGURE 7.

Sterol-mediated lipin 1 expression modulates triglyceride accumulation through its PAP1 activity in Huh7 cells. A, Huh7 cells were cultured in medium containing sterols, LPDS, or statin for 24 h. Cell extracts were fractionated using the Qiagen Qproteome cell compartment kit, and aliquots (30 μg of protein/lane) were subjected to SDS-PAGE. Immunoblots were probed with anti-lipin-1 antibody. The experiments were repeated three times. B, Huh7 cells were cultured in medium containing sterols, LPDS, or statin for 48 h. PAP1 activity was measured using the cytosolic fraction, as described under “Experimental Procedures.” The statistical significance of statin versus sterols is indicated by asterisks (**, p < 0.01). Values represent means ± S.E. (n = 3). C, Huh7 cells were transfected with 25 nm control siRNA, LPIN1 siRNA 1 (siRNA#1), or LPIN1 siRNA 2 (siRNA#2). Forty-eight hours after transfection, the cells were cultured in medium containing sterols or statin. After incubation for 48 h, cell extracts were prepared, and aliquots (50 μg of protein/lane) were subjected to SDS-PAGE. Immunoblots were probed with anti-lipin-1 antibody or anti-lamin B2 antibody. The experiments were repeated three times. D, Huh7 cells were transfected with each siRNA and cultured in medium containing sterols or statin for 72 h, as in C. The cellular TG content was measured and normalized to the total protein content. The statistical significance of statin versus sterols is indicated by asterisks (**, p < 0.01). N.S., not significant.
It has previously been reported that SREBP-1 elevates the mRNA levels of its known target genes, which are related to fatty acid and TG biosynthesis in hepatocytes, leading to steatosis in vivo (20). Therefore, we postulated that lipin 1 protein affects TG synthesis through its PAP1 activity induced by SREBP-1. We found that the mRNA levels of fatty acid synthase and stearoyl-CoA desaturase, rate-limiting enzymes in de novo lipogenesis, were induced in Huh7 cells cultured with statin (supplemental Fig. S2). On the other hand, the mRNA levels of PPARα and PGC-1α, important factors in mitochondrial fatty acid oxidative metabolism, were not affected by statin-containing medium (supplemental Fig. S2).
To determine whether the increased lipin 1 induced by sterol depletion affects TG synthesis, we investigated the TG accumulation in Huh7 cells treated with LPIN1 siRNA. Before examining TG accumulation, we suppressed the LPIN1 gene product with siRNA. Using quantitative RT-PCR, we demonstrated that LPIN1 mRNA levels decreased significantly after transfection with LPIN1 siRNA (number 1 or 2) (supplemental Fig. S3). We further examined whether lipin 1 protein is induced by sterol depletion in LPIN1 siRNA-treated cells. Our results show that sterol-induced lipin 1 protein was reduced in cells transfected with LPIN1 siRNA (number 1 or 2) compared with that in the control cells (Fig. 7C). Finally, Huh7 cells were transfected with either control or LPIN1 siRNA, and the levels of intracellular TG were measured. The cellular TG contents were increased up to 1.6-fold after treatment with statin when the cells were transfected with nonspecific control siRNA (Fig. 7D). However, when the cells were transfected with LPIN1 siRNA, treatment with statin hardly affected cellular TG levels. These results show that the lipin 1 induced by sterol depletion modulates TG accumulation.
DISCUSSION
Lipin 1 protein has dual cellular functions, as a PAP1 in de novo lipogenesis and as a transcriptional coactivator in fatty acid oxidase gene expression. Interestingly, these two functions are totally contradictory in lipid metabolism. The present studies validate the human LPIN1 promoter as an SREBP-1/NF-Y target and provide several novel insights into cellular response to sterol depletion, with regard to expression of lipin 1. In Huh7 hepatoblastoma cells, sterol depletion induces the expression of LPIN1 mRNA and protein (Fig. 1). The suppression of SREBP-1 by siRNA indicated that SREBP-1 controls LPIN1 expression (Fig. 2). We also demonstrated the up-regulation of LPIN1 mRNA with the addition of T0901317 to Huh7 cells (supplemental Fig. S4). T0901317 is a compound that induces SREBP-1c through the nuclear receptor, liver X receptor. Therefore, our findings suggest that lipin 1 is involved in de novo lipogenesis via SREBP-1.
SREBP-1 activates transcription of genes involved in fatty acid biosynthesis, such as the genes encoding acetyl-CoA carboxylase, fatty acid synthase, ELOVL6 (elongation of very long chain fatty acid-like 6), and stearoyl-CoA desaturase (Fig. 8) (19, 31). Ericsson et al. (32) reported that SREBP-1 also regulates the expression of mitochondrial glycerol-3-phosphate acyltransferase, which catalyzes the initial step in glycerolipid biosynthesis. In this pathway, lipin 1 acts as a PAP1, catalyzing a key step in the synthesis of glycerolipids (1, 33). Interestingly, enhanced lipin 1 expression in adipocytes increased the mRNA of diacylglycerol acyltransferase, which is a microsomal enzyme that plays a central role in the metabolism of cellular diacylglycerol lipids (34). Furthermore, lipin 1 overexpression stimulated the expression of mRNAs encoding critical enzymes of fatty acid (acetyl-CoA carboxylase, fatty acid synthase, and stearoyl-CoA desaturase). These observations suggest that SREBP-1 as the global lipid regulator promotes cellular TG accumulation effectively through lipin 1, which is a novel target gene of SREBP-1.
FIGURE 8.

Pathways of fatty acid and triglyceride syntheses from acetyl-CoA. SREBP-1 is a key regulator of lipogenic gene expression and promotes cellular TG accumulation. ACC, acetyl-CoA carboxylase; FAS, fatty acid synthase; ELOVL6, elongation of very long chain fatty acid-like 6; SCD, sterol-CoA desaturase; GPAT, glycerol-3-phosphate acyltransferase; LPIN1, lipin 1; DGAT, diacylglycerol acyltransferase.
Ubiquitous transcription factor NF-Y is also an important regulator for LPIN1 gene expression. NF-Y binds to NF-Y-binding sites in the promoter region of a variety of genes involved in early mouse development and cell cycle progression (28, 35). The NF-Y complex comprises three subunits, NF-YA, NF-YB, and NF-YC, all required for DNA binding. SREBP-mediated induction of target gene expression occurs in concert with the binding of additional coregulatory NF-Y to the promoter, resulting in synergistic levels of transcriptional activation (20). NF-Y-binding sites are usually found in close proximity to SREs (usually 15 bases around the SRE) in the promoters of the SREBP target genes. In the human LPIN1 gene, the distance between the SRE and the NF-Y-binding site is around 17 bp, and these two cis-acting elements are the essential regions for the transactivation of the LPIN1 promoter by sterol depletion. Consistent with previous studies, we infer that SREBP-1 and NF-Y coordinately control the transcriptional activity in the LPIN1 promoter.
Fasting markedly reduces the amount of SREBP-1 in mouse liver nuclei, with corresponding reductions in the mRNAs of fatty acid biosynthetic enzymes (36). Finck et al. (9) reported that lipin 1 expression was induced by fasting in mouse liver. We are aware that their findings are apparently not in accordance with our results. In fact, however, we revealed that lipin 1 expression was regulated by SREBP-1 in hepatoblastoma cells. Hepatic lipin 1 expression is also increased in diabetic db/db mice, in which hepatic SREBP-1 expression and activity are elevated (9, 37). Horton et al. (18) have shown by microarray analysis that LPIN1 mRNA expression is increased in the livers of nuclear SREBP-1a transgenic mice. These observations support the novel mechanism by which SREBP-1 controls lipin 1 expression in vivo. Further investigation will be necessary to determine the source of the ambiguity. To address the question about the differential regulation mechanism of LPIN1 gene expression during fasting and nonfasting states, we are currently performing a different experimental approach.
Lipin 1 is abundantly expressed in adipose tissue and plays roles in lipid and glucose homeostasis (2, 3). We show that lipin 1 expression is regulated by sterol depletion in human liposarcoma SW872 cells (supplemental Fig. S5) (38). These results suggest that lipin 1 induced by sterol depletion modulates lipogenesis in adipocyte cells. Lipin 1 expression in adipocytes increases in response to treatment with TZDs, which are high affinity ligands of PPARγ (11). PPARγ is a key regulator of adipocyte differentiation, and PPARγ ligands (including TZDs) induce adipocyte differentiation (39, 40). Interestingly, SREBP-1 is highly expressed in adipocytes and enhances its own expression during their differentiation. Thus, the activation of PPARγ by TZDs accelerates adipocyte differentiation and induces triglyceride accumulation through the expression of genes involved in adipogenesis, such as SREBP-1. On the other hand, SREBP-1 regulates the expression of PPARγ during adipocyte differentiation (39, 40). It was reported that SREBP-1 binds to the PPARγ promoter and directly induces transcription of PPARγ. In addition, SREBP-1 controls the expression of genes involved in lipid metabolism, such as those for lipoprotein lipase, acetyl-CoA carboxylase, and fatty acid synthase, which could lead to the generation of natural activators and ligands for PPARγ. It follows from what has been mentioned above that SREBP-1 and PPARγ regulate the expression of each other during adipocyte differentiation and promote the differentiated state of adipocytes effectively. These observations raise the possibility that the observed effects of TZDs on lipin 1 expression may occur through the same mechanism as the induction of lipin 1 by SREBP-1 demonstrated in this study. Adipocytic lipin 1 expression is also enhanced by treatment with harmine, a regulator of PPARγ expression. This suggests that harmine acts via the same mechanism as TZDs (12).
In conclusion, we have demonstrated that intracellular sterols modulate the expression of the human LPIN1 gene via SREBP-1 and NF-Y. Furthermore, we have clarified that the induced expression of lipin 1 by sterol depletion controls TG accumulation through its PAP1 activity in the cytosol. This novel mechanism for the regulation of human lipin 1 may be involved in energy storage or utilization in metabolic processes.
Supplementary Material
This work was supported by the Program of Fundamental Studies in Health Sciences of the National Institute of Biomedical Innovation.

The on-line version of this article (available at http://www.jbc.org) contains supplemental Figs. S1–S5.
- TG
- triglyceride(s)
- SRE
- sterol-response element
- SREBP
- sterol regulatory element-binding protein
- NF-Y
- nuclear factor Y
- PPAR
- peroxisome proliferator-activated receptor
- PGC-1α
- PPARγ coactivator-1α
- TZD
- thiazolidione drug
- DMEM
- Dulbecco's modified Eagle's medium
- LPDS
- lipoprotein-deficient serum
- EMSA
- electrophoretic mobility shift assay
- ChIP
- chromatin immunoprecipitation
- siRNA
- small interfering RNA
- RT
- reverse transcription.
REFERENCES
- 1.Reue K., Zhang P. (2008) FEBS Lett. 582, 90–96 [DOI] [PMC free article] [PubMed] [Google Scholar]
- 2.Péterfy M., Phan J., Xu P., Reue K. (2001) Nat. Genet. 27, 121–124 [DOI] [PubMed] [Google Scholar]
- 3.Lan H., Rabaglia M. E., Stoehr J. P., Nadler S. T., Schueler K. L., Zou F., Yandell B. S., Attie A. D. (2003) Diabetes 52, 688–700 [DOI] [PubMed] [Google Scholar]
- 4.Reue K., Péterfy M. (2000) Curr. Atheroscler. Rep. 2, 390–396 [DOI] [PubMed] [Google Scholar]
- 5.Phan J., Reue K. (2005) Cell Metab. 1, 73–83 [DOI] [PubMed] [Google Scholar]
- 6.Han G. S., Wu W. I., Carman G. M. (2006) J. Biol. Chem. 281, 9210–9218 [DOI] [PMC free article] [PubMed] [Google Scholar]
- 7.Donkor J., Sariahmetoglu M., Dewald J., Brindley D. N., Reue K. (2007) J. Biol. Chem. 282, 3450–3457 [DOI] [PubMed] [Google Scholar]
- 8.Harris T. E., Huffman T. A., Chi A., Shabanowitz J., Hunt D. F., Kumar A., Lawrence J. C., Jr. (2007) J. Biol. Chem. 282, 277–286 [DOI] [PubMed] [Google Scholar]
- 9.Finck B. N., Gropler M. C., Chen Z., Leone T. C., Croce M. A., Harris T. E., Lawrence J. C., Jr., Kelly D. P. (2006) Cell Metab. 4, 199–210 [DOI] [PubMed] [Google Scholar]
- 10.Zhang P., O'Loughlin L., Brindley D. N., Reue K. (2008) J. Lipid Res. 49, 1519–1528 [DOI] [PMC free article] [PubMed] [Google Scholar]
- 11.Yao-Borengasser A., Rasouli N., Varma V., Miles L. M., Phanavanh B., Starks T. N., Phan J., Spencer H. J., 3rd, McGehee R. E., Jr., Reue K., Kern P. A. (2006) Diabetes 55, 2811–2818 [DOI] [PubMed] [Google Scholar]
- 12.Waki H., Park K. W., Mitro N., Pei L., Damoiseaux R., Wilpitz D. C., Reue K., Saez E., Tontonoz P. (2007) Cell Metab. 5, 357–370 [DOI] [PubMed] [Google Scholar]
- 13.Brown M. S., Goldstein J. L. (1997) Cell 89, 331–340 [DOI] [PubMed] [Google Scholar]
- 14.Brown M. S., Goldstein J. L. (1999) Proc. Natl. Acad. Sci. U.S.A. 96, 11041–11048 [DOI] [PMC free article] [PubMed] [Google Scholar]
- 15.Brown M. S., Ye J., Rawson R. B., Goldstein J. L. (2000) Cell 100, 391–398 [DOI] [PubMed] [Google Scholar]
- 16.Horton J. D. (2002) Biochem. Soc. Trans. 30, 1091–1095 [DOI] [PubMed] [Google Scholar]
- 17.Rawson R. B. (2003) Nat. Rev. Mol. Cell Biol. 4, 631–640 [DOI] [PubMed] [Google Scholar]
- 18.Horton J. D., Shah N. A., Warrington J. A., Anderson N. N., Park S. W., Brown M. S., Goldstein J. L. (2003) Proc. Natl. Acad. Sci. U.S.A. 100, 12027–12032 [DOI] [PMC free article] [PubMed] [Google Scholar]
- 19.Horton J. D., Goldstein J. L., Brown M. S. (2002) J. Clin. Invest. 109, 1125–1131 [DOI] [PMC free article] [PubMed] [Google Scholar]
- 20.Shimano H. (2001) Prog. Lipid Res. 40, 439–452 [DOI] [PubMed] [Google Scholar]
- 21.Ishimoto K., Tachibana K., Sumitomo M., Omote S., Hanano I., Yamasaki D., Watanabe Y., Tanaka T., Hamakubo T., Sakai J., Kodama T., Doi T. (2006) FEBS Lett. 580, 4929–4933 [DOI] [PubMed] [Google Scholar]
- 22.Ikeda Y., Yamamoto J., Okamura M., Fujino T., Takahashi S., Takeuchi K., Osborne T. F., Yamamoto T. T., Ito S., Sakai J. (2001) J. Biol. Chem. 276, 34259–34269 [DOI] [PubMed] [Google Scholar]
- 23.Tachibana K., Kobayashi Y., Tanaka T., Tagami M., Sugiyama A., Katayama T., Ueda C., Yamasaki D., Ishimoto K., Sumitomo M., Uchiyama Y., Kohro T., Sakai J., Hamakubo T., Kodama T., Doi T. (2005) Nucl. Recept. 3, 3. [DOI] [PMC free article] [PubMed] [Google Scholar]
- 24.Grimsey N., Han G. S., O'Hara L., Rochford J. J., Carman G. M., Siniossoglou S. (2008) J. Biol. Chem. 283, 29166–29174 [DOI] [PMC free article] [PubMed] [Google Scholar]
- 25.Grkovich A., Johnson C. A., Buczynski M. W., Dennis E. A. (2006) J. Biol. Chem. 281, 32978–32987 [DOI] [PubMed] [Google Scholar]
- 26.Martin A., Gomez-Muñoz A., Jamal Z., Brindley D. N. (1991) Methods Enzymol. 197, 553–563 [DOI] [PubMed] [Google Scholar]
- 27.Mantovani R., Li X. Y., Pessara U., Hooft van Huisjduijnen R., Benoist C., Mathis D. (1994) J. Biol. Chem. 269, 20340–20346 [PubMed] [Google Scholar]
- 28.Mantovani R. (1999) Gene 239, 15–27 [DOI] [PubMed] [Google Scholar]
- 29.Sanchez H. B., Yieh L., Osborne T. F. (1995) J. Biol. Chem. 270, 1161–1169 [DOI] [PubMed] [Google Scholar]
- 30.Magaña M. M., Koo S. H., Towle H. C., Osborne T. F. (2000) J. Biol. Chem. 275, 4726–4733 [DOI] [PubMed] [Google Scholar]
- 31.Kumadaki S., Matsuzaka T., Kato T., Yahagi N., Yamamoto T., Okada S., Kobayashi K., Takahashi A., Yatoh S., Suzuki H., Yamada N., Shimano H. (2008) Biochem. Biophys. Res. Commun. 368, 261–266 [DOI] [PubMed] [Google Scholar]
- 32.Ericsson J., Jackson S. M., Kim J. B., Spiegelman B. M., Edwards P. A. (1997) J. Biol. Chem. 272, 7298–7305 [DOI] [PubMed] [Google Scholar]
- 33.Carman G. M., Han G. S. (2009) J. Biol. Chem. 284, 2593–2597 [DOI] [PMC free article] [PubMed] [Google Scholar]
- 34.Péterfy M., Phan J., Reue K. (2005) J. Biol. Chem. 280, 32883–32889 [DOI] [PubMed] [Google Scholar]
- 35.Bhattacharya A., Deng J. M., Zhang Z., Behringer R., de Crombrugghe B., Maity S. N. (2003) Cancer Res. 63, 8167–8172 [PubMed] [Google Scholar]
- 36.Horton J. D., Bashmakov Y., Shimomura I., Shimano H. (1998) Proc. Natl. Acad. Sci. U.S.A. 95, 5987–5992 [DOI] [PMC free article] [PubMed] [Google Scholar]
- 37.Fukui K., Wada T., Kagawa S., Nagira K., Ikubo M., Ishihara H., Kobayashi M., Sasaoka T. (2005) Diabetes 54, 1958–1967 [DOI] [PubMed] [Google Scholar]
- 38.Wassef H., Bernier L., Davignon J., Cohn J. S. (2004) J. Nutr. 134, 2935–2941 [DOI] [PubMed] [Google Scholar]
- 39.Fajas L., Fruchart J. C., Auwerx J. (1998) Curr. Opin. Cell Biol. 10, 165–173 [DOI] [PubMed] [Google Scholar]
- 40.Rosen E. D. (2005) Prostaglandins Leukot. Essent. Fatty Acids 73, 31–34 [DOI] [PubMed] [Google Scholar]
Associated Data
This section collects any data citations, data availability statements, or supplementary materials included in this article.