Abstract
A quantitative analysis of myocardial mechanics is fundamental to understanding cardiac function, diagnosis of heart disease, and assessment of therapeutic intervention. Displacement encoding with stimulated-echo (DENSE) magnetic resonance imaging (MRI) technique was developed to track the three-dimensional (3D) displacement vector of discrete material grid points in the myocardial tissue. Despite the wealth of information gained from DENSE images, the current software only provides two-dimensional in-plane deformation. The objective of this study is to introduce a postprocessing method to reconstruct and visualize continuous dynamic 3D displacement and strain fields in the ventricular wall from DENSE data. An anatomically accurate hexagonal finite-element model of the left ventricle (LV) is reconstructed by fitting a prolate spheroidal primitive to contour points of the epi- and endocardial surfaces. The continuous displacement field in the model is described mathematically based on the discrete DENSE vectors using a minimization method with smoothness regularization. Based on the displacement, heart motion and myocardial stretch (or strain) are analyzed. Illustratory computations were conducted with DENSE data of three infarcted and one normal sheep ventricles. The full 3D results show stronger overall axial shortening, wall thickening, and twisting of the normal LV compared with the infarcted hearts. Local myocardial stretches show a dyskinetic LV in the apical region, dilation of apex in systole, and a compensatory increase in strain in the healthy basal region as a compensatory mechanism. We conclude that the proposed postprocessing method significantly extends the utility of DENSE MRI, which may provide a patient-specific 3D model of cardiac mechanics.
Keywords: magnetic resonance imaging, displacement-encoding with stimulated echo, heart motion analysis, finite element
noninvasive imaging techniques, such as magnetic resonance (MRI), X-ray computed tomography, and tissue Doppler, have been used as clinical tools for visualization and analysis of heart motion. These tools are essential for understanding the heart function in normal and disease states, as well as for diagnosis of heart disease, design of treatment, and assessment of therapeutic interventions. Among these imaging modalities, MRI-based techniques are often used for measuring myocardial motion and deformation. With use of radio-frequency (RF) pulse to alter the local magnetic properties of the tissue, tagged MRI generates grid lines that are embedded in the myocardium (26). By tracing the deformation of the tag lines recorded in cine images, myocardial displacement can be recovered (10, 11). Phase-contrast MRI has also been developed to measure the instantaneous velocity field in the myocardium (17, 22). The Eulerian description of the velocity, however, makes it difficult to track large tissue motion due to motion artifacts. The strain-encoded MRI yields through-plane strain in the myocardium, with limitation that the strain field is only two-dimensional (2D) (9, 21). An important concurrence of these various studies is that the strain field in the myocardium is three-dimensional (3D) and inhomogeneous, especially in heart disease, where the local passive and active mechanical properties of the myocardium change.
A method for tracking the displacement of the tissue by modulating and tracking the phase of magnetic spin has been developed (7). This phase-based method is also called displacement-encoded with stimulated-echo (DENSE) MRI (1–3). It combines the advantages of tagged MRI and phase-contrast MRI and directly provides 3D displacement vector of material grid points in the tissue with pixelwise spatial resolution. The postprocessing of the displacement-encoded images involves phase unwrapping, for which quality-map guided technique (5), adaptive phase unwrapping, and adaptive spatial filter techniques have been derived (24). The outcomes of the postprocess include spatial (X, Y, and Z) coordinates of a set of material grid points at the end-diastolic reference state and their displacement vectors at each time frame. In-plane strain maps and transmural circumferential strain curves during the cardiac cycle are also calculated. These direct parameters do not fully bring out the 3D information enclosed in the displacement vectors and are inadequate for detail mechanical analysis of heart function. For example, motion of the discrete material grid points provides an overview of heart deformation, which is not volumetric and not directly related to myocardial stress. A quantitative analysis of myocardial contractility requires a full 3D strain field, because the myocardium contracts in orientation that varies in the ventricular wall and does not lie in any one image plane (20).
The purpose of this study was to reconstruct and visualize a continuous deformation field in the ventricular wall and through the whole cardiac cycle from the DENSE displacement vectors of the material grid points. To present mechanical indexes, such as left ventricular (LV) deformation and stretch, a finite-element (FE) model was reconstructed from contour points of the epi- and endocardial surfaces. For each image frame, a continuous 3D displacement field was then generated mathematically based on the discrete DENSE vectors, and myocardial stretch was derived. The time-varying deformation was reconstructed for the whole cardiac cycle by interpolating the results of all of the frames with closed cubic splines. The proof of concept was demonstrated in four sheep (three with ischemic heart disease and one normal) as outlined below.
MATERIALS AND METHODS
DENSE MRI scanning and phase unwrapping.
The experiments were performed on a 1.5-T whole body scanner (Sonata, Siemens, Erlangen, Germany). The animal study protocol was reviewed and approved by the University of Pennsylvania School of Medicine Institutional Animal Care and Use Committee. In compliance with guidelines for humane care (National Institutes of Health publication no. 85-23, revised 1996), three adult male sheep (35–40 kg) were anesthetized with isoflurane; the electrocardiogram, arterial blood pressure, LV pressure, and pulmonary artery pressure were monitored throughout the procedure. A left thoracotomy was performed, and suture ligatures were placed around the left anterior descending artery and its second diagonal branch 40% of the distance from the apex to the base of the heart. Occlusion of these arteries at these locations reproducibly results in a moderately sized infarction involving slightly more than 20% of the LV mass at the anteroapex (16). The chest was closed, and the animal was allowed to recover.
Approximately 8 wk after infarction, the animals were again anesthetized and taken to the MRI. One uninfarcted animal was anesthetized and taken to the MRI to study normal cardiac mechanics. Electrocardiogram and respiratory air belt signals were used to trigger and gate data acquisition, respectively. The standard chest coil combined with the spine coil array was used to receive the RF signal, while the body coil was used for RF transmission.
Five consecutive short-axis slices were acquired over 10 systolic phases. The displacement encoding section was consecutively shifted over the systolic period at 20-ms interval, while image acquisition was fixed at end systole. The imaging parameters included matrix size of 256 × 256, field of view of 380 × 380 mm2, slice thickness of 12 mm, interleaved k-space acquisition with 64 echoes per heartbeat, fast gradient recalled echo readout of repetition time/echo time = 3 ms/2.2 ms, average of 5, displacement encoding moments of 0.85 radians/mm in-plane and 0.30 radians/mm through-slice, and total scan time of 15–20 min for the 5 slices (3).
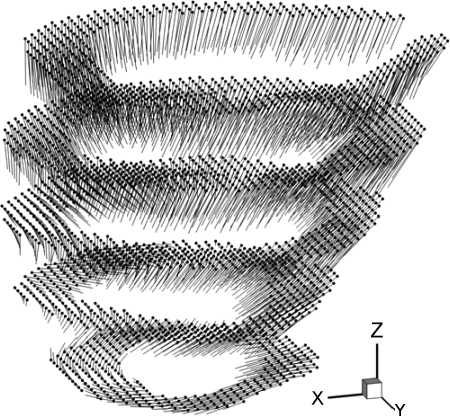
The DENSE MRI data sets were processed with software DENSEview (24). The analysis involves the following: 1) combination of multichannel images into three cine sets encoded in X, Y, and Z directions; 2) definition of LV wall by manually picking contour points on the epi- and endocardial surfaces; 3) unwrapping all of the phases with adaptive method for displacement vectors; and 4) calculation of the in-plane strain maps. The outputs include text files of the initial coordinates, displacement vectors (see Fig. 1) and strain at material grid points, and time history of transmural average strain on image planes. It also yields in-plane strain map and short-axis image slices. While the displacement vectors are full 3D, DENSEview does not give continuous displacement field in the myocardium and only displays the vector in 2D form at discrete material grid points on the image planes. The strains are also calculated on the image planes and are 2D. The lack of out-of-plane strain components limits the analysis of local myocardium function. For example, the principal shortening that describes the active contraction cannot be accessed as the myofiber architecture is not planar. In this study, a continuous 3D dynamic displacement field was reconstructed in the LV wall, with which the LV deformation was visualized and the strain indices were analyzed in detail.
Fig. 1.
Material grid points (dots) at the end-diastolic reference configuration and the displacement vectors (lines) extracted from displacement-encoded with stimulated echo (DENSE) magnetic resonance imaging (MRI) are shown with a normal sheep left ventricle (LV) at phase 2 in a 10-phase DENSE MRI sequence, corresponding to time t = 40 ms after end diastole. Phase interval = 20 ms.
FE model of LV.
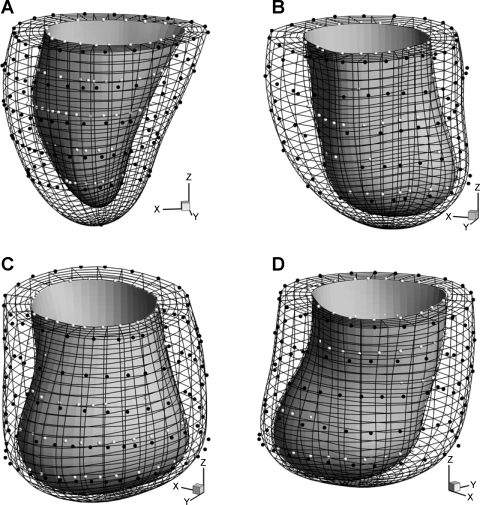
A FE mesh was employed to represent the geometry of LV and visualize the deformation. A Matlab program was written to read the coordinates of epi- and endocardial contour points (Fig. 2) of the image slices. The papillary muscles were excluded from the myocardium. The contour points were used to create FE model of LV, as described in appendix a. Similar to the algorithms of Young and Axel (25), Costa et al. (8), Li and Denney (14), and others, we used prolate spheroidal coordinates and cubic B-spline to fit primitive surfaces (w = wepi and w = wendo) to epi- and endocardial contour points, respectively. It is noted that, with proper choice of the parameters for the prolate spheroidal coordinates, the u, v, and w directions approximately overlap with the longitudinal (axial), circumferential, and radial (thickness) directions of the local ventricular wall, respectively. To minimize the geometric distortion, smoothness regularization was imposed (14). The objective function was in a quadratic form and can be minimized by solving a set of linear equations. A linear constraint was imposed on the fitting parameters Aij to ensure C2 continuity at the apex. The space bounded by the fitted epi- and endocardial surfaces was then divided into standard 8-node quadrilateral elements (Fig. 2) using a linear interpolation of the surface shape functions. The size and number of the elements were controlled by user-defined partition of u, v, and w coordinates of the model. It should be noted that the geometric fitting is independent of the subsequently generated FE mesh, unlike the mesh-dependent algorithm of Young and Axel (25). The FE mesh serves as a platform for visualization of heart motion and myocardial strains, and the mesh partition does not affect the reconstruction and analysis of the displacement and deformation.
Fig. 2.
Hexagonal finite element (FE) mesh of sheep LVs reconstructed from epicardial (white dots) and endocardial (black dots) contour points. A: normal sheep. B–D: infarcted sheep I, II, and III, respectively. Plots are made using the same scale.
Continuous displacement field.
A continuous 3D displacement field was reconstructed from the DENSE displacement vectors using a minimization method. As described in appendix b, the fitting was conducted in prolate spheroidal coordinates with displacement function f(u, v, w; tJ) for the Jth frame with time t = tJ. We opted to use the product of polynomial and triangular functions for f(u, v, w; tJ) to take advantage of analytic calculation of the smoothness regularization. The resulting objective function was quadratic, and the minimization was done by solving a set of linear equations. The dynamic displacement field was then approximated with a function f(u, v, w; t), which was obtained by an interpolated f(u, v, w; tJ) (J = 1,2,3,…) with close cubic spline through the cardiac cycle.
Deformation field.
Given a continuous representation of the displacement field, the deformation gradient F, tissue stretch tensor C (=FTF), and Green strain E [= (C − I)/2] were calculated in reference to the end-diastolic state, in prolate spheroidal coordinates. The mathematical formulation for stretch calculation in curvilinear coordinates is standard in continuum mechanics (14, 19). In this work, we focused on tissue stretches in circumferential, longitudinal, and radial direction, λvv, λuu, and λww, respectively. Physically, stretch in a direction N is calculated by λ =  and presents the deformed length of a unit line element in direction N in the reference configuration. We also analyzed the principal stretches (λmax, λmid, λmin) and the corresponding principal direction vectors (Nmax, Nmid, Nmin), which make the eigensystem of tensor
  (19). Note that λmin is equivalent to the maximum shortening of myocardium.
RESULTS
Geometric fitting.
In this batch of DENSE MRI scans, five short-axis slices were obtained of a sheep LV. For every slice, we manually selected 20–30 contour points on the epi- and endocardial surfaces, respectively. The total number of contour points was 100–150 for the entire surfaces. Since short-axis slices did not pass through the apex, we manually added epi- and endocardial apex points. For the cubic B-spline fitting function (Eq. A4), we found that 16 control points (Nu = Nv = 16) in u and v directions gave sufficiently good results. The weight γn in Eq. A2 was 1.0 for all contour points, and those in the regularization function Eq. A3 were γ0 = 0.0025, γu = γv = 0.00075, and γuu = γuv = γvv = 0.00025. The use of more control points increased the flexibility of the fitting function and reduced the fitting error (Eq. A2), but also led to local geometric distortion. The distortion can be smoothened by increasing the regularization weights, but results in less flexible shape function and increased fitting errors.
The total computational time was ∼15 s for surface fitting and mesh generation with a PC. Figure 2 shows hexagonal FE mesh for normal sheep and infarcted sheep M-I to M-III with IDH. The myocardial volume is 63.2, 77.9, 72.5, and 76.4 cm3 of normal sheep and infarcted sheep M-I to M-III, and the end-diastolic chamber volume is 43.9, 60.1, 100.1, and 85.0 ml, respectively. Compared with normal heart that remains elliptic in shape around the apex, the infarcted LVs have dilated spherical shape and no apex (6). The infarcted LV wall also shows significant thinning toward the apex, somewhat abruptly and locally for sheep M-III, and more gradually and uniformly for M-I and M-II.
Displacement field and deformation.
For each LV, displacement vectors were extracted from DENSE MRI scans at ∼2,500–3,500 material grid points (Fig. 1). For the displacement fitting function (Eq. A7), we selected NM = NL = NG = 6, NK = NI = 16, NJ = NQ = 7, and NP = NI = 6. The weights in Eqs. A8 and A9 were gi = 1.0, γ0 = γu = γv = γw = 0.005, γuu = γvv = γww = 0.001, and γuv = γuw = γvw = 0.0005. The effects of the weights on the fitting have been investigated previously (8, 25). In general, it is best to adjust the weights for individual data sets, according to the number of data points and their spatial distribution. The displacement fitting shape function (Eq. A7) consists of polynomial and triangular shape functions that span a complete functional space that describes arbitrary continuous displacement field. The convergence of the fitting is guaranteed by the completeness and linear independence of the shape functions. The fitting accuracy depends on the number of DENSE material grid points and their distribution, as well as the number of shape functions. It is further noted that the FE mesh reconstructed in the above section is merely used for visualization of the deformation, and it does not affect the reconstruction of displacement field.
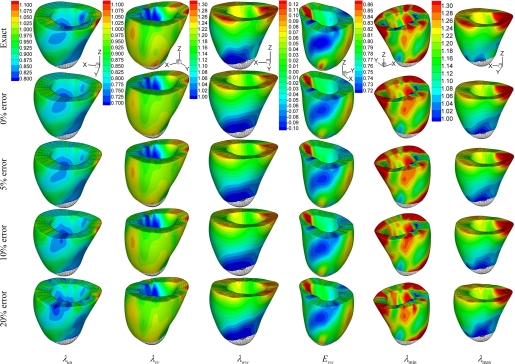
In appendix c, we validated the method and investigated the sensitivity to possible random error of DENSE data, using the normal sheep LV as a numerical phantom. The results are summarized in Table A1 of the relative root mean squared error (RMSE) and in Fig. A2 of the 3D stretches and strains. The observations are as follows. 1) The displacement field in the numerical phantom was successfully reconstructed from the discrete DENSE displacement vectors. 2) The relative RMSE were much higher for the strains than the stretches. 3) The spatial distribution of myocardial stretches and strains was well reproduced, with the random error of the DENSE data up to ±20%. 4) Although the RMSE increased with the error of the DENSE data, it did not show a tendency to amplify the error, indicating moderate sensitivity to the error.
Table A1.
Percent relative RMSE of reconstruction of deformation in normal sheep LV using artificial DENSE material grid points
| Displacement Vectors Input | x | λuu | λvv | λww | J | λmax | λmid | λmin | Euu | Evv | Eww | Euv | Euw | Evw | ||||||||||||||
|---|---|---|---|---|---|---|---|---|---|---|---|---|---|---|---|---|---|---|---|---|---|---|---|---|---|---|---|---|
| Relative RMSE (%) with artificial DENSE data T12 | ||||||||||||||||||||||||||||
| 0% random error | 0.50 | 0.78 | 1.22 | 2.24 | 0.45 | 2.01 | 0.98 | 1.28 | 3.7 | 5.8 | 12.2 | 18.3 | 20.2 | 26.4 | ||||||||||||||
| 5% random error | 0.78 | 0.91 | 1.44 | 2.41 | 0.69 | 2.65 | 1.04 | 1.51 | 5.7 | 9.1 | 13.8 | 21.1 | 25.3 | 30.3 | ||||||||||||||
| 10% random error | 0.82 | 1.03 | 1.69 | 2.50 | 1.23 | 2.78 | 1.27 | 1.93 | 6.4 | 10.6 | 20.2 | 26.1 | 30.5 | 41.0 | ||||||||||||||
| 20% random error | 1.02 | 1.48 | 2.15 | 2.92 | 2.22 | 2.93 | 1.79 | 2.25 | 9.2 | 13.7 | 24.3 | 39.2 | 35.1 | 48.4 | ||||||||||||||
| Relative RMSE (%) with artificial DENSE data T8 | ||||||||||||||||||||||||||||
| 0% random error | 0.36 | 0.68 | 1.02 | 2.13 | 0.43 | 1.98 | 0.92 | 1.12 | 3.6 | 5.7 | 11.3 | 17.5 | 18.7 | 22.9 | ||||||||||||||
| 5% random error | 0.60 | 0.89 | 1.37 | 2.23 | 0.62 | 2.64 | 0.94 | 1.50 | 5.6 | 8.6 | 13.6 | 19.0 | 24.8 | 29.4 | ||||||||||||||
| 10% random error | 0.84 | 0.92 | 1.58 | 2.40 | 1.03 | 2.68 | 1.11 | 1.67 | 5.8 | 10.0 | 21.6 | 22.5 | 31.2 | 41.2 | ||||||||||||||
| 20% random error | 0.98 | 1.41 | 1.87 | 2.89 | 1.75 | 2.75 | 1.49 | 1.92 | 8.4 | 12.1 | 23.2 | 36.7 | 33.1 | 47.3 | ||||||||||||||
x, Deformed position of finite element nodes; λuu, λvv, and λww: stretches in u (longitudinal), v (circumferential), and w (radial) directions; λmax, λmid, and λmin: maximum, middle, and minimum principal stretches, respectively; E, Green strain; J, relative volume change; RMSE, root mean square error; DENSE, displacement encoded with stimulated echo; T12 and T8, DENSE material grid points with slice thicknesses of 12 and 8 mm, respectively.
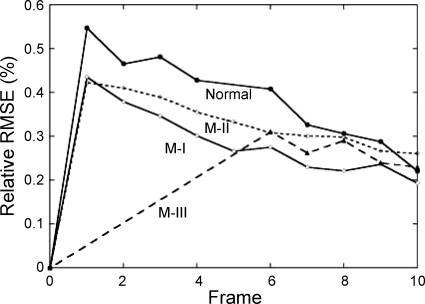
For a DENSE data set with ∼10 frames, the total computational time for reconstruction of displacement field was ∼90 s with a PC. The relative RMSE between the measured and predicted deformed position of the material grid points (Eq. A10) is plotted in Fig. 3 of normal sheep and infarcted sheep M-I to M-III. The relative RMSE reached maximum at the first three frames when the LV underwent the largest deformation, ∼0.5–0.6% for normal LV, but less for infarcted hearts that did not deformed as much. After coefficients (C , CJ, AJ, BJ) were obtained, we applied a displacement field (Eq. A7) on the FE model for visualization of LV motion and deformation. The myocardial stretches and the Green strain were computed.
Fig. 3.
Relative root mean squared error (RMSE) of the fitted deformed position of DENSE material grid points in normal and infracted (M-I, M-II, M-III) sheep LVs.
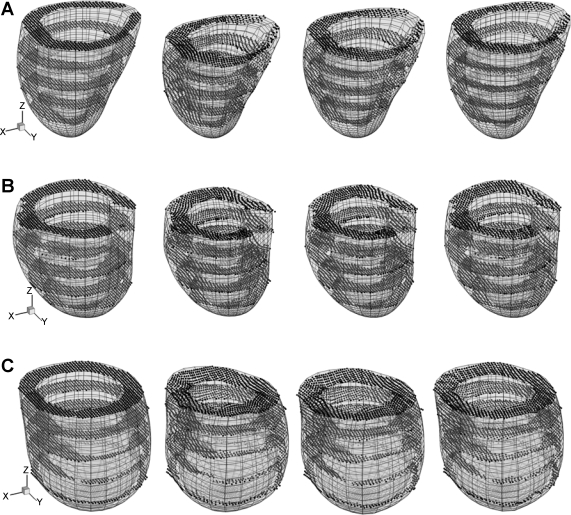
The deformed LV model of normal sheep and infarcted M-I and M-II is shown in Fig. 4, together with displaced DENSE material grid points. The image frames were 0, 40, 80, and 140 ms after end diastole. LV ejection volume (EV), quantified by the maximum reduction of the chamber volume, is estimated at 18.1, 18.2, and 11.8 ml, corresponding to ejection fraction (EF) of 41, 31, and 12%, respectively. It is noted that DENSE data of the first five frames of sheep M-III were lost, and the EV and EF were not obtained.
Fig. 4.
Deformation of LV reconstructed from DENSE material grid points (dots) at time t = 0, 40, 80, and 140 ms (from left to right) after end diastole. A: normal sheep. B: infarcted sheep M-I. C: infarcted sheep M-II. For each ventricle, the length scale and view angle are the same for all plots.
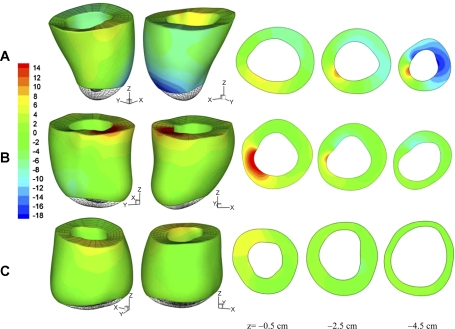
Contour of the circumferential twisting angle, i.e., the change of v coordinate of the material grid points, is shown in Fig. 5 of normal sheep and M-I and M-II, at time t = 40 ms after end diastole. Short-axial slices are plotted at z = −0.5 cm (close to the base), −2.5 cm (equatorial region), and −4.5 cm (near to the apex).
Fig. 5.
Circumferential twisting angle of myocardium at time t = 40 ms after end diastole. A: normal sheep. B: infarcted sheep M-I. C: infarcted sheep M-II. The value is plotted in degrees. Short-axial slices are shown at z = −0.5 cm (close to the base), −2.5 cm (middle region), and −4.5 cm (near to the apex). Positive (red color) and negative (blue) values correspond to counterclockwise and clockwise twisting (view from the base). Green color indicates very little twisting.
Myocardial stretches.
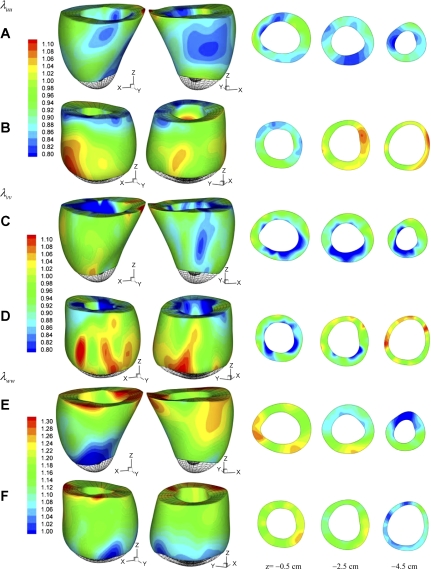
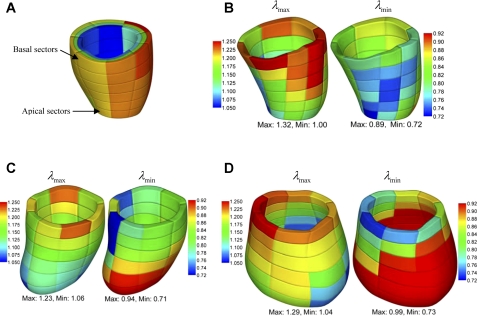
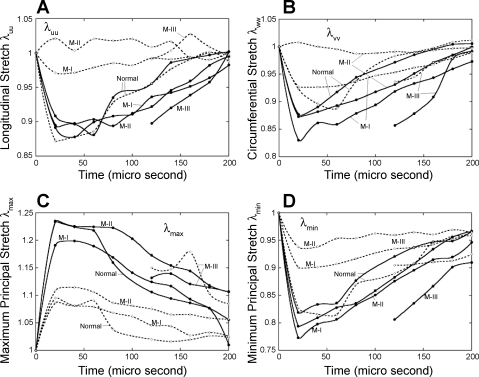
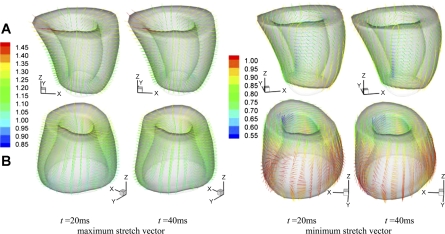
The local deformation of the myocardium can be described by material stretches. Figure 6 shows the spatial distribution of longitudinal stretch λuu, circumferential stretch λvv, and radial stretch λww of normal sheep and infarcted sheep M-II at t = 40 ms after end diastole. The short-axial slices are extracted at z = −0.5 cm (close to the base), −2.5 cm (equatorial region), and −4.5 cm (near to the apex). The maximum and minimum principal stretches, λmax and λmin, and the corresponding vectors were also analyzed. To give a more global overview of the stretches, we consider volumetric averages in 144 endocardial, midwall, and epicardial sectors, as shown in Fig. 7A in normal LV. The principal stretches λmax and λmin in the midwall sectors are shown in Fig. 7, B–D, of normal sheep and infarcted sheep M-I and M-II at t = 40 ms after end diastole. The stretches λuu, λvv, λmax, and λmin were averaged in the basal and apical midwall sectors and are plotted in Fig. 8 in systole. The principal direction vectors associated with λmax and λmin, Nmax and Nmin are shown in Fig. 9 of normal sheep and infarcted sheep M-II at t = 20 and 40 ms. The spatial distribution of λmax, λmin, and shear Green strain Evw are plotted in Fig. A2 in appendix c.
Fig. 6.
Myocardial stretches of normal sheep (A, C, D) and infarcted sheep M-II (B, D, F) at time t = 40 ms after end diastole. A and B: longitudinal (axial) stretch λuu. C and D: circumferential stretch λvv. E and F: radial stretch λww. Short-axial slices are plotted at z = −0.5 cm (close to the base), −2.5 cm (middle region), and −4.5 cm (near to the apex).
Fig. 7.
A: partition of LV wall into endocardial, midwall, and epicardial layers, each consisting of 48 sectors, shown with normal sheep LV. Figures are colorized for visualization. B–D: average maximum (λmax; left) and minimum principal stretches (λmin; right) of midwall sectors of normal (B), M-I (C), and M-II (D) sheep in deformed configuration at time t = 40 ms after end diastole.
Fig. 8.
Average myocardial stretches in the basal (solid lines) and apical (dash lines) regions of normal and infarcted sheep ventricles. A: longitudinal stretch λuu. B: circumferential stretch λvv. C: maximum principal stretch λmax. D: minimum principal stretch λmin.
Fig. 9.
Maximum and minimum principal myocardial stretch vectors at t = 20 and 40 ms after end diastole. A: normal sheep. B: infarcted sheep M-II. The color scale corresponds to the stretch value. The view angle is chosen for best visualization.
DISCUSSION
Ventricular deformation and ejection function.
As shown in Fig. 4, the apex of normal and infarcted ventricles undergoes very little translation. The normal LV shows significant axial shortening at t = 40 and 80 ms and nearly retracts at 140 ms. The circumferential contraction (reduction of short-axis radius) is nearly uniform and is synchronous with the axial shortening, and both contribute to LV ejection. The wall thickening is also synchronous and is nearly uniform in the entire ventricular wall.
The infarcted ventricles show much weaker overall axial shortening, e.g., the base region moves much less than the normal LV in z direction (Fig. 4, B and C). At ∼40 ms after end diastole, the basal circumference significantly contracts, while the apical circumference dilates due to increased chamber pressure. This asynchronization accounts for the reduced EF, 31 and 12% compared with 41% of the normal LV. On the other hand, EV of M-I remained at the same level as for the normal LV, due to significantly increased end-diastolic chamber volume (60.1 vs. 43.9 ml). EV of severely infarcted M-II, however, was much lower, even though the chamber volume (100.1 ml) was >200% of the normal ventricle. As discussed below, the basal myocardial contraction contributes to the overall LV shortening to eject blood, while dilation of the infarcted apex that lost contractility shows a reverse effect. Similarly, the wall thickening is significant in some regions near to the base, but is significantly weaker toward the apex with some local thinning.
Figure 5A shows significant twisting motion of normal LV, i.e., a large basal region twists counterclockwise (yellow and red color with view from the base), while a large region close to the apex twist in the opposite direction (blue color). For sheep M-I (Fig. 5B), twisting is most pronounced near the base and drops quickly toward the apex, leaving a large volume (green color) with very little circumferential movement. Circumferential twisting of sheep M-II (Fig. 5C) is further reduced in the basal region and almost vanishes elsewhere. This finding is consistent with previous observations that LV twisting is impaired in IDH due to the loss of the elliptic shape of the apex and loss of contractility of the helical myofiber structure (6).
Myocardial stretches and strains.
In the normal sheep (Fig. 6A), the longitudinal stretch λuu is found lower than 1.0 in a large volume from the base to the apex (green and blue color), except for a corner of the base where λuu is >1.0 likely, due to tethering of surrounding tissue. During the heartbeat, the longitudinal stretch synchronizes with the same magnitude in the basal and apical regions (Fig. 8A), indicating fairly uniform λuu in the entire LV wall. The circumferential shortening is significant in the normal LV, as quantified by stretch λvv (Fig. 6C). The distribution of λvv is also fairly uniform (Figs. 6C and 8B). The stretches λuu and λvv are closely synchronous in both basal and apical region (Fig. 8, A and B), resulting in efficient LV ejection. The distribution of λww shows similar pattern as for λvv and λuu (Fig. 6, E and F).
The basal region of infarcted LV M-I shows significant longitudinal and circumferential shortening (Fig. 8, A and B), with the later being stronger than the normal LV. The shortening in the apical region synchronized with the basal region, however, is much weaker. For LV M-II with a larger dilated infarcted region, the basal longitudinal and circumferential shortening are similar to normal and M-I ventricles. The apical stretches (Figs. 6, B and C, and 8, A and B), however, indicate that the infarcted myocardium lengthens during LV systole in both longitudinal and circumferential directions due to the increase in chamber pressure, as also shown in Fig. 4C of deformed configuration. Such asynchronous basal and apical deformation considerably reduces the EF.
Figure 8, A and B, shows that the normal LV relaxes the shortening earlier and faster than the infarcted. This is evidence of compensation in infarcted hearts: the normal basal myocardium contracts stronger and longer to restore the decreased ejection.
Principal stretches and myofiber architecture.
Unlike the stretches λuu, λvv, and λww that are coordinate dependent, the principal stretches λmax and λmin are invariants and are potentially more relevant to myocardial mechanics. For example, there has been speculation that the principal vectors may have a close relation to the helical myofiber architecture (6), i.e., the minimum principal stretch λmin is a direct index of contractility of the myocytes, and the principal vector Nmin lays in the local myofibril orientation during LV ejection. The physical basis is that contraction of the myocytes is the source of myocardial shortening.
In normal LV, λmax is closely correlated to wall thickening, as indicated by Nmax that orients almost transmurally (Fig. 9) and by the similarity of the spatial distribution of λww and λmax (see Fig. A2). This is the result of nearly uniform circumferential and longitudinal shortening, as discussed above. In general, λmax is higher in the basal region than the apical region (Fig. 8C) of normal and infarcted hearts. However, λmax in the apical region of infarcted ventricles are not correlated to wall thickening. This is evidenced by Nmax, which does not orient transmurally in some apical regions (Fig. 9). In these regions, the circumferential and longitudinal stretches are higher than wall thickening (Fig. 6, B, D, and F) and thus are the major contributors to λmax.
In normal LV, the minimum principal stretch λmin shows moderate spatial variation (Fig. 7B). It reaches the minimum in the equatorial region, indicating the maximum shortening. The contraction in the basal region is slightly weaker. Figure 8D further shows that the average λmin has the same pattern and magnitude in the basal and apical regions throughout the cardiac cycle. As shown in Fig. 9B, the corresponding principal stretch vector Nmin is not in the circumferential or the longitudinal direction. The vector field is fully 3D and features a helical structure that resembles the helical myofibral architecture, as described in Buckberg et al. (6). The relationship cannot be verified or quantified by the present DENSE data, however, due to insufficient temporal and through-plane spatial resolutions.
In M-I and M-II, the distribution of λmin has been altered by infarction, as shown in Fig. 7, C and D. The contraction has is decreased (higher λmin) in the infarcted apical region, but is enhanced (lower λmin) in the basal region where the myocardium is perfused. In average, the basal contraction is slightly stronger than in the normal LV (Fig. 8D) and lasts longer in systole. The more severely infarcted LV M-III shows even stronger and longer basal contraction as in Fig. 8D. These observations are consistent with the longitudinal and circumferential shortening discussed above. In the basal region, the principal vector Nmin also shows some full 3D structure (Fig. 9), similar to the normal LV. In the dilated region below the base, Nmin is disorganized ordered and does not reflect the myofibril orientation. This implies that the deformation is mainly passive and does not reflect myocardial contraction. In this region, in particular LV M-II, the stretches λuu, λvv, and λww are all close to 1.0 (Fig. 6, B, D, and F). In this situation, the determination of principal vectors is very sensitive to factors such as noise and fitting errors and need to be determined more carefully in the future.
Compensatory mechanism.
The stronger myocardial circumferential and principal shortening in the basal region of infarcted ventricles, as well as longer duration of shortening, indicate compensation to the decreased LV ejection. The recent experimental study of Guccione et al. (10) on the effect for anteroapical aneurysm plication shows that, after 6 wk of the operation, the basal and equatorial circumferential shortening reduced in the lateral and posterior regions, but increased in the anterior and septal region. The reduction, however, is more significant. This is consistent with the present observation of increased circumferential shortening in infarct state. Their results also show that myocardial shortening is circumferentially heterogeneous and suggest more local analysis for our study on DENSE data. On the other hand, the compensatory mechanism alone cannot recover the EF of infarcted LV. For LV M-I, the EV is maintained by increase in end-diastolic chamber volume. For LV M-II, however, EV is only ∼60% of normal, even though the end-diastolic chamber volume increased to >200%. Therefore, therapy to regain the apical contractility is needed for recovery of LV ejection function. Under certain conditions, surgical ventricular restoration (23) may be necessary.
Border zone deformation.
The change of systolic function in the ischemic border zone has been well recognized (13). The recent DENSE study of Ashikaga et al. (4) shows reduced circumferential shortening in the border zone. The authors suggested that the impaired shortening function is likely due to the mechanical tethering between the normal and infarcted myocardium, but not the electrical factors. In this study, the infarcted myocardium of M-II was so large that the border zone has extended close to the base. Thus the myocardial contraction increases (Fig. 7D) in some portion of the border zone as compensatory mechanism and does decrease in the rest. The border zone in M-I, while not identified in the experiment, is likely near the equator of the LV, where the contraction is weaker than in the normal ventricle, as indicated by λmin in Fig. 7C. However, the basal contraction apparently increases to compensate. This is consistent with the observation of Ashikaga et al. (4) of stronger circumferential shortening in the remote myocardium. DENSE data with higher spatial resolution in conjunction with hyperenhancement studies will be necessary for more comprehensive investigation of the border zone mechanics.
Conclusions.
We present a postprocessing method to reconstruct FE model and continuous displacement and stretch/strain fields of LV from discrete DENSE MRI displacement data. The geometric and displacement fittings use minimization method with regularization. A proof-of-concept study was conducted with DENSE data of one normal sheep and three infarcted sheep with IDH. The image processing method is stable and computationally efficient and enables analysis and visualization of the detailed local myocardial deformation in terms of tissue stretches and principal stretch vectors. The major conclusions are as follows: 1) the infarcted apex slightly dilates and does not twist significantly in systole with significant reduction of EF, which cannot be compensated by increase of basal circumferential contraction; 2) a potential compensatory mechanism involves longer duration of contraction in systole; 3) distribution of myocardial stretches and strains is significantly altered by infarction; 4) in unimpaired myocardium, the minimum principal stretch λmin can serve as an index of myocyte contractility, and the corresponding principal vector Nmin resembles the helical myofiber architecture. In the infarcted myocardium, λmin and Nmin are not correlated to myocyte contractility and myofibril orientation. We conclude that the proposed method provides a detailed view of the heart and holds promise for applications of DENSE to understanding cardiac functions in the clinical setting.
APPENDIX A
Geometric Fitting and FE Model of LV
We used prolate spheroidal coordinates (8, 14, 25) for reconstruction of LV FE model. A point with Cartesian coordinate (x, y, z) has prolate spheroidal coordinates (u, v, w), as:
 |
(A1) |
with u ∈ (−π/2, π/2), v ∈ (0, 2π), and w ∈ (0, +∞), and α is a scaling factor.
Consider Nepi epicardial and Nendo endocardial contour points of an LV, their prolate spheroidal coordinates are (un, vn, wn). We translated and rotated the coordinates according to the geometric principal axes of the points, such that the epi- and endocardial points lay closely to two primitive surfaces, respectively, with α = α0, u ∈ (−π/2, umax), v ∈ (0, 2π), and w = wepi (epicardial) and w = wendo (endocardial). Note that u = −π/2 corresponds to the apex, and u = umax is approximately the base. In slight variance from the previous works (8, 14, 25), we selected u = 0 in the numerical samples of this study.
Let fepi (u, v) be a function that maps the outer primitive (w = wepi) onto the epicardial contour points, the mapping error Eepi is given by:
 |
(A2) |
in which γn is the weight. As in previous works (8, 14, 25), geometric regularization Repi was imposed to avoid large curvature on the fitted surface, as:
 |
(A3) |
where γ are weights. Therefore, the fitting was to minimize the objective function Φepi = Eepi + Repi. The mapping function fepi can be chosen to be cubic Hermite interpolation (8, 25), cubic B-spline (14, 15), or other forms. Here, we used the following B-spline function:
 |
(A4) |
in which B (u) is clamped at the end points (u = −π/2 and umax), and B
 (v) is closed for v ∈ (0, 2π). Nu and Nv are the number of control points. To ensure that the fitting surface is C2 continuous at the apex (u = −π/2), a linear constraint (Aij) = C·X was imposed, with X the independent fitting parameters. It can be shown that the objective function Φepi is in a quadratic form:
 |
(A5) |
where the matrix H, vector b, and scalar φ0 are constants contributed by Eepi and Repi. Thus the parameters that minimize Φepi can be solved from linear equations H·X = b. We also used product of polynomial function (in u direction) and triangular function (v direction) as the shape function (similar to Eq. A7 below with w = constant), and obtained similar results.
Similarly, the inner primitive (w = wendo) was mapped by fendo (u, v) onto the endocardial contour points. The primitive surfaces were divided in u and v directions in the same pattern into quadrilateral FE mesh, with some special treatment applied at the apex area to avoid singularity. Hexagonal volumetric mesh was then generated by dividing the space between the surfaces into several layers. The number and size of the elements can be adjusted. The primitive FE mesh was then deformed to form a LV model (see Fig. 2A for normal LV) by translating the nodes along the w direction, according to fendo and fepi, i.e., a node in the primitive with coordinates (u, v, w) was moved to (u, v, w′) by
 |
(A6) |
APPENDIX B
Reconstruction of Continuous Displacement Field
Reconstruction of continuous 3D displacement field in the ventricular wall was similar to the above geometric fitting. Consider a set of NDENSE material grid points, whose initial coordinates and displacement vectors for all frames have been extracted from DENSE MRI. The prolate spheroidal coordinates of the ith material grid points were (u , v
, v , w
, w ) initially and were (u
 , v
, v , w
, w ) at the Jth frame with time t = tJ. The displacement vector (change of coordinates) was d
 = (u
= (u − u
− u , v
, v − v
− v , w
, w − w
− w ). We use a continuous function f(u, v, w; tJ) to approximate the displacement field, as:
 |
(A7) |
where u′ = u + π/2 and w′ = w − wendo. It is noted that major LV deformation modes, such as twisting, bending and dilatation, were incorporated in f(u, v, w; tJ). As with the above geometric fitting, the objective function is the sum of the following error and regularization functions:
 |
(A8) |
 |
(A9) |
where gi and γ are the weights. It can be shown that the objective function is in quadratic form, and the optimal coefficients (C , CJ, AJ, BJ) can be solved from a set of linear equations. Note that, with displacement function Eq. A7, the time-consuming integrations in Eq. A9 can be calculated analytically. We also tried cubic B-spline [simply multiply Eq. A4 by B
 (w)] and found that it took longer much computational time for integrating the regularization functions Eq. A9 and did not improve the fitting results.
The fitting result was evaluated by the relative RMSE between the experimentally measured position x(m) and numerically predicted position x(p) of a set of N reference points, as:
 |
(A10) |
Here, the reference points can be the DENSE material grid points, or other material points that can be tracked in the experiment.
After the displacement field was fitted for all of the frames, we obtained a series of coefficients (C , CJ, AJ, BJ). The continuous displacement at any time t would then be estimated with function f(u, v, w; t) as in Eq. A7, where the coefficients were obtained by interpolating (C
 , CJ, AJ, BJ) using a closed cubic spline through the cardiac cycle.
APPENDIX C
Validation and Error Analysis
To validate the reconstruction results and investigate the effects of the error of DENSE data, we constructed a numerical phantom based on the normal LV. The continuous displacement field fitted from the experimental DENSE data was taken as the known displacement. In the LV wall, we generated two sets of artificial DENSE material grid points with slice thickness of 12 and 8 mm and denoted them as T12 and T8, respectively. As shown in Fig. A1, A and B, the first slice is 4 mm below the base. The in-plane grid of artificial material grid points is 1.5 mm × 1.5 mm (Fig. A1D) and is rotated by 45° from the actual grid. Displacement vectors of these artificial material grid points were calculated by Eq. A7, with the fitted coefficients (C , CJ, AJ, BJ) at t = 40 ms after end diastole. Then random errors between 0, ±5, ±10, and ±20% were added to the displacement vectors. From the displacement of the artificial material grid points, the deformation field was reconstructed, and the deformed position x, stretches λ, and Green strain E were computed on the FE nodes and compared with the known or exact values. The overall relative RMSE of these quantities were calculated with Eq. A10 by replacing x with the corresponding entity. The results are listed in Table A1. Contours of stretches λuu, λvv, λww, and λmin, and shear Green strain Evw, as reconstructed from DENSE material grid points T12, are plotted in Fig. A2. Reconstruction of the deformed position of FE nodes was fairly accurate. The stretches were also predicted well, with acceptable relative RMSE, and their spatial distribution was correctly reproduced. Some local patterns were distorted by the increased random error of DENSE displacement vectors. The RMSE increased gradually and nearly linearly with the random error. This indicates that reconstruction does not amplify the experimental error of DENSE data.
Fig. A1.
Artificial DENSE image slices and material grid point generated in normal LV. A and B: artificial DENSE material grid points T12 with 12-mm slice thickness, and T8 with 8-mm thickness. Solid lines are the actual slices, and the dash lines are artificial ones. C: actual grid used in DENSE experiment. D: the grid of artificial DENSE material grid points is rotated by 45° from the actual lattice.
Fig. A2.
Contour plots of myocardial stretches and shear strain in a LV phantom reconstructed from artificial DENSE material grid points T12 with 12-mm slice thickness. Exact, known field; 0% error, reconstructed from DENSE displacement without error; 5% error, 10% error, and 20% error: reconstructed from DENSE displacement with ±5, ±10, and ±20% random error, respectively. Evw, shear Green strain.
The relative RMSE of the strain components, however, are higher, particularly for the shear components. An explanation is that the dominator in Eq. A10 is small for strains (which are zero at undeformed state) and can amplify the relative RMSE. Indeed, as shown in Fig. A2, the 3D distribution of Evw (which has the highest relative RMSE) is accurately reproduced, even with random ±20% error of the displacement input.
In general, the RMSE with DENSE material grid points T8 is lower than with T12, as expected. When the error of DENSE displacement increases, however, the advantage of using smaller slice thickness decreases, in particular for the shear strains.
REFERENCES
- 1.Aletras AH, Balaban RS, Wen H. High-resolution strain analysis of the human heart with fast-DENSE. J Magn Reson 140: 41–57, 1999. [DOI] [PubMed] [Google Scholar]
- 2.Aletras AH, Ding SJ, Balaban RS, Wen H. Displacement encoding in cardiac functional MRI. Proc Intl Soc Magn Reson Med April: 281, 1998. [DOI] [PMC free article] [PubMed]
- 3.Aletras AH, Ding SJ, Balaban RS, Wen H. DENSE: displacement encoding with stimulated echoes in cardiac functional. MRI J Magn Reson 137: 247–252, 1999. [DOI] [PMC free article] [PubMed] [Google Scholar]
- 4.Ashikaga H, Mickelsen SR, Ennis DB, Rodriguez I, Kellman P, Wen H, McVeigh ER. Electromechanical analysis of infarct border zone in chronic myocardial infarction. Am J Physiol Heart Circ Physiol 289: H1099–H1105, 2005. [DOI] [PMC free article] [PubMed] [Google Scholar]
- 5.Axel L, Morton D. Correction of phase wrapping in magnetic resonance imaging. Med Phys 16: 284–287, 1989. [DOI] [PubMed] [Google Scholar]
- 6.Buckberg GD, Coghlan HC, Torrent-Guasp F. The structure and function of the helical heart and its buttress wrapping. VI. Geometric concepts of heart failure and use for structural correction. Semin Thorac Cardiovasc Surg 13: 386–401, 2001. [DOI] [PubMed] [Google Scholar]
- 7.Callaghan PT, Eccles CD, Xia Y. NMR microscopy of dynamic displacements: k-space and q-space imaging. J Phys E Sci Instrum 21: 820–822, 1988. [Google Scholar]
- 8.Costa KD, Hunter PJ, Wayne JS, Waldman LK, Guccione JM, McCulloch AD. A three-dimensional finite element method for large elastic deformations of ventricular myocardium. II. Prolate spheroidal coordinates. J Biomech Eng 118: 464–472, 1996. [DOI] [PubMed] [Google Scholar]
- 9.Garot J, Bluemke DA, Osman NF, Rochitte CE, McVeigh ER, Zerhouni EA, Prince JL, Lima JAC. Fast determination of regional myocardial strain fields from tagged cardiac images using harmonic phase (HARP) magnetic resonance imaging. Circulation 101: 981–988, 2000. [DOI] [PubMed] [Google Scholar]
- 10.Guccione JM, Walker JC, Beitler JR, Moonly SM, Zhang P, Guttman MA, Ozturk C, McVeigh ER, Wallace AW, Saloner DA, Ratcliffe MB. The effect of anteroapical aneurysm plication on end-systolic three-dimensional strain in the sheep: a magnetic resonance imaging tagging study. J Thorac Cardiovasc Surg 131: 579–586, 2006. [DOI] [PMC free article] [PubMed] [Google Scholar]
- 11.Guttman MA, Zerhouni EA, McVeigh ER. Analysis and visualization of cardiac function from MR images. IEEE Comp Graph Appl 17: 30–38, 1997. [DOI] [PMC free article] [PubMed] [Google Scholar]
- 12.Kim D, Gibson WD, Kramer CM, Epstein FH. Myocardial tissue tracking with two-dimensional cine displacement-encoded MR imaging: development and initial evaluation. Radiology 230: 862–871, 2004. [DOI] [PubMed] [Google Scholar]
- 13.Kerber RE, Marcus ML, Ehrhardt J, Wilson R, Abboud FM. Correlation between echocardiographically demonstrated segmental dyskinesis and regional myocardial perfusion. Circulation 52: 1097–1104, 1975. [DOI] [PubMed] [Google Scholar]
- 14.Li J, Denney TS. Left ventricle motion reconstruction with a prolate spheroidal B-spline model. Phys Med Biol 51: 517–537, 2006. [DOI] [PubMed] [Google Scholar]
- 15.Luo G, Heng PA. LV shape and motion: B-spline based deformable model and sequential motion decomposition. IEEE Trans Inf Technol Biomed 9: 430–446, 2005. [DOI] [PubMed] [Google Scholar]
- 16.Markovitz LJ, Savage EB, Ratcliffe MB, Bavaria JE, Kreiner G, Iozzo RV, Hargrove WC, Bogen DK, Edmunds LH Jr. Large animal model of left ventricular aneurysm. Ann Thorac Surg 48: 838–845, 1989. [DOI] [PubMed] [Google Scholar]
- 17.Meyer FG, Constable RT, Sinusas AJ, Duncan JS. Tracking myocardial deformation using phase contrast MR velocity fields: a stochastic approach. IEEE Trans Med Imaging 15: 453–465, 1996. [DOI] [PubMed] [Google Scholar]
- 18.Nash M, Hunter P. Computational mechanics of the heart. J Elast 61: 113–141, 2001. [Google Scholar]
- 19.Ogden RW. Non-linear Elastic Deformations. New York: Dover, 1997.
- 20.Omens JH, May KD, McCulloch AD. Transmural distribution of three-dimensional strain in the isolated arrested canine left ventricle. Am J Physiol Heart Circ Physiol 261: H918–H928, 1991. [DOI] [PubMed] [Google Scholar]
- 21.Osman NF, Sampath S, Atalar E, Prince JL. Imaging longitudinal cardiac strain on short-axis images using strain-encoded MRI. Magn Reson Med 46: 324–334, 2001. [DOI] [PubMed] [Google Scholar]
- 22.Pelc NJ, Herfkens RJ, Shimakawa A, Enzmann DR. Phase contrast cine magnetic resonance imaging. Magn Reson Q 7: 229–254, 1991. [PubMed]
- 23.Ratcliffe MB. The treatment of ischemic heart failure with surgical ventricular restoration (SVR): new evidence of benefit. J Card Fail 12: 195–198, 2006. [DOI] [PubMed] [Google Scholar]
- 24.Wen H, Marsolo KA, Bennett EE, Kutten KS, Lewis RP, Lipps DB, Epstein ND, Plehn JF, Croisille P. Adaptive postprocessing techniques for myocardial tissue tracking with displacement-encoded MR imaging. Radiology 246: 229–240, 2008. [DOI] [PMC free article] [PubMed] [Google Scholar]
- 25.Young AA, Axel L. Three-dimensional motion and deformation of the heart wall: estimation with spatial modulation of magnetization–a model-based approach. Radiology 185: 241–247, 1992. [DOI] [PubMed] [Google Scholar]
- 26.Zerhouni EA, Parish DM, Rogers WJ, Yang AA, Shapiro EP. Human heart: tagging with MR imaging–a method for noninvasive assessment of myocardial motion. Radiology 169: 59–63, 1988. [DOI] [PubMed] [Google Scholar]


