Abstract
In the heart, the creatine kinase (CK) system plays an important role in the cascade of ATP production, transportation, and utilization. The forward pseudo-first-order rate constant for the CK reaction can be measured noninvasively by the 31P-magnetic resonance (MR) spectroscopy magnetization saturation transfer (MST) techniques. However, the measurement of MST in the in vivo heart is limited by the lengthy data acquisition time, especially for studies requiring spatial localization. This technical report presents a new method for measuring ATP production rate via CK that can reduce the MST data acquisition time by 82%. This method is validated using an in vivo pig model to evaluate the forward pseudo-first-order rate constant of myocardial CK reaction noninvasively.
Keywords: magnetic resonance spectroscopy, metabolism, high-energy phosphates, adenosine 5′-triphosphate
cardiac hypertrophy occurs as a compensatory response to various stressors, including pressure overload, volume overload, and myocardial infarction. After a prolonged period of compensatory hypertrophy with restored ventricular wall stress, severe ventricular dysfunction often occurs with signs of congestive heart failure (CHF). The exact mechanisms underlying this transition from compensated ventricular hypertrophy to CHF are likely multifactorial, but alterations in myocardial bioenergetics have been considered to be important factors in this pathway (14, 15). The creatine kinase (CK) enzyme catalyzes the reaction that converts adenosine diphosphate (ADP) and phosphocreatine (PCr) to adenosine triphosphate (ATP) and creatine (Cr) (13). This maintains high ADP levels in the mitochondria, where ATP is generated, and low ADP levels at the contractile apparatus, where ATP is utilized, thus facilitating the production and utilization of ATP (26, 28). Our laboratory has previously reported that the myocardial CK forward flux rate is significantly reduced in hypertrophied hearts (20, 29–31). The severity of this reduction is linearly related to the severity of the hypertrophy and left ventricular (LV) dysfunction (29). Recently, using a low-field 1.5-T magnet, Weiss and associates examined heart failure patients and found that the CK flux was reduced in patients with LV hypertrophy and CHF (23, 27). Importantly, the studies demonstrate that the severity of the reduction in CK flux rate is related to the severity of LV contractile dysfunction (23) and suggest that the CK flux rate may be a more sensitive myocardial energetic indicator for the severity of LV dysfunction compared with the PCr-to-ATP ratio in heart failure patients (27). However, the quantitative assessment of CK forward flux rate at low field magnet may be limited by the low signal-to-noise ratio (SNR).
Transmurally differentiated measurements of ATP production rate via CK require longer data acquisition time for spatial localization. In a dog model, the CK flux rate was reported to be heterogeneous across the LV wall of normal heart, with the lowest rate in inner layers of the LV wall (21). These CK flux measurements with transmural differentiation took ∼6 h to complete the data acquisition for one experimental condition, suggesting unlikely to perform experimental interventions, using a conventional approach.
Here, we demonstrate a novel strategy for magnetization saturation transfer (MST) study of ATP production rate via CK forward reaction. By employing numerically optimized presaturation delays, this strategy results in a 82% and a 56% reduction in total data acquisition time and saturation pulse duration, respectively. The novel strategy was validated using an in vivo porcine heart model, which generated identical forward pseudo-first-order rate constant (kf) values compared with that measured with the conventional approach from the same heart. The significant reductions in acquisition time, as well as saturation pulse duration provided by this novel approach can potentially facilitate the future high field cardiac CK MST studies with spatial localization on patients with heart failure in high field magnet.
METHODS
All experiments were performed in accordance with the animal use guidelines of the University of Minnesota, and the experimental protocol was approved by the University of Minnesota Research Animal Resources Committee. The investigation conformed to the “Guide for the Care and Use of Laboratory Animals” published by the National Institutes of Health (NIH publication no. 85-23, revised 1985).
Open-chest surgery preparation for 31P-magnetic resonance spectroscopy.
Details of the open-chest surgery preparation for 31P-magnetic resonance spectroscopy (MRS) have been described previously (12, 32). Briefly, young Yorkshire swine (∼30 kg) were anesthetized with pentobarbital sodium (initial dose 30 mg/kg iv, maintenance dose 4 mg·kg−1·h−1 iv), intubated, and ventilated with supplemental oxygen on a respirator. Polyvinyl chloride catheters (3-mm outer diameter) were inserted into the ascending aorta, superior vena cava, and LV for hemodynamic monitoring. The ascending aorta catheter was placed via the left internal carotid artery, and the two intravenous catheters were placed through the left external jugular vein. The heart was exposed via a sternotomy and suspended in a pericardial cradle. The LV catheter was introduced through the apical dimple. Aortic and LV pressures were measured by pressure transducers positioned at midchest level and recorded on an eight-channel recorder. Ventilation rate, volume, and inspired oxygen content were adjusted to maintain physiological values for arterial Po2, Pco2, and pH. Aortic and LV pressures were continuously monitored throughout the study.
31P-MRS.
Measurements were performed in a 40-cm bore 4.7-T magnet interfaced with a SISCO (Spectroscopy Imaging Systems, Fremont, CA) console. 31P- and 1H-NMR frequencies were 81 and 200 MHz, respectively. Radio-frequency transmission and signal detection were performed with a 28-mm-diameter double-tuned surface coil sutured directly to the epicardium of anterior LV wall. The coil was cemented to a sheet of silicone rubber 0.7 mm in thickness and ∼20% larger in diameter than the coil itself. A capillary containing 15 μl of 3 M phosphonoacetic acid was placed at the coil center to serve as a reference. The proton signal from water detected with the surface coil was used to homogenize the magnetic field and to adjust the position of the animal in the magnet so that the coil was at or near the magnetic isocenter. This was accomplished using a spin-echo experiment and a readout gradient. The information gathered in this step was also utilized to determine the spatial coordinates for spectroscopic localization (10, 17). Chemical shifts were measured relative to PCr, which was assigned a chemical shift of −2.55 ppm relative to 85% phosphoric acid at 0 ppm. Baseline myocardial high-energy phosphate data acquisition was achieved with a 90° adiabatic half-passage pulse, and selective saturation on ATP-γ was achieved with B1-insensitive train to obliterate signal (BISTRO), as previously reported (16).
kf calculation of conventional MST methods.
Table 1 summarizes all of the abbreviations and symbols.
Table 1.
Abbreviations and symbols
| Abbreviation | Actual Physical Meaning |
|---|---|
| MST | Magnetization saturation transfer |
| MRS | Magnetic resonance spectroscopy |
| CK | Creatine kinase |
| d1 | Presaturation delay employed in the MST experiment |
| d2 | Duration of saturation pulse in the MST experiment |
| FID | Free induction decay |
| kf | Pseudo-first-order rate constant to characterize the ATP production rate via CK |
| M0 | Magnetization measured by 31P-magnetic resonance spectroscopy under fully relaxed condition |
| Mshort | Magnetization measured with very short repetition time. This measurement, in combination with M0, can yield an approximate value of T1int, according to Eq. 14 |
| Mss | Steady-state magnetization of a spin (e.g., PCr) when the counterpart spin (e.g., ATP-γ) is continuously saturated, as dictated by Eq. 1 |
| MTR,PCr | Magnetization measured with ATP-γ continuously saturated. The TR can be arbitrary. This, in combination with Mss,PCr, can yield accurate value of T1,PCrapp, according to Eq. 10 |
| nt | Number of averaged FIDs for one spectrum |
| T1app | Apparent longitudinal relaxation time constant of a spin (e.g., PCr) when the counterpart spin (e.g., ATP-γ) is continuously saturated, as dictated by Eq. 1 |
| T1mix | Apparent longitudinal relaxation time constant when chemical exchange is involved. T1mix is an approximation, because the actual recovery of spin magnetization under chemical exchange is not an exact exponential curve |
| TR | Repetition time of pulse sequence in MST experiment |
A conventional MST method consists of two experiments, namely, progressive and steady-state saturations. The CK enzyme catalyzes the reaction PCr + ADP + H+  Cr + ATP. The progressive saturation transfer experiment employs multiple data acquisitions with progressively prolonged saturation on ATP-γ to retrieve the apparent relaxation time constant of PCr by fitting its signal intensity to the following equation (2):
 |
(1) |
where M0,PCr is the thermal equilibrium signal intensity of PCr detected by MRS; T is the intrinsic spin-lattice relaxation time of PCr; and T
 is the apparent relaxation time of PCr when ATP-γ is continuously saturated and defined according to the following equation (2):
 |
(2) |
The steady-state saturation transfer experiment employs “infinitively long” saturation on ATP-γ (usually 3–5 times of T ) to find the steady-state signal intensity of PCr (Mss,PCr), and then the kf can be calculated according to the following equation (2):
 |
(3) |
where ΔMPCr = M0,PCr − Mss,PCr.
A steady-state saturation transfer experiment alone can determine the kf, according to the following equation (22):
 |
(4) |
The exact value of kf requires knowledge of intrinsic spin-lattice relaxation time of PCr. In the presence of chemical exchange, the progressive saturation experiment is the gold standard for measuring T . However, since it has been suggested by numerous studies that the T
 is constant among subjects with different physiological and pathological conditions (1, 2, 20, 30), and even among different species (8), valid comparisons of CK kinetics between subjects can still be achieved based on the ΔMPCr-to-Mss,PCr ratio. Moreover, a recent method developed by Spencer and colleagues (11, 24) allows fast measurement of intrinsic spin-lattice relaxation times in the presence of chemical exchange, without using multipoint progressive saturation experiment and curve fitting.
Numerical analysis of MST governing equations and novel MST strategy.
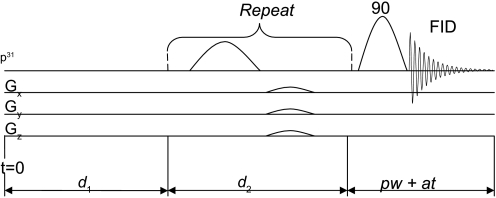
A standard pulse sequence for CK MST experiment is composed of three segments (Fig. 1): a presaturation delay (d1), selective saturation on ATP-γ (d2), and 90° readout pulse followed by free induction decay (FID) acquisition (pw+at). The duration of the readout pulse plus acquisition is usually <100 ms and neglectable; thus total repetition time (TR) is approximated by d1 + d2. The change of PCr and ATP-γ magnetizations along the z direction [M(t)] during this saturation pulse sequence could be described by the modified Bloch-McConeell equations (3, 18) shown below:
 |
 |
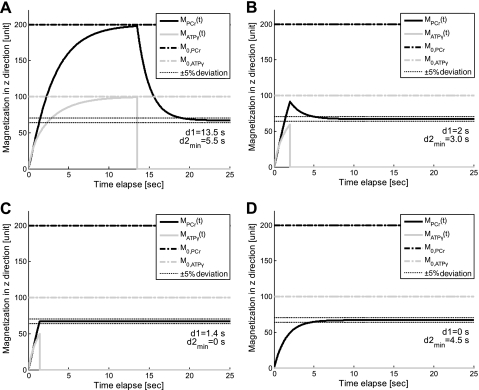
A numerical analysis of the above equations is shown in Fig. 2, where the time dependence of PCr and ATP-γ magnetizations is plotted against different presaturation delays (d1). This figure suggests two important points: 1) the MPCr relaxation is a single exponential curve (decay or recovery) characterized only by T as long as ATP-γ is fully saturated [i.e., MATPγ(t) = 0]; and 2) the same steady-state value of PCr magnetization (Mss,PCr) is achieved regardless of d1. In fact, the explicit expression of Mss,PCr can be obtained by solving Eq. 7:
 |
(9) |
Based on the numerical analysis of Eqs. 5–8, which are the governing equations for CK MST experiments, we have derived the following equations (Eqs. 10–13) and proposed a novel strategy for MST experiment that can be applied to any solid organ. This novel approach has the following significant benefits.
Fig. 1.
A general pulse sequence design for magnetization saturation transfer (MST) study. d1 is the duration of presaturation delay, d2 is the duration of saturation process, and pw+at is the duration of readout pulse plus acquisition time. Total repetition time TR ≈ d1 + d2. FID, free induction decay; G, gradient (Gx, X-direction gradient strength).
Fig. 2.
The numerical analysis of governing Eqs. 5–8. Time dependence of PCr and ATP-γ magnetizations in z direction during MST pulse sequence (see in Fig. 1) is plotted with different presaturation delays: 13.5 s (A), 2 s (B), 1.4 s (C), and 0 s (D). Dotted lines indicate ±5% deviations from theoretical Mss,PCr value as given by Eq. 9, from which the minimal saturation time d2,min is defined, such that MPCr at the end of saturation process just lies between those lines. Simulation parameters are as follows: kf = 0.44 s−1, T = 4.5 s, T
 = 1.5 s, and M0,PCr/M0,ATPγ = 2. The simulation demonstrated that the values of Mss,PCr and T
 are independent of d1. See text for definition of terms.
1) For progressive saturation experiment, short d1 (d1 = 0) can be employed (Fig. 2D) to yield the same T as measured by conventional method, where long d1 would be employed (Fig. 2A). The short d1 strategy can offer great reduction of TR. In case of a very limited time window for MST experiment, only one spectrum with ATP-γ saturated is needed in addition to Mss,PCr measurement to unambiguously solve the T
 , according to the following equation:
 |
(10) |
where MTR,PCr is the PCr signal intensity acquired with a TR and continuous saturation on ATP-γ.
2) An optimal d1 (d1,opt) can be employed (Fig. 2B) to yield the same Mss,PCr as measured by conventional method, where long d1 followed by long saturation time (d2) would be employed. The d1,opt strategy not only reduces the TR but also shortens the duration of saturation pulse required for Mss,PCr quantification (Fig. 3). This reduction of the saturation pulse duration results in a minimal specific absorption rate, which is often an Food and Drug Administration concern in clinical studies.
Fig. 3.
d1,opt seeking by numerical solving of Eqs. 5–8. Parameters for numerical simulation are as follows: kf ∈ (0.2, 0.8) s−1, T = 4.5 s, T
 /T
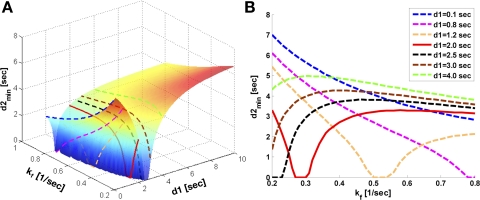
/T = 3, and M0,PCr/M0,ATPγ = 2. A: three-dimensional plot showing the dependence of minimal saturation time (d2,min) on kf and d1. B: a two-dimensional view of A. The solid line (d1 = 2 s) represents d1,opt condition because the maximum value of d2,min (defined as d2,opt) throughout the preset kf range is the smallest. These simulations demonstrated that the duration of saturation time (d2) would be minimal when d1,opt is applied compared with all other cases. See text for definition of terms.
RESULTS
d1,opt Calculation.
As shown in Fig. 2, in principle, for each CK system with known parameters, there exists an “ideal” presaturation delay (d1,ideal, shown in Fig. 2C) such that the PCr signal intensity after presaturation delay just equals the steady-state value after a long saturation on ATP-γ, i.e.
 |
(11) |
When a d1,ideal is applied, an accurate Mss,PCr can be measured without any saturation process; thus the total TR will be the shortest. The relaxation process of PCr signal intensity during presaturation delay can be approximately described by the following equation (16):
 |
(12) |
where T is the approximate apparent relaxation time of PCr undergoing chemical exchanges with ATP-γ and depends on T
 , T
, T , M0,PCr/M0,ATPγ, and kf. By combining Eqs. 10–12, the ideal presaturation delay can be calculated as:
 |
(13) |
Equation 13 is not helpful for practical use, since d1,ideal calculation requires a kf value, which is the purpose of the experiment itself. However, based on literature and/or prior experiences, a confident estimate of kf range for a specific study can be made, then an optimized presaturation delay (d1,opt) can be derived (in contrast to d1,ideal, which requires the exact value of kf), such that, when d1,opt is applied, the required saturation time for accurate quantification of Mss,PCr is minimal for all possible kf values within the estimated range.
Based on previous CK reaction rate studies, kf ranges from 0.2 to 0.8 s−1 under physiological conditions (1, 5, 20, 22, 23, 25, 29, 30), and T ranges from 2 to 6 s (1, 5, 20, 29, 30). Other parameters that are required for calculation of d1,opt include T
 and M0,PCr-to-M0,ATPγ ratio. Under physiological conditions, M0,PCr/M0,ATPγ in the heart is ∼2 (25, 27, 33), while the ratio of T
 to T
to T is ∼3 (2, 5, 6, 9). An example of d1,opt calculation for T
 of 4.5 s is illustrated in Fig. 3. The dependence of minimal saturation time (d2,min, defined as the minimal saturation time giving rise to a PCr magnetization that is within ±5% deviation from theoretical Mss,PCr value, as given by Eq. 9) upon d1 and kf can be obtained by numerically solving Eqs. 5–8 (Fig. 3A). Among the d2,min vs. kf curves obtained from different d1 values (Fig. 3B), there will be one that has the smallest maximum value throughout the physiological kf range. This curve represents the optimal value of presaturation delay (d1,opt) and the corresponding optimal duration of saturation pulse (d2,opt) required for the physiological kf range.
Validation of the novel MST strategy in in vivo heart.
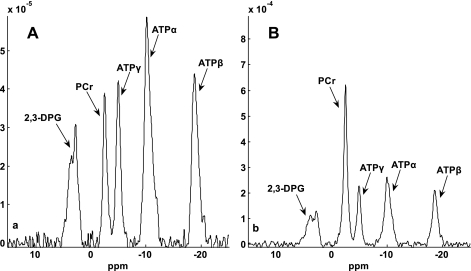
We firstly validated the d1,opt strategy. To calculate the d1,opt and d2,opt for MST experiment, we have to estimate the intrinsic spin-lattice relaxation time of PCr (T ). Using the method proposed by Horska et al. (11), a short-TR spectrum (see in Fig. 4A, TR = 0.3 s) and M0,PCr (Fig. 4B, TR = 12 s) were used to calculate the T
 , according to Eq. 14:
 |
(14) |
where TRshort and Mshort,PCr stand for the TR and PCr signal intensity of spectrum 4A, respectively. The calculation resulted in an estimated T of ∼4 s; therefore, a T
 value of 4.5 s (10% overestimation based on the mathematical simulation to compensate the possible errors in T
 measurement) was employed to calculate the d1,opt and d2,opt. Other parameters used in calculation are as follows: kf ∈ (0.2, 0.8) s−1, M0,PCr/M0,ATPγ = 2, and T
 /T
/T = 3. The calculation yielded a d1,opt value of 2 s and a d2,opt of 3.3 s. To compensate possible deviations in M0,PCr/M0,ATPγ and T
 /T
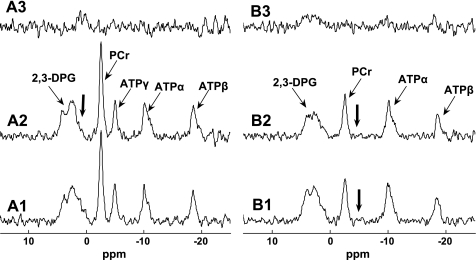
/T estimation, a saturation time of 3.5 s was applied based on the mathematical simulation. The spectra obtained with d1,opt and conventional strategies are shown in Fig. 5. There was no detectable difference in Mss,PCr measurement between the d1,opt and the conventional strategies (Fig. 5, B1–B3). However, substantial reductions in saturation time (56%) and total TR (73%) were granted by using the d1,opt strategy. A control spectrum (Fig. 5, A2) with saturation pulse set downfield to PCr symmetrically opposite from ATP-γ was also acquired. By comparing it with M0,PCr measurement (Fig. 5, A1), there was no detectable spillover effect on PCr peak with a saturation time of 8 s.
Fig. 4.
Spectra obtained for T calculation. T
 was estimated from Spencer's method (11) using two spectra: Mshort,PCr [TR = 0.3 s, number of averaged FIDs for one spectrum (nt) = 480] (A) and M0,PCr (TR = 12 s, nt = 12) (B). The vertical scale of A is 15 times that of B, and a larger data acquisition number was employed in A for better illustration of the spectra. Both spectra were obtained with a total acquisition time of 2.4 min. The spectra yielded a T
 value of ∼4 s, according to Eq. 14. 2,3-DPG, 2,3-diphosphoglycerate. See text for definition of terms.
Fig. 5.
Representative steady-state saturation transfer spectra for d1,opt strategy validation. Thick arrows indicate the frequency of saturation pulse. Spectrum A1 is the M0,PCr measurement (TR = 12 s and no saturation); spectrum A2 is the control spectrum with saturation pulse set downfield from PCr symmetrically opposite from ATP-γ (d1 = 12 s, d2 = 8 s). Spectrum A3 = A1 − A2. Spectra B2 and B1 are Mss,PCr measurements using d1,opt (d1 = 2 s and d2 = 3.5 s) and conventional (d1 = 12 s and d2 = 8 s) approaches, respectively. Spectrum B3 = B1 − B2. All spectra were acquired with 12 averaged FIDs, and the total acquisition times for spectra A1, A2, B1, and B2 were 2.4, 4, 4, and 1.1 min, respectively. The spectra demonstrated an identical Mss,PCr measurement obtained by d1,opt and conventional approaches and no spillover effect on PCr signal provided by B1-insensitive train to obliterate signal (BISTRO) saturation pulse.
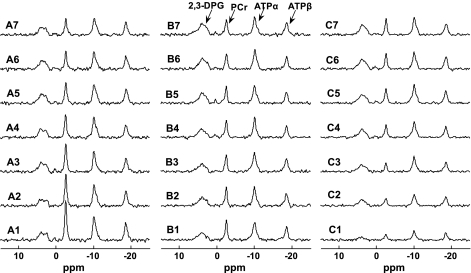
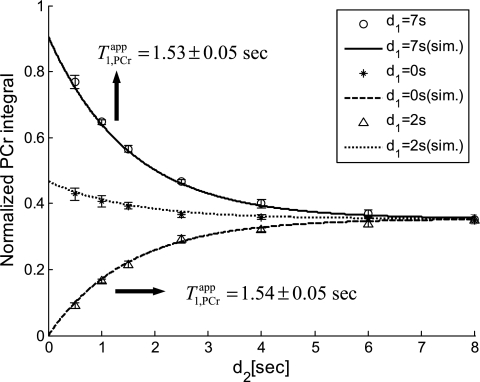
A further validation of our novel MST strategy was performed using progressive saturation experiments with long, short, and optimal presaturation delays (Fig. 6). As saturation times prolonged, PCr peak intensities from all three different presaturation delays approached toward the same Mss,PCr value. However, in contrast to the long or short presaturation delays (Fig. 6, A and C), an initial value of MPCr very close to Mss,PCr was granted when d1,opt was applied (Fig. 6, B). This further demonstrated the underlying mechanism of saturation time reduction of our d1,opt strategy. A quantification of these progressive saturation experiments was performed and shown in Fig. 7. The PCr peak areas obtained in progressive saturation experiments from four independent pig hearts were integrated, normalized to M0,PCr of each heart, and then fitted into the analytic solution of Eq. 7 as follow:
 |
(15) |
where MPCr(0) is the initial value of MPCr(t) at the start of saturation. Least squares fitting yielded T values of 1.53 ± 0.05 s from d1 = 7 s curve and 1.54 ± 0.05 s from d1 = 0 s curve, respectively. The almost identical T
 values retrieved from both curves demonstrate that the short-d1 progressive saturation can be employed to measure the T
 instead of the conventional long-d1 counterpart, as stated earlier. The compiled data from four pigs comparing the conventional and novel approaches from the same heart are summarized in Table 2. Here a TR = 1.5 s spectrum instead of the whole d1 = 0 curve was used to calculate the T
 , according to Eq. 10, so that the maximum reduction in TR could be achieved. The detailed reductions in data acquisition time using the novel strategy are summarized in Table 3.
Fig. 6.
Typical progressive saturation spectra from same heart with different presaturation delays of 7 s (A), 2 s (B), and 0 s (C). Spectra 1–7 (bottom to top) represent prolonged saturation on ATP-γ of 0.5, 1, 1.5, 2.5, 4, 6, and 8 s, respectively. Total data acquisition times for A, B, and C are 14.5, 7.5, and 5.6 min, respectively. These spectra confirmed the simulation results as shown in Fig. 2.
Fig. 7.
Quantification of progressive saturation experiments (typical set of spectra illustrated in Fig. 6). PCr peak integrals obtained from each progressive saturation experiment (d1 of 0, 2, and 7 s) were normalized by the M0,PCr value of each heart and plotted against the saturation pulse duration. Data shown were from four independent pig hearts, with error bars representing the standard deviation. Also shown in the figure were simulation results (lines) using the kf and T values from Table 2. This figure provided a quantitative validation of our novel MST strategy. See text for definition of T
 .
.
Table 2.
Comparison of measurements between novel and conventional MST strategies from the same hearts of four pigs
| Strategy | M0,PCr − Mss,PCr/M0,PCr | T1,PCrapp, s | T1,PCrapp, s | kf, s |
|---|---|---|---|---|
| Conventional | 0.65±0.01 | 1.53±0.05 | 4.3±0.2 | 0.42±0.01 |
| Novel | 0.65±0.01 | 1.56±0.08 | 4.4±0.2 | 0.42±0.03 |
In the conventional approach, progressive saturation transfer experiment with long d1 was employed to obtain T1,PCrapp, and long d1 plus long d2 was employed for Mss,PCr measurement. kf was calculated using Eq. 3, and T1,PCrapp was calculated using Eq. 2. The novel approach used d1,opt plus d2,opt to obtain the Mss,PCr measurement. T1,PCrapp was calculated from two spectra (B2 in Fig. 5 and C3 in Fig. 6), according to Eq. 10: T1,PCrapp = −TR/ln(1 − MTR,PCr/Mss,PCr). Statistical analysis showed no significant difference in any measurement obtained by novel and conventional strategies.
Table 3.
Comparison of total data acquisition time required for MST measurements between novel and conventional strategies
| Strategy | M0 and Mss, TR × nt, s | T1,PCrapp, TR × nt × np, s | kf, min |
|---|---|---|---|
| Conventional | (12 + 20) × 12 | 14.6 × 12 × 6 | 23.9 |
| Novel | (12 + 5.5) × 12 | 1.5 × 30 × 1 | 4.3 |
T1,PCrapp was calculated from curve fitting of 6 time points (np = 6). In the conventional approach, 14.6 is the average TR for 6 points. All points were acquired with 12 averaged FIDs (nt = 12). In the novel approach, only TR = 1.5 s spectrum (nt = 30, Fig. 6C3) was used to calculate T1,PCrapp, together with Mss measurement (nt = 12, Fig. 5B2), according to Eq. 10.
DISCUSSION
This technical report demonstrates a novel approach in MST experiments that results in a significant reduction in total data acquisition time, as well as the duration of saturation pulse. Although the concept has been validated only on myocardial CK reaction in the heart, this approach can be applied to other enzyme reactions (such as ATPase) in any solid organs.
Superior performance compared with conventional MST strategy.
The most important advantage of the novel strategy is the reduction of TR: the d1,opt approach in steady-state saturation transfer experiment would reduce TR by 73% (5.5 s in d1,opt approach vs. 20 s in conventional approach), and the total acquisition time for a complete kf measurement could be reduced by 82% (4.3 min in novel approach vs. 23.9 min in conventional approach, Table 3).
This reduction in TR is significant and will have several future applications. First, it will allow us to determine myocardial CK forward flux rate with transmural differentiation to separate inner layers vs. outer layers in open-chest preparation. In an early study using a model of normal dog heart, the CK flux measurements with spatial localization required ∼6 h of data acquisition time for one experimental condition (21). Such a long data acquisition time excludes the CK kinetic measurement of a diseased heart, or CK flux rate changes in response to experimental interventions. Second, the novel strategy will facilitate the high field human MST studies using an external coil, in which case similar spatial localization is required. The data acquisition time would be prohibitively long, should a conventional approach be applied. The strategy presented in this work is compatible with various spatial localization techniques (such as 3D-ISIS and 3D-CSI) and thus would greatly facilitate applications, such as CK forward flux rate mapping. We have currently applied this strategy to investigate the ATP production rate via CK forward reaction of rat brain in combination with 3D-ISIS spatial localization techniques. A complete kf measurement using this novel strategy required only 43 min compared with ∼3 h in the conventional approach (7) (see appendix).
Another advantage brought by this novel strategy is the significant reduction in the duration of saturation pulse train required for Mss,PCr measurement (56% reduction, 3.5 s in d1,opt approach vs. 8 s in conventional approach). The first beneficial effect from this reduction is the minimal spillover effect on PCr peak of the saturation pulse train and thus better SNR for quantification. In the present study, the novel strategy, together with BISTRO saturation pulse train, yielded no detectable spillover effect on PCr peak (Fig. 5A). Consequently, the control spectrum usually employed in other MST studies (25, 29) can be eliminated. A second benefit from the reduced saturation time is related to the specific absorption rate issue when human subjects are involved. The minimal saturation time provided by d1,opt strategy can, to a large extent, relieve the Food and Drug Administration concerns on heat generation by long duration of saturation pulse train employed in conventional MST strategy.
Other merits of the novel strategy.
Recently, an important four-angle saturation transfer method has been developed and utilized for measuring CK reaction rates in humans (4, 23, 27). This method employs a short TR (TR ≤ T ) and different flip angles to calculate the M0,PCr, Mss,PCr, and T
 . This method is very time efficient, and better SNR within a given data acquisition time can be achieved by flip angle optimization. However, the M0,PCr, Mss,PCr, and T
 calculations of the four-angle saturation transfer method heavily rely on the accuracy of designed flip angles. This could potentially be difficult at a higher field because of the characteristics of B1 penetration in high field magnet. A homogeneous flip angle may not be achieved at high field, even though adiabatic pulses such as BIR4 or BIRP are employed. The novel strategy demonstrated in the present study, as an alternative method, can provide the following advantages, in addition to reductions in TR and saturation time. Both M0,PCr and Mss,PCr are directly measured, which enables the simple calculation of kf and insensitivity to flip angle variation. For T
 calculation, the novel strategy requires only one ATP-γ-saturated spectrum (Fig. 6, C3) in addition to Mss,PCr measurement, according to Eq. 10. The TR for ATP-γ-saturated spectrum can be arbitrary, and maximum SNR per unit time can be achieved by a simple 90° readout pulse, if TR is chosen to be around T
 . (When ATP-γ is saturated, PCr magnetization relaxes according to T
 , and thus Ernst angle will be 90° if TR = T
 ).
).
Validity of the methodology.
The validity of the new methodology was tested in a pig heart model. The results from the novel strategy were the same as for the conventional MST method with long presaturation delay (Table 2). The T values retrieved from d1 of 0- and 7-s curves were identical (Fig. 7). This is consistent with our numerical analysis. The kf value calculated by using our new strategy yielded a value of 0.42 ± 0.03 s−1 that is similar to our laboratory's previous report of 0.41 ± 0.03 s−1 (20).
Although we have provided two equations (Eqs. 3 and 4) for conventional MST methods, all of the kf calculations described in this work utilized Eq. 3. A number of previous studies indicated that the T is independent of physiological conditions (1, 2, 20, 30); however, variations of T
 values are observed in the literature (Table 4). This is likely due to different animal models and different experimental preparations. Therefore, we would recommend direct determination of T
 value and use of Eq. 3 for kf calculation instead of Eq. 4, together with T
 obtained from the literature. The major reason that Eq. 4 was preferred in some studies is because it eliminates the lengthy acquisition time used for progressive saturation experiment to retrieve T
 . However, by using the novel strategy, T
 can be calculated from one extra ATP-γ-saturated spectrum with arbitrary TR. The advantage of this kf calculation strategy is that it requires no approximation or assumption.
Table 4.
CK kinetic measurements reported from previous studies
| Ref. No. | Species and Condition | T1,PCrint, s | T1,ATPγint, s | kf, s−1 |
|---|---|---|---|---|
| 5 | Isolated rat heart | 2.5 | 0.8 | 0.67 |
| 2 | Isolated rat heart | 2.06 | 0.75 | 0.27∼1.3 |
| 9 | Isolated rat heart | 2.7 | 0.9 | 0.84 |
| 6 | Isolated rat heart | 2.78 | 0.99 | NA |
| 20 | Open-chest pig heart | 2.2 | NA | 0.2∼0.41† |
| 29 | Open-chest pig heart | 2.02 | NA | 0.31∼0.49‡ |
| 30 | Open-chest dog heart | 3.75 | NA | 0.57 |
| 19 | Closed-chest human heart | 5.3 | 2.7 | NA |
| 27 | Closed-chest human heart | NA | NA | 0.21∼0.32§ |
Study based on porcine left ventricular remodeling model secondary to myocardial infarction. A significant decrease in kf value was observed in congestive heart failure group (0.21 ± 0.03 s−1) compared with normal group (0.41 ± 0.03 s−1).
Study based on porcine heart failure model secondary to aortic banding. A significant decrease in kf value was observed in congestive heart failure group (0.31 ± 0.03 s−1) compared with normal group (0.49 ± 0.07 s−1).
Study based on human heart with normal, stressed, and failing conditions. The kf value of failing human hearts (0.21 ± 0.07 s−1) was significant smaller compared with normal subjects (0.32 ± 0.07 s−1). NA, not applicable.
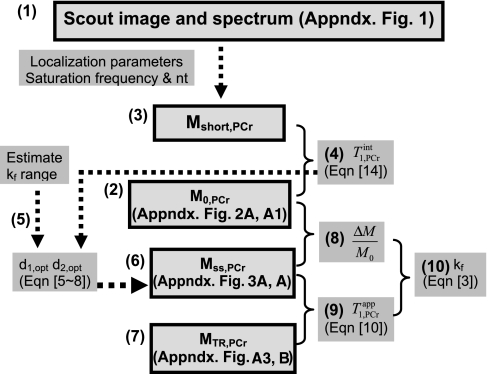
For the purpose of this novel strategy being readily used by other investigators, and especially those doing patient studies, we summarized a flow chart in Fig. 8 to clearly specify each steps of a magnetic resonance protocol that one could follow in practice to obtain the noninvasive kf measurements.
Fig. 8.
Flow chart showing each data acquisition step in implementing the novel MST strategy. Bold boxes indicate the actual measurements from spectra. MST protocol: the implement of novel MST strategy for noninvasive creatine kinase (CK) flux rate measurement of any solid organs. All spectra are acquired with 90° flip angle. (1) Take scout images (Fig. A1, left) to guild the spatial localization of the spectroscopy. Choose the region of interest, and take a scout spectrum (Fig. A1A). Number of averaged FIDs for each spectrum is determined here according to signal-to-noise ratio (SNR). The scout spectrum also provides the frequency offset information for the saturation pulse. The TR for scout spectra can be varied according to best SNR per unit acquisition time. (2) Take M0,PCr measurement (Fig. A2A1) with the same spatial localization parameters as used in scout spectrum. The TR for M0,PCr measurement is usually 9∼18 s, depending on the allowed data acquisition window. (3) Take Mshort,PCr measurement with very short repetition time (TR = 0.3 s). (4) Combine step 2 and 3 measurements to calculate T using Eq. 14. Note that we only need to make this measurement for an initial few subjects, because the T
 is considered as a constant and is independent of physiological conditions. (5) Estimate a viable kf range, then combine it with the T
 value to calculate d1,opt and d2,opt via numerical simulation of Eqs. 5–8. TR = d1,opt + d2,opt. (6) Take Mss,PCr measurement (Fig. A3A) using TR from step 5. (7) Take MTR,PCr measurement (Fig. A3B) with ATP-γ continuously saturated. The TR here can be arbitrary according to Eq. 10. The SNR per unit acquisition time can be maximized if the TR is chosen to be around T
 . (8) Calculate ΔM/M0 from step 2 and 6 measurements. (9) Calculate T
 from steps 6 and 7 measurements using Eq. 10. (10) Combine results from steps 8 and 9 to calculate kf using Eq. 3.
Conclusion.
Here, we have demonstrated a novel strategy for MST experiments that provides 82% reduction in total data acquisition time compared with the conventional MST method. The new strategy is based on the numerical analysis of the governing equations of magnetization relaxation and was validated using an in vivo swine model. This MST strategy can be readily applied to study of other enzyme kinetics (such as ATPase) and in other important organs.
GRANTS
This work was supported by US Public Health Service Grants. M. N. Jameel was supported by American Heart Association Greater Midwest Predoctoral Award no. 0810015Z.
APPENDIX
Objective
This appendix serves to demonstrate that the novel MST strategy is compatible with spatial localization of 3D-ISIS pulse sequence for noninvasive measurement of ATP production rate via CK. The total data acquisition time was decreased by 76% compared with conventional MST methods.
Methods
Animal preparation.
The experiments were performed using a rat brain model, and details of animal preparation for 31P-MRS have been described previously (7). Briefly, rats were anaesthetized via inhalation of 2% isofluorane, intubated, and ventilated by a mechanical respirator. The femoral artery and vein were catheterized for blood sampling and monitoring of physiological parameters. The rectal temperatures were maintained at 37 ± 1°C throughout the experiment with an external heating patch.
In vivo 31P-MRS experiments.
All in vivo 31P-MRS experiments were conducted on a 9.4-T horizontal animal magnet (Magnex Scientific) interfaced with a Varian INOVA console. A multinuclear radio-frequency surface-coil probe, consisting of a butterfly-shaped 1H surface coil and an elliptical-shaped 31P surface coil with axes of 12 mm and 10 mm, was used. The 1H surface coil was used to acquire anatomical images of the brain to guide choosing the regions of interest and for shimming magnetic field homogeneity. For 31P spectroscopy, a 3D-ISIS pulse sequence was used for spatial localization. BISTRO pulse train was used to achieve frequency selective saturation, and an adiabatic half-passage pulse was used for readout. To help visualize whether the spatial localization was adequate, two capillaries filled with 10% phosphoric acid were inserted into the skeletal muscle surrounding the skull.
The optimized MST strategy.
The d1,opt strategy was employed for Mss,PCr measurement. The parameters used for calculating d1,opt and d2,opt were from literature (7) and are summarized in Table A1. Those parameters gave rise to a d1,opt value of 2.1 s and d2,opt of 3.4 s. For T measurement, a short-TR (TR = 1.4 s) spectrum with continuous saturation of ATP-γ was performed and used in combination with Mss,PCr measurement to calculate the T
 , according to Eq. 10.
Table A1.
Parameters used for d1,opt and d2,opt calculation
| Parameters | T1,ATPγint, s | T1,ATPγint, s | kf,CK, s−1 |
|---|---|---|---|
| Values | 4.0 | 1.33 | 0.15 ∼ 0.6 |
See Ref. 7.
Results
Spatial localization of 3D-ISIS sequence.
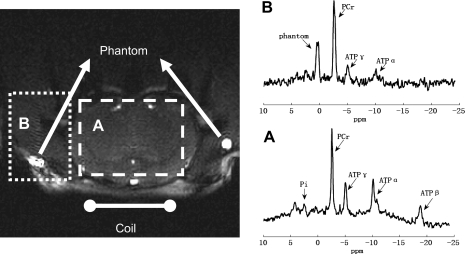
A demonstration of spatial localization of 3D-ISIS pulse sequence is shown in Fig. A1. The spatial localization from 3D-ISIS pulse sequence is demonstrated by the following observations: 1) no detectable phantom signal in brain region (spectrum A); 2) the obvious low and high PCr-to-ATP ratios (PCr/ATP) in spectra A and B that are characteristic of brain and skeletal muscle, respectively.
Fig. A1.
Demonstration of spatial localization from 3D-ISIS pulse sequence on rat brain. Localized spectra (TR = 9 s, nt = 128) from brain (A) and skeletal muscle (B) were obtained with corresponding regions of interest shown on top of the axial image of rat brain (turbo FLASH sequence). Each spectrum was acquired with 19.2 min. The smaller SNR of muscle spectrum is due to farther distance from the surface coil that was positioned next to the brain region.
Validation of novel MST strategy in rat brain model.
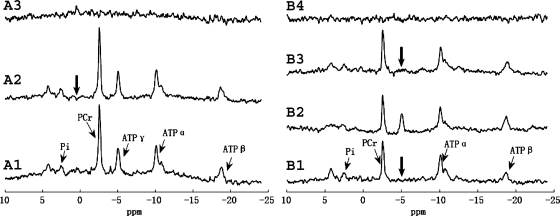
First, the d1,opt strategy was validated. The spectra with d1,opt and conventional strategies for M0,PCr and Mss,PCr measurements are shown in Fig. A2. There was no detectable difference in Mss,PCr measurement between the d1,opt and the conventional strategies (Fig. A2, B). An extra spectrum (Fig. A2, B2) with TR = d1,opt and saturation pulse off was also acquired to further confirm the d1,opt strategy. Spectrum B2 generated a PCr signal very close to Mss,PCr measured in B1 and B3, which is consistent with our d1,opt hypothesis that MPCr(d1,opt) ≈ Mss,PCr. For M0,PCr measurement (Fig. A2, A), the spillover effect of BISTRO saturation pulse train on PCr peak was again negligible.
Fig. A2.
Experimental validation of d1,opt strategy on rat brain. All spectra were acquired with 3D-ISIS pulse sequence and 128 averaged FIDs. A1 is M0,PCr measurement (TR = 9 s); A2 is the control spectrum with saturation pulse set downfield from PCr symmetrically opposite from ATP-γ; spectrum A3 = A1 − A2, from which we can see there is no spillover effect of the BISTRO saturation pulse. Spectra B1 and B3 are Mss,PCr measurements using conventional (d1 = 9 s, d2 = 8 s) and novel (d1 = d1,opt = 2.1 s, d2 = d2,opt = 3.4 s) strategies, respectively. Spectrum B2 was acquired with TR = d1,opt = 2.1 s and saturation pulse off. Spectrum B4 = B3 − B1. The bold arrows indicate the frequency of saturation pulses. Total acquisition times for spectra A1, A2, B1, B2, and B3 were 19.2, 36.3, 36.3, 4.5, and 11.7 min, respectively.
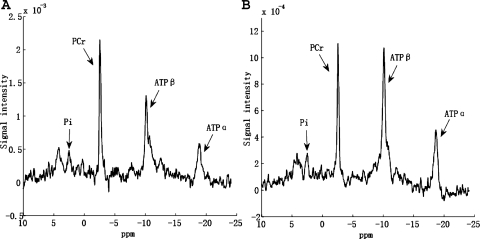
The T measurement using the novel strategy is shown in Fig. A3. Here, a two-spectrum method using Eq. 10 was employed for T
 calculation. All of the measurements obtained from the novel strategy are summarized in Table A2, along with data obtained from a previous study (7) for comparison. The novel strategy generated a mean kf value of 0.22 ± 0.02 s−1 from six rats, which is similar to the reported value of 0.24 ± 0.02 s−1 under the same condition. Moreover, a 76% reduction in total acquisition time was achieved [43 min for novel strategy vs. 180 min for conventional strategy (7)].
Fig. A3.
T measurement from two spectra. Spectrum A is the Mss,PCr measurement (same as spectrum B3 in Fig. A2). Spectrum B was acquired with ATP-γ continuously saturated and relatively shorter TR (TR = 1.4 s, nt = 512). Total acquisition times for spectra A and B were 11.7 and 11.9 min, respectively. T
 is calculated using Eq. 10: T
 = −TR/ln(1 − MTR,PCr/Mss,PCr).
Table A2.
Rat brain CK MST measured by in vivo 31P-magnetic resonance spectroscopy
| Source | T1,PCrapp, s | T1,PCrint, s | kf,CK, s−1 | Acquisition Time, min |
|---|---|---|---|---|
| This work (n = 6) | 1.90 ± 0.09 | 3.3±0.3 | 0.22±0.02 | 43* |
| Literature (7) | NA | 3.68±0.50 | 0.24±0.02 | ∼180† |
Acquisition time is based on TR = 9 s for M0,PCr measurement, TR = 5.5 for Mss,PCr measurement and TR = 1.4 s for T1,PCrapp measurement. Both M0,PCr and Mss,PCr measurements were acquired with 128 averaged FIDs, while short-TR measurement was acquired with 512 averaged FIDs for comparable signal-to-noise ratio.
Acquisition time is based on mean TR of 12 s, 5-point progressive saturation transfer experiment for T1,PCrapp measurement plus TR = 9 s for M0,PCr and TR = 15 s for Mss,PCr measurement. All measurements were obtained from 128 averaged FIDs.
Conclusion
We have successfully demonstrated the compatibility of the novel MST strategy with the 3D-ISIS spatial localization and an external coil for completely noninvasive MST measurement. The strategy was validated using a rat brain model, which generates a kf measurement similar to the reported value with only 24% of total data acquisition time compared with the conventional approach.
REFERENCES
- 1.Bittl JA, Balschi JA, Ingwall JS. Effects of norepinephrine infusion on myocardial high-energy phosphate content and turnover in the living rat. J Clin Invest 79: 1852–1859, 1987. [DOI] [PMC free article] [PubMed] [Google Scholar]
- 2.Bittl JA, Ingwall JS. Reaction rates of creatine kinase and ATP synthesis in the isolated rat heart. J Biol Chem 260: 3512–3517, 1985. [PubMed] [Google Scholar]
- 3.Bloch F. Nuclear induction. Phys Rev 70: 460–474, 1946. [Google Scholar]
- 4.Bottomley PA, Ouwerkerk R, Lee RF, Weiss RG. Four-angle saturation transfer (FAST) method for measuring creatine kinase reaction rates in vivo. Magn Reson Med 47: 850–863, 2002. [DOI] [PMC free article] [PubMed] [Google Scholar]
- 5.Degani H, Laughlin M, Campbell S, Shulman R. Kinetics of creatine kinase in heart: a 31P NMR saturation- and inversion-transfer study. Biochemistry 24: 5510–5516, 1985. [DOI] [PubMed] [Google Scholar]
- 6.Dobson GP, Veech RL, Passonneau JV, Kobayashi K, Inubushi T, Wehrli S, Nioka S, Chance B. 31P NMR and enzymatic analysis of cytosolic phosphocreatine, ATP, Pi and intracellular pH in the isolated working perfused rat heart. NMR Biomed 5: 20–28, 1992. [DOI] [PubMed] [Google Scholar]
- 7.Du F, Zhu XH, Zhang Y, Friedman M, Zhang NY, Ugurbil K, Chen W. Tightly coupled brain activity and cerebral ATP metabolic rate. Proc Natl Acad Sci USA 105: 6409–6414, 2007. [DOI] [PMC free article] [PubMed] [Google Scholar]
- 8.Friedrich J, Nascimben L, Liao R, Ingwall JS. Phosphocreatine TI measurements with and without exchange in the heart. Magn Reson Med 30: 45–50, 1993. [DOI] [PubMed] [Google Scholar]
- 9.Goudemant JF, vander Elst L, Dupont B, Van Haverbeke Y, Muller RN. pH and temperature effects on kinetics of creatine kinase in aqueous solution and in isovolumic perfused heart. A 31P nuclear magnetization transfer study. NMR Biomed 7: 101–110, 1994. [DOI] [PubMed] [Google Scholar]
- 10.Hendrich K, Merkle H, Weisdorf S, Vine W, Garwood M, Ugurbil K. Phase-modulated rotating frame spectroscopic localization using an adiabatic plane-rotation pulse and single surface coil. J Magn Reson 92: 258–275, 1991. [Google Scholar]
- 11.Horska A, Horsky J, Spencer RGS. Measurement of spin-lattice relaxation times in systems undergoing chemical exchange. J Magn Reson 110: 82–89, 1994. [Google Scholar]
- 12.Hu Q, Wang X, Lee J, Mansoor A, Liu J, Zeng L, Swingen C, Zhang G, Feygin J, Ochiai K, Bransford TL, From AH, Bache RJ, Zhang J. Profound bioenergetic abnormalities in peri-infarct myocardial regions. Am J Physiol Heart Circ Physiol 291: H648–H657, 2006. [DOI] [PubMed] [Google Scholar]
- 13.Ingwall JS, Kramer MF, Fifer MA, Lorell BH, Shemin R, Grossman W, Allen PD. The creatine kinase system in normal and diseased human myocardium. N Engl J Med 313: 1050–1054, 1985. [DOI] [PubMed] [Google Scholar]
- 14.Ingwall JS, Weiss RG. Is the failing heart energy starved? On using chemical energy to support cardiac function. Circ Res 95: 135–145, 2004. [DOI] [PubMed] [Google Scholar]
- 15.Katz AM. Is the failing heart energy depleted? Cardiol Clin 16: 633–644, viii, 1998. [DOI] [PubMed]
- 16.Lei H, Ugurbil K, Chen W. Measurement of unidirectional Pi to ATP flux in human visual cortex at 7 T by using in vivo 31P magnetic resonance spectroscopy. Proc Natl Acad Sci USA 100: 14409–14414, 2003. [DOI] [PMC free article] [PubMed] [Google Scholar]
- 17.Liu H, Zhang J. An efficient MR phosphorous spectroscopic localization technique for studying ischemic heart. J Magn Reson Imaging 10: 892–898, 1999. [DOI] [PubMed] [Google Scholar]
- 18.McConnell HM. Reaction rates by nuclear magnetic resonance. J Chem Phys 28: 430–431, 1958. [Google Scholar]
- 19.Menon RS, Hendrich K, Hu X, Ugurbil K. 31P NMR spectroscopy of the human heart at 4 T: detection of substantially uncontaminated cardiac spectra and differentiation of subepicardium and subendocardium. Magn Reson Med 26: 368–376, 1992. [DOI] [PubMed] [Google Scholar]
- 20.Murakami Y, Zhang JY, Eijgelshoven MHJ, Chen W, Carlyle WC, Zhang Y, Gong GR, Bache RJ. Myocardial creatine kinase kinetics in hearts with postinfarction left ventricular remodeling. Am J Physiol Heart Circ Physiol 276: H892–H900, 1999. [DOI] [PubMed] [Google Scholar]
- 21.Robitaille PM, Abduljalil A, Rath D, Zhang H, Hamlin RL. Transmural saturation transfer analysis of the creatine kinase system in the mammalian heart. Magn Reson Med 30: 4–10, 1993. [DOI] [PubMed] [Google Scholar]
- 22.Saupe KW, Spindler M, Hopkins JCA, Shen WQ, Ingwall JS. Kinetic, thermodynamic, and developmental consequences of deleting creatine kinase isoenzymes from the heart. J Biol Chem 275: 19742–19746, 2000. [DOI] [PubMed] [Google Scholar]
- 23.Smith CS, Bottomley PA, Schulman SP, Gerstenblith G, Weiss RG. Altered creatine kinase adenosine triphosphate kinetics in failing hypertrophied human myocardium. Circulation 114: 1151–1158, 2006. [DOI] [PMC free article] [PubMed] [Google Scholar]
- 24.Spencer RGS, Fishbein KW. Measurement of spin-lattice relaxation times and concentrations in systems with chemical exchange using the one-pulse sequence: breakdown of the Ernst model for partial saturation in nuclear magnetic resonance spectroscopy. J Magn Reson 142: 120–135, 2000. [DOI] [PubMed] [Google Scholar]
- 25.Ugurbil K, Petein M, Maidan R, Mishurshi S, From AHL. Measurement of an individual rate constant in the presence of multiple exchanges: application to myocardial creatine kinase reaction. Biochemistry 25: 100–107, 1986. [DOI] [PubMed] [Google Scholar]
- 26.Ventura-Clapier R, Saks VA, Vassort G, Lauer C, Elizarova GV. Reversible MM-creatine kinase binding to cardiac myofibrils. Am J Physiol Cell Physiol 253: C444–C455, 1987. [DOI] [PubMed] [Google Scholar]
- 27.Weiss RG, Gerstenblith G, Bottomley PA. ATP flux through creatine kinase in the normal, stressed, and failing human heart. Proc Natl Acad Sci USA 102: 808–813, 2005. [DOI] [PMC free article] [PubMed] [Google Scholar]
- 28.Wyss M, Smeitink J, Wevers RA, Wallimann T. Mitochondrial creatine kinase: a key enzyme of aerobic energy metabolism. Biochim Biophys Acta 1102: 119–166, 1992. [DOI] [PubMed] [Google Scholar]
- 29.Ye Y, Gong GR, Ochiai K, Liu JB, Zhang JY. High-energy phosphate metabolism and creatine kinase in failing hearts : a new porcine model. Circulation 103: 1570–1576, 2001. [DOI] [PubMed] [Google Scholar]
- 30.Ye Y, Wang CS, Zhang JY, Cho YK, Gong GR, Murakami M, Bache RJ. Myocardial creatine kinase kinetics and isoform expression in hearts with severe LV hypertrophy. Am J Physiol Heart Circ Physiol 281: H376–H386, 2001. [DOI] [PubMed] [Google Scholar]
- 31.Zhang JY. Myocardial energetics in cardiac hypertrophy. Clin Exp Pharmacol Physiol 29: 351–359, 2002. [DOI] [PubMed] [Google Scholar]
- 32.Zhang JY, Merkle H, Hendrich K, Garwood M, From AHL, Ugurbil K, Bache RJ. Bioenergetic abnormalities associated with severe left-ventricular hypertrophy. J Clin Invest 92: 993–1003, 1993. [DOI] [PMC free article] [PubMed] [Google Scholar]
- 33.Zhang JY, Wilke N, Wang Y, Zhang Y, Wang CS, Eijgelshoven MHJ, Cho YK, Murakami Y, Ugurbil K, Bache RJ, From AHL. Functional and bioenergetic consequences of postinfarction left ventricular remodeling in a new porcine model–MRI and P-31-MRS study. Circulation 94: 1089–1100, 1996. [DOI] [PubMed] [Google Scholar]


