Abstract
The explanation for prone and supine differences in tissue density and pleural pressure gradients in the healthy lung has been inferred from several studies as compression of dependent tissue by the heart in the supine posture; however, this hypothesis has not been directly confirmed. Differences could also arise from change in shape of the chest wall and diaphragm, and because of shape with respect to gravity. The contribution of this third mechanism is explored here. Tissue density and static elastic recoil were estimated in the supine and prone left human lung at functional residual capacity using a finite-element analysis. Supine model geometries were derived from multidetector row computed tomography imaging of two subjects: one normal (subject 1), and one with small airway disease (subject 2). For each subject, the prone model was the supine lung shape with gravity reversed; therefore, the prone model was isolated from the influence of displacement of the diaphragm, chest wall, or heart. Model estimates were validated against multidetector row computed tomography measurement of regional density for each subject supine and an independent study of the prone and supine lung. The magnitude of the gradient in density supine (−4.33%/cm for subject 1, and −4.96%/cm for subject 2) was nearly twice as large as for the prone lung (−2.72%/cm for subject 1, and −2.51%/cm for subject 2), consistent with measurements in dogs. The corresponding pleural pressure gradients were 0.54 cmH2O/cm (subject 1) and 0.56 cmH2O/cm (subject 2) for supine, and 0.29 cmH2O/cm (subject 1) and 0.27 cmH2O/cm (subject 2) for prone. A smaller prone gradient was predicted without shape change of the “container” or support of the heart by the lung. The influence of the heart was to constrain the shape in which the lung deformed.
Keywords: pleural pressure gradient, lung orientation, acute lung injury, acute respiratory distress syndrome
prone posture has been advocated for patients with acute lung injury or the acute respiratory distress syndrome because of observed improvement in gas exchange in several studies. Acute lung injury and acute respiratory distress syndrome involve acute pulmonary edema and inflammation, and they also typically involve reduced lung compliance, surfactant deficiency, and airway collapse. The improvement to gas exchange in the prone posture is not completely understood; however, several factors have been suggested to be involved: turning prone expands the tissue in the dorsal region (7), thereby improving local ventilation and drainage of secretions while reducing shunt; improved ventilation-perfusion matching; and reduced compression of lung tissue by the heart (1, 2, 14). It is likely that the beneficial effect on gas exchange arises from a combination of mechanisms; however, it is still not clear how significant their relative contributions are. A common element of each of the contributing factors is that they are influenced by the mechanical behavior of the lung: ventilation and perfusion are directly dependent on lung volume changes and tethering forces; expansion of de-recruited tissue is a direct result of mechanical stretch; and inflammatory events involve cell signaling that is likely to be stretch mediated. The mechanics of the lung tissue is therefore an “integrating mechanism,” and it is important to understand its contribution to functional differences that are observed with posture.
The normal, healthy, supine lung typically has a larger tissue density gradient and pleural pressure gradient (∇Ppl) than the lung in the prone posture. Differences in the density gradient have been measured in humans (22, 23), and both density and ∇Ppl in animals (11–14, 25, 31). This difference in the healthy lung is typically explained as compression of dependent tissue by the heart in the supine posture (1, 2, 20). The hypothesis that the heart causes compression in the dependent tissue of the supine lung is based on observations of the volume of tissue beneath the heart when supine (1) and a number of finite-element (FE) modeling studies (2, 20). Previous FE analyses considered the effect of postural differences on deformation in idealized models of the dog lung. It is not yet clear whether the interaction between heart and lung is the same in humans as it is in dogs. We have used a combined imaging and computational modeling approach to study the human lung as its balance of stress and strain reconfigures with posture as a first step toward better understanding of the mechanics of postural changes in the injured lung. A computational model of the left human lung of two subjects was derived using multidetector row computed tomography (MDCT) imaging in the supine posture. The computational model was used to explore whether significant and physiologically consistent gradients in density and Ppl could develop without movement of the heart, chest wall, and diaphragm as the lung turned from supine to prone.
METHODS
Imaging data.
The human imaging data that were used in the present study were acquired at the University of Iowa Comprehensive Lung Imaging Center (I-Clic). The imaging data form part of an imaging-based “Human Lung Atlas” that is currently under development through a Bioengineering Research Partnership (NIH R01-HL-064368, E. A. Hoffman PI). Imaging of all subjects in the human atlas database has been approved by the University of Iowa Institutional Review Board and Radiation Safety Committees.
Images used in this study consisted of a spiral scan of the full lung in the supine posture with inflation level held at either 95% vital capacity [here assumed to represent total lung capacity (TLC)] or at functional residual capacity (FRC). Images were acquired using a Siemens Sensation 64 MDCT scanner. Scan parameters were as follows: 120 kV, 100 mA, a pitch of 1.2, slice width 0.6 mm, and slice interval 0.6 mm.
Two subjects were selected from the Human Lung Atlas database. The two subjects were chosen because they represented physical extremes in the database: a large healthy man, and a smaller woman with small-airway disease (but still classified as “normal”). Subject 1 was a white non-Hispanic 25-yr-old man with body mass index of 25.05. The subject was a nonsmoker with forced expiratory volume in 1 s of 4.84 l/min (95% predicted), forced vital capacity of 6.09 liters (97% predicted), residual volume (RV) of 2.37 liters, FRC of 4.47 liters, and TLC of 8.47 liters. During supine imaging, the subject's ratio of FRC to TLC was 0.49. Subject 2 was a white non-Hispanic 20-yr-old woman with body mass index of 21.8. The subject was a nonsmoker with small-airway disease, with forced expiratory volume in 1 s of 3.03 l/min (80% predicted), forced vital capacity of 4.11 liters (93% predicted), RV of 1.93 liters, FRC of 3.36 liters, and TLC of 6.19 liters. During supine imaging, the subject's ratio of FRC to TLC was 0.43.
FE model of lung geometry.
The lungs were segmented from the stack of images using custom-built software (PASS, Pulmonary Analysis Software Suite, University of Iowa). Segmented images were imported into the CMGUI software for volumetric rendering (http://www.cmiss.org/cmgui). Densely packed points were calculated to lie on the rendered lung surface.
Only the geometry of the left lung was modeled and used for simulation studies. The lung was considered as a continuous solid, and the lobes were not modeled separately. The left lung was selected because this should maximize interaction with the heart, and because only one fissure was neglected rather than two in the right lung. For each subject, a curvilinear FE volume mesh was fitted to the geometric data points that were calculated to lie on the rendered lung surface at TLC. The geometric fitting method is described in detail in Fernandez et al. (5) and Tawhai et al. (28). Cubic Hermite interpolation functions (in each of the three coordinate directions) were chosen to represent the surface curvature and to enforce derivative continuity at the mesh nodes (3). A matching “pleural cavity” mesh was created to fit exactly against the surface of the model lung at TLC. The nodal displacement of the pleural surface from TLC to FRC was calculated. Each mesh was oriented such that the z coordinate was aligned with the craniocaudal axis, and the y coordinate was aligned with the dorsoventral axis. The computational and visualization software package CMISS (http://www.cmiss.org) was used for geometry fitting and for later computation of tissue stress and strain.
Soft tissue mechanics.
The lung tissue undergoes relatively large strains during normal ventilation and due to the action of gravity on the tissue. Finite deformation elasticity is, therefore, the appropriate governing theory for calculating deformation of the lung tissue. The lung-air matrix was assumed to be a compressible, nonlinearly elastic continuum with homogeneous and isotropic material properties.
A precise reference volume (Vref) for the in vivo lung, at which the tissue is under zero stress and strain, is not likely to exist in practice (9). The undeformed Vref was assumed to be a uniform scaling of the TLC lung geometry to 50% of FRC. This differs from previous studies that scale to a proportion of TLC (19, 29). Scaling proportional to FRC means that Vref is lower than RV for these subjects.
The strain energy density function in Eq. 1 was used to relate stress and strain in the tissue. This function has the same form as used in previous studies of lung tissue mechanics (8, 17, 29), but without differentiating between the contributions of tissue elasticity and surface forces to the lung's elastic properties. This empirical strain energy function (W) is not related to tissue microstructure, nor is it based directly on experimental measurement. It was used to represent gross in vivo tissue behavior in a similar manner to earlier studies that use bulk (μ) and shear moduli (μ).
 |
(1) |
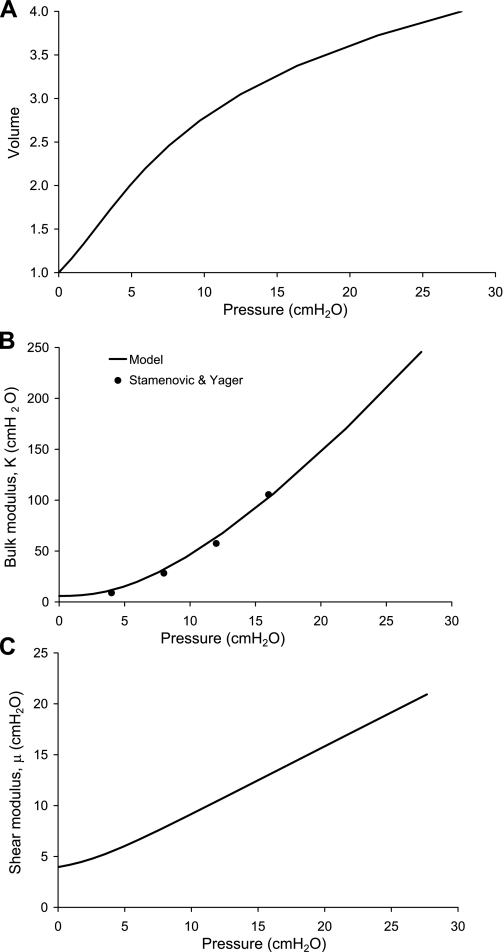
where J1 and J2 are the first and second invariants of the Green strain tensor. The coefficients a (0.433, dimensionless), b (−0.611, dimensionless), and c (2.5 kPa or 25.5 cmH2O) in Eq. 1 do not have a physical meaning. Their values were set such that uniform expansion of the tissue from Vref to FRC and TLC in zero gravity resulted in elastic recoil pressures of ∼5 cmH2O (0.49 kPa) and 30 cmH2O (2.94 kPa), respectively. The pressure-volume curve for this material and the effective K and μ derived from an isotropic expansion are shown in the appendix, Fig. A1.
The tissue density measured for the two subjects at FRC was ρFRC = 0.28 and 0.31 g/cm3 for subjects 1 and 2, respectively. The tissue density in the undeformed reference state (ρref) was set to ρref = ρFRC × FRC/Vref = 0.56 g/cm3 (subject 1) and 0.62 g/cm3 (subject 2) under the assumption that the total mass of the lung does not change between FRC and the reference state. This density includes blood in the vasculature, tissue, and extravascular water. Note that tissue density ρ in g/cm3 can be converted to conventional computed tomography density Hounsfield units by the approximation, Hounsfield units = −1,000 (1 − ρ), assuming that the combined lung tissue elements have a density of ∼1 g/cm3.
Simulation conditions.
Regional volume change and distribution of stress and strain were compared at FRC in the prone and supine postures under a normal gravitational load (9.81 m/s2). Simulations were controlled by changing the volume and/or shape of the pleural cavity. The deformable lung model was constrained to stay in contact with the pleural cavity, but was free to slide using frictionless contact constraints. A line of nodes along the dorsal-most surface and a line of nodes along the ventral “edge” were fixed to zero displacement in the gravitational axis, but free to displace in the other two directions, to prevent translation during the simulation. For a step change in the volume or shape of the pleural cavity, an orthogonal projection of the surface nodes of the deformable lung model was calculated. The surface nodes were displaced to the projected locations (in contact with the pleural mesh), and the forces required to maintain this geometry were calculated to act as boundary tractions for successive simulation steps.
For each posture simulation, the lung was first inflated in zero gravity from the reference geometry to FRC. Gravity was added incrementally to the expanded geometry in a second solution using the expanding forces calculated from the zero gravity expansion and contact constraint as boundary loads. The contact forces were calculated and updated for each incremental gravity load.
An important point to note is that the shape of the cavity did not change between postures: in each case, the cavity shape was that of the surface geometry for the supine (imaged) lung. Neither the heart, chest wall, nor diaphragm was displaced during inversion of posture. Displacement of these structures would normally be expected with a change in posture; however, the present study examines only the change in static tissue mechanics associated with a change in direction of gravity and not shape. FRC has been reported to be lower when measured with the subject supine than when prone (21), but this was not included here.
RESULTS
Approximately 10,000 points distributed uniformly throughout each left lung model were sampled for analysis of the mechanics solutions. Results are presented as regional distributions of means and SDs for parameters of interest. In each figure, the sampled values are averaged in 10-mm-thick slices in the direction of gravity (along the dorsoventral axis).
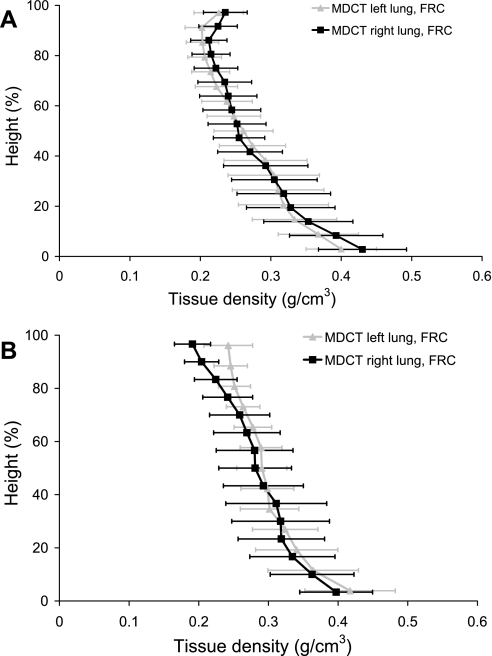
Figure 1 compares the gravitational density distribution in the left and right lungs at FRC calculated from the MDCT imaging for the two subjects. For each subject, the distribution of density with gravity is similar in both lungs, despite the inclination of the heart toward the left lung.
Fig. 1.
Density (g/cm3) against gravitational height (dorsoventral axis) for the supine left and right lungs at functional residual capacity (FRC) for subject 1 (A) and subject 2 (B). Density calculated from the multidetector row computed tomography (MDCT) imaging is presented as averages within 10-mm-thick isogravitational sections (±SD). The dorsal surface is at 0% height, and the ventral surface is at 100% height.
The regional density (ρ) was calculated from the density at the Vref and the local change in tissue volume using Eq. 2:
 |
(2) |
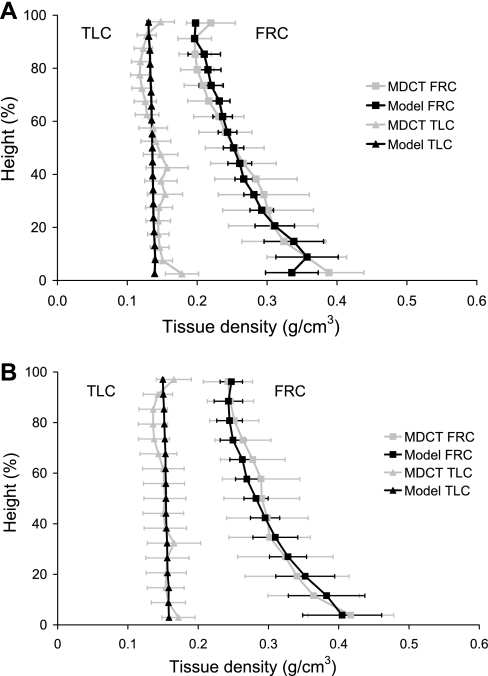
where vref is the local tissue volume in the reference state (Vref/10,000), and v is the local tissue volume after expansion. The ratio v/vref was calculated at each of the sample point locations, as the square root of the determinant of the right Cauchy-Green strain tensor. In Fig. 2, the regional tissue density in the left lung models is compared with regional measurements from the supine MDCT imaging for the left lung. MDCT density is plotted as mean values within 10 mm isogravitational slices. Density in the FRC lung is greater than at TLC at all locations. For both subjects at both inflation volumes, the model predicts less variability in tissue density within an isogravitational slice than is measured by MDCT.
Fig. 2.
Density (g/cm3) against gravitational height (dorsoventral axis) for the model and measured supine left lung at FRC (right-hand side) and total lung capacity (TLC; left-hand side) for subject 1 (A) and subject 2 (B). Densities calculated from the MDCT imaging (shaded line) and the finite-element model (solid line) are presented as averages within 10-mm-thick isogravitational sections (±SD). The dorsal surface is at 0% height, and the ventral surface is at 100% height.
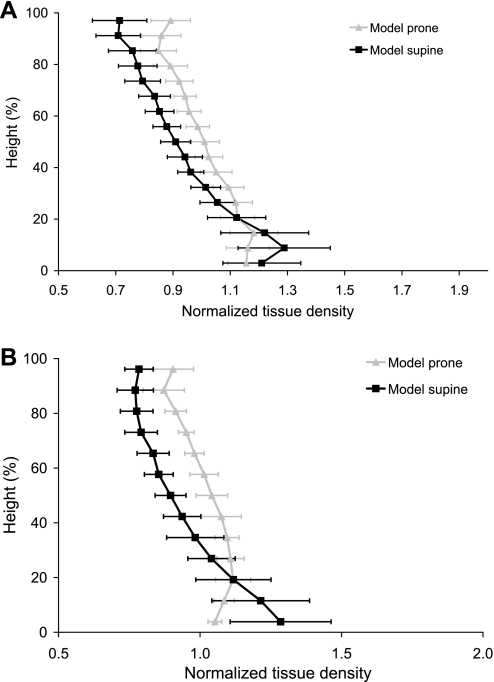
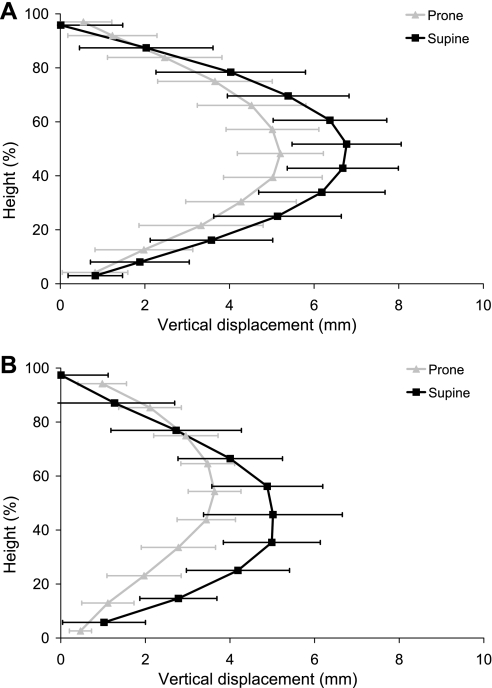
Density in the prone and supine postures at FRC is compared in Fig. 3. The gradient in density in the models was estimated as the slope of the linear least squares fit to the ∼10,000 model sample points. The gradient in density at FRC for subject 1 supine was −0.0113 g·cm−3·cm−1 (−4.06%/cm, R2 = 0.75) and −0.0120 g·cm−3·cm−1 (−4.34%/cm, R2 = 0.72) for the MDCT measurement and model, respectively. For subject 2, the supine gradients were −0.0123 g·cm−3·cm−1 (−3.93%/cm, R2 = 0.75) and −0.0156 g·cm−3·cm−1 (−4.96%/cm, R2 = 0.63) for measurement and model, respectively. The gradient in density predicted by the model for the prone posture was −0.0076 g·cm−3·cm−1 (−2.72%/cm, R2 = 0.74) and −0.0079 g·cm−3·cm−1 (−2.51%/cm, R2 = 0.64) for subjects 1 and 2, respectively, which was approximately one-half of the magnitude of the supine gradient. The displacements of the sample points in the gravitational axis are shown in Fig. 4. These are the displacements from the FRC zero-gravity state to the final configuration (with gravity). The displacements in the supine posture for both subjects are larger than prone throughout most of the tissue.
Fig. 3.
Normalized tissue density (density/mean density) plotted against gravitational height (dorsoventral axis) for the finite-element model left lung in the prone and supine postures at FRC for subject 1 (A) and subject 2 (B). Densities calculated for the prone model (shaded line) and the supine model (solid line) are presented as averages within 10-mm-thick isogravitational sections (±SD). 0% height corresponds to the dorsal surface for the supine results and to the ventral surface for the prone results.
Fig. 4.
Displacements due to gravity plotted against gravitational height (dorsoventral axis) for the finite-element model left lung in the prone and supine postures at FRC for subject 1 (A) and subject 2 (B). The displacements are in the gravitational axis, calculated from the FRC volume without gravity to the final configuration due to gravity. Displacements in the prone model (shaded line) and the supine model (solid line) are presented as averages within 10-mm-thick isogravitational sections (±SD). 0% height corresponds to the dorsal surface for the supine results and to the ventral surface for the prone results.
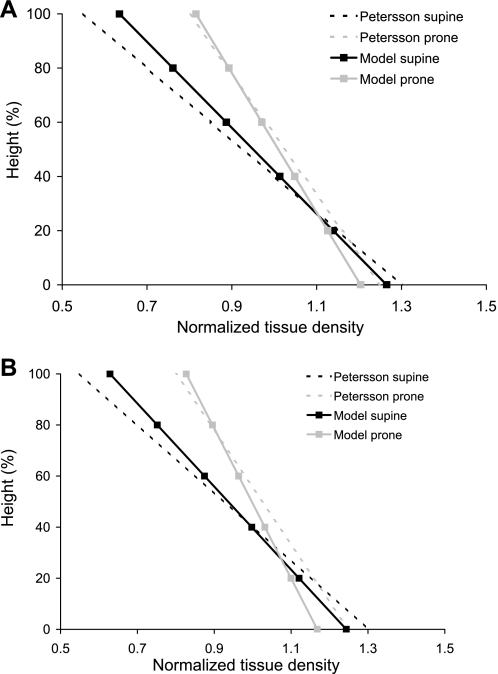
Imaging data were not available for these subjects in the prone posture: imaging was acquired at only two inflation volumes and one posture to limit radiation exposure. Direct comparison with prone regional density measurements, therefore, cannot be made for these subjects or for other subjects in the Human Lung Atlas database to date. To verify that the deformation of the prone model is consistent with previous observations, normalized density against normalized height was compared with measurements from Petersson et 1al. (22) for the lung near FRC, prone and supine (Fig. 5). Petersson et al. measured human lung tissue density near FRC using single-photon emission computed tomography. They presented their results as normalized density against normalized height, for supine and prone. The two models predict the same trend as the measurements, namely, that the gradient in tissue density is smallest when the lung is prone. The normalized tissue density gradient is similar for the two models and measurement.
Fig. 5.
Normalized tissue density (density/mean density) against gravitational height (dorsoventral axis) for the finite-element model left lung in the prone and supine postures at FRC for subject 1 (A) and subject 2 (B). Normalized densities calculated for the prone model (shaded line) and the supine model (solid line) are compared with normalized gradients from Petersson et al. (22).
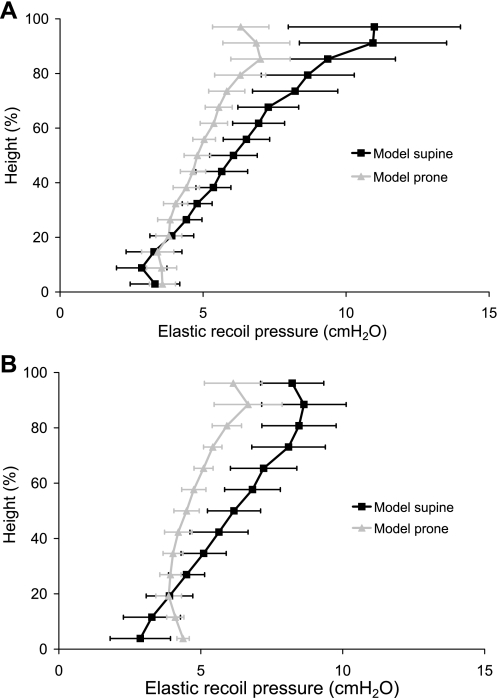
Elastic recoil pressure was calculated as the average of the principal Cauchy stresses for the volumetric strain. The elastic recoil pressure (average local tissue stress) is related to the volumetric strain by the strain energy density function. For a uniformly expanded homogeneous lung in zero gravity, the elastic recoil pressure would be equal in magnitude to the Ppl, and Ppl would be constant over the surface. For a regularly shaped solid deformed by gravity, the elastic recoil pressure in an isogravitational plane would be equal in magnitude to the surface pressure in that plane, and surface pressure would vary with gravitational height. In Fig. 6, the mean elastic recoil pressure can be considered as an estimate of the Ppl magnitude. Elastic recoil pressure in Fig. 6 varies within an isogravitational slice, with markedly more variation when the models are supine. The ∇Ppl was estimated as the gradient in elastic recoil pressure, calculated as the slope of the linear least squares fit to the ∼10,000 model sample points. ∇Ppl for subject 1 was 0.54 cmH2O/cm (R2 = 0.76) and 0.29 cmH2O/cm (R2 = 0.71) for supine and prone, respectively. And for subject 2 ∇Ppl was 0.56 cmH2O/cm (R2 = 0.74) and 0.27 cmH2O/cm (R2 = 0.62) for supine and prone, respectively.
Fig. 6.
Elastic recoil pressure (cmH2O) against gravitational height (dorsoventral axis) calculated in the finite-element model left lung in the supine (solid line) and prone (shaded line) postures at FRC for subject 1 (A) and subject 2 (B). Recoil pressures are shown for averages within 10-mm slices ± SD.
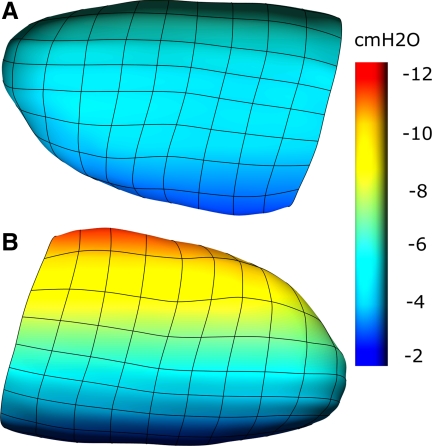
Figure 7 illustrates the surface (pleural) pressures developed in the lung model for subject 1 in response to gravity and posture. The same color scale is used for each simulation. The tissue is pulled in the direction of gravity, but the displacements are smallest in the prone lung.
Fig. 7.
Surface (pleural) pressures in a finite-element model of a normal, healthy human lung (subject 1). The model is shown in the prone (A) and supine (B) postures. The color spectrum ranges from −2 to −12 cmH2O.
DISCUSSION
This study presents application of a computational model of static lung mechanics to explaining differences in physiological function in the prone and supine human lung. We have used a combined approach of imaging and computational modeling to study the uniformity of tissue density and elastic recoil pressure. The present work suggests that an underlying feature of the normal lung in the prone posture is a more uniform density distribution and less heterogeneity in density or elastic recoil pressure than when in the supine posture. These differences are present, even in the absence of heart, chest wall, or diaphragm displacement, although they are expected to be exaggerated by any displacements or shape changes that are associated with the change in posture.
The lung surface is constrained to remain in (sliding) contact with the thoracic wall. In the prone position, the volume of nondependent tissue adjacent to the constrained surface is large, and therefore the downward (gravitational) displacement is restricted compared with the supine lung, where the nondependent tissue volume is small. To illustrate that geometry with respect to gravity can introduce complex deformations, we consider the simple example in Figs. A2 and A3 (appendix). A simple wedge subjected to a body (gravity) force can develop very different gradients in expansion for different orientations of the wedge, if only one surface is unable to displace (the wedge is “suspended”). This simple example cannot completely explain deformation in the more complex geometry of the lung model, because the lung is not completely fixed at either the dorsal or ventral surface, nor is it freely suspended from only one surface. The shape of the lung is also considerably more complex than in this example. The difference in deformation between the prone and supine postures in the lung-shaped model was less pronounced than in the suspended wedge, so it is likely that its deformation behavior is somewhere between the two illustrative examples in the appendix.
The left lung is generally expected to experience more compression of tissue by the heart than the right lung, because more lung tissue lies beneath the heart in the left lung due to the leftward orientation of the heart (1). We would, therefore, expect to see a difference in tissue density between the two lungs in the dependent region. No such difference is obvious in Fig. 1 for the two subjects whom we studied, nor for other human subjects whom we have compared (not shown here). This supports the hypothesis that the normal healthy lung tissue changes shape easily to accommodate the relative displacement of the heart with posture, hence minimizing real tissue compression.
The simulation of regional density supine compares well with MDCT density measurement for the same subject at both FRC and TLC (Fig. 2). The major difference between each model and measurement is that the MDCT density was more variable within an isogravitational slice than was predicted by the model. This is because, in the model, the tissue was assumed to be a continuous medium. In contrast, in the real lung, an image voxel contains air, blood, and tissue. The imaging should, therefore, be expected to show more variability than the models because of partial volume effects of these scattered tissue elements. The comparison of the predicted and measured supine density is the only direct method for validating the static deformation of the models. Regional prone density was not available for these subjects, but comparison with independent measurements from Petersson et al. (22) (Fig. 5) suggests that our model develops a reasonable distribution. In the study by Petersson et al., the prone lung had a smaller gradient in density than supine, which with the current model predictions are consistent. The gradients for the models presented in Fig. 5 were calculated as linear least squares fits to density at all of the ∼10,000 sample points, normalized by mean density. The straight lines do not represent the regional characteristics of the density distributions.
The ∇Ppl (0.54 and 0.29 cmH2O/cm for supine and prone, respectively, in subject 1, and 0.56 and 0.27 cmH2O/cm in subject 2) developed in the models in both postures are consistent with measurements in supine and prone dogs [0.46 cmH2O/cm supine, and 0.23 cmH2O/cm prone (31)]. For these two subjects, the predicted gradient supine was larger than measurements in dogs. Measurements of Ppl in humans are limited to estimates via an esophageal balloon. It is not yet know whether Ppl differs between humans and quadruped animals, or whether the trend for a much lower ∇Ppl prone is also present in humans. However, volumetric stress and strain are nonlinearly and consistently related; therefore, if the human lung has a smaller density gradient when prone, it follows that the ∇Ppl should also be smaller.
Comparison with previous studies.
In contrast to earlier studies, we explore the mechanism whereby density gradients can arise without heart or diaphragm displacement. Although heart and diaphragm displacement will make some additional contribution to gradients in density, in our model, their displacement was not necessary to develop a significant difference in ∇Ppl between the prone and supine posture, since the model chest wall and heart shape were the same in the two postures. Hyatt et al. (16) measured an increase in transpulmonary pressure (Ptp) in head-up dogs when the weight of the heart was increased by adding mercury. They also emphasized that their findings applied only to the dog because, in that species, there is a very loose coupling of the pericardium to the sternum or diaphragm. In the experimental study, the increased pressure gradient was interpreted to reflect increased support of the heart by the lung tissue as heart weight increased, and therefore compression of the tissue beneath the heart. In light of the predictions made in our work, the greater Ptp gradient could also be interpreted as resulting from a change in shape available for the lung to fill. In a review of stress transmission in the lung, Fredberg and Kamm (6) point out that the lung tissue readily changes shape in response to a load, and less readily changes volume. This fits with the notion that the healthy tissue displaces as the heart moves, rather than compresses beneath the heart.
Hoffman (11) measured regional tissue density in prone and supine dogs, concluding that the position of the mediastinal contents was important for observed differences in density when prone and supine. The same conclusion was drawn from comparison of tissue density in supine and prone dogs and sloth (12). Albert and Hubmayer (1) also observed significant displacement of the human lung to accommodate the ventral displacement of the heart when prone at TLC and concluded that tissue compression was relieved when prone. However, their study was based on two primary observations: that the density gradient is greatest when supine, and that the tissue volume below the heart was greatest when supine. Our model analysis agrees with these previous observations and with the hypothesis that the intrathoracic position of the mediastinal contents is important in determining lung air content (or density) distributions (11). However, our interpretation is that the location of the mediastinal contents with respect to gravity is more important than heart weight per se: the normal healthy lung tissue deforms around the heart, thereby avoiding compression. The degree to which the heart displaces with posture may differ between species, depending on the extent of the ligamentous attachments between the pericardium and the diaphragm, sternum, and vertebrae. The role of these attachments is to tether the heart stably in the chest (15). As noted by Hyatt et al. (16) and Wilson and Meek (32), the pericardio-diaphragmatic attachments in dog can be loose and are variable. In contrast in human they are described as “…very broad and usually very firm…” (32). This implies that the displacement of the heart with posture may be less in humans than in some dogs. The attachments to diaphragm, sternum, and vertebrae can support a large fraction of the weight of the heart. Our model analysis suggests that, even if the ligamentous attachments were to completely prevent displacement of the heart, the density gradient prone and supine would still be different. For a heart that is not significantly constrained by attachment to the diaphragm or chest wall, increased heart weight would cause a greater shift in its location, which could further increase the density gradient and ∇Ppl.
Liu et al. (20) computed deformation of the dog lung in the prone and supine postures at FRC. In a similar approach to the present study, they imposed a shape change in a FE model at the lung surface to mimic imaging. They concluded that difference in shape between supine and prone postures was important, but also that the weight of the heart and abdomen was important in developing postural differences in the lung. In their study, the tissue was assumed to remain in-plane during a shape change from TLC to FRC. This could restrict the ability of the tissue to shift from “beneath” the heart in their model. Furthermore, the present work considers postural differences in the human lung, which could differ significantly from the quadruped lung studied by Liu et al. (20). Bar-Yishay et al. (2) used a FE analysis to interpret the measurements of Hyatt et al. (16). A linear elastic model with small deformation equations was used, where the model first underwent a uniform inflation, and then gravity was imposed. Increasing the density of the heart region in their model increased the Ptp gradient. An important point is that the heart and lung regions in their model were assumed to have no independent movement (no slip between them). In our model, the heart surface (the medial surface of the bounding “pleural cavity” corresponding to the heart) and the lung surface slide freely. As the heart is displaced downwards (gravitationally), the lung tissue slides freely past the heart, avoiding the compression that would be caused by not allowing slip between the heart and lung.
Model limitations and extensions.
The effect of posture on density distribution is considered here independent of the displacement of the chest cavity, diaphragm, and heart that would usually accompany a change in posture. The model also does not account for any shift in regional blood content that accompanies a postural or volume change. A disadvantage of this study is, therefore, that the integrated effect of these influencing factors is not accounted for in the model; conversely, an advantage is that the influence of gravity alone can be discerned, without the influence of the other factors. Extension of the model for other applications would benefit from inclusion of separate models of the mediastinal structures, diaphragm, and chest wall; however, this would increase the complexity of the model considerably.
The left lung was modeled as a continuous solid, neglecting the oblique fissure that partitions the two lobes. Neglecting the fissure reduces the complexity of the model and the degree of difficulty for implementation: correctly simulating frictionless contact between two compressible bodies (the lobes) as gravity pulls them apart is a far more difficult problem than imposing frictionless contact between a compressible and a rigid body. Lee et al. (19) modeled the fissures and heart surface; however, they represented the lung as an axisymmetric paraboloid and as a paraboloid with elliptical cross section. With an idealized nonanatomic geometry, boundary conditions can be chosen that allow relative motion of the model lobes, but this is not suitable for a model with anatomical geometry and complex deformation. Introducing lobes could reduce the heterogeneity in the supine model. The larger ∇Ppl supine is not likely to change, however, because that would imply a change in the density gradient that was not consistent with the experimental measurements.
The material law does not differentiate between tissue elasticity and surface forces. The present study only considers the static lung at FRC; the interplay between surface and tissue forces and energy dissipation will be important for simulating the lung dynamics that are not considered here. The strain energy density function effectively lumps together the tissue and surface forces, in a similar manner to the K and μ that have been widely used in previous studies of static lung mechanics (4, 30). The behavior of the material law (appendix, Fig. A1) is consistent with measurements of K and μ. The coefficients in the strain energy density function were set such that uniform expansion to FRC and TLC would require physiologically reasonable pressures. The coefficients were, therefore, different from those used previously (8, 17), to better represent the greater compliance in the in vivo “lumped” elastic system than is represented by the coefficients for the tissue forces alone (8, 17). The same material law is used for both subjects, with the only difference being the volumes at FRC and Vref, and ρref. The sensitivity of the model estimations to the coefficients of the strain energy density function is predictable: any change in a coefficient that serves to “stiffen” the tissue at FRC lessens the difference in the supine and prone gradients. This is similar to shifting the lung volume closer to TLC, where there is barely any difference in the model supine and prone gradients.
Fig. A1.
Behavior of the material law used to represent the lung tissue-air matrix, for isotropic inflation of a unit cube. A: pressure-volume relationship from the reference state (zero inflation, volume = 1) to four times the reference state. B: the bulk modulus K = V dP/dV. C: the shear modulus μ calculated for a small shear imposed on the uniformly inflated cube.
The reference state (zero stress and strain) was assumed to be a uniform scaling of the TLC shape to one-half the volume of FRC. Previous studies have set Vref as a proportion of TLC (19, 29). We chose to set Vref as a proportion of FRC because inspection of several subjects in the Human Lung Atlas database showed greater variability in the ratio of RV to TLC than RV to FRC. That is, for some subjects, scaling by TLC would give Vref larger than RV. Setting Vref as one-half FRC and setting ρref as twice ρFRC means that different subjects will have most similarity in elastic recoil pressure at FRC, and potentially greater differences at TLC, depending on the ratio of TLC to FRC. This may not be an accurate assumption, but it allows comparison between subjects without arbitrary influence on Vref by intersubject differences in TLC that are influenced significantly by muscle strength in the healthy subject.
The FRC shape in this study was isotropic with the TLC shape; therefore, the inflation from the reference geometry was a uniform expansion. The indented surface of lung adjacent to the heart was, therefore, also scaled isotropically, which effectively reduces the volume of the heart. To assess whether this was important for our conclusions, we tested the model using 1) FRC shape, and 2) with the heart indentation enlarged. Using the FRC shape gave the same regional results as for the TLC shaped model, and enlarging the heart surface only changed the density locally but not significantly.
The present investigation elucidates function in the normal healthy lung: it is important to understand whether postural differences are a normal feature of the lung and how they might differ in injury or disease.
One limitation in extending this model to studying disease states is that the model tissue is assumed to be homogeneous and isotropic: even normal lung tissue is not homogeneous, and while its isotropy has not yet been determined, it is plausible that there may be some dependence on airway and blood vessel orientation. Experimental studies have concluded that the assumptions of homogeneity and isotropy are sufficient for gross deformation of the lung (27); however, in the presence of disease or edema, this assumption will no longer be valid. It is possible to add in a weight of fluid contribution to the tissue to model one mechanical consequence of edema; however, there are other interacting functions that will be important to consider. For example, different regions of lung may be variably affected in disease, and independent motion of individual lobes may be required for an accurate description of tissue displacement (24). While the present model is not yet complete for studying disease, it is a first step toward explaining how regional lung physiology is modified by mechanical factors.
GRANTS
This study was supported by National Heart, Lung, and Blood Institute Grants R01-HL-064368 and R33-HL-87788.
Acknowledgments
The authors thank Brett A. Simon for critical review of this work.
APPENDIX
The behavior of the material under isotropic expansion of a unit cube is summarized in Fig. A1. The pressure-volume relationship (Fig. A1A) is curvilinear and requires larger increments in pressure for expansion at high volumes than at low volumes. For volume = 1, the tissue is at the unexpanded reference state; for volume = 2 the tissue is expanded to the same extent as the lung model at FRC. Volume = 4 approximates the tissue expanded to TLC; however, this is variable between subjects, whereas the ratio of reference to FRC volumes is specified in the model.
The K (Fig. A1B) was calculated as V dP/dV for the volumetric expansion of the cube. Values of K from Stamenovic and Yager (26) are shown for comparison. The model K is consistent with the measurements over the range of 4–16 cmH2O (the extent of the measurements).
The μ (Fig. A1C) was calculated for a small displacement imposed on a uniform pressure inflation of the unit cube. The model μ is proportional to 0.63 Ptp, which compares well with 0.66 Ptp from dogs (10) and overlaps with the range of μ measured by Lai-Fook and Hyatt (18) in humans postmortem.
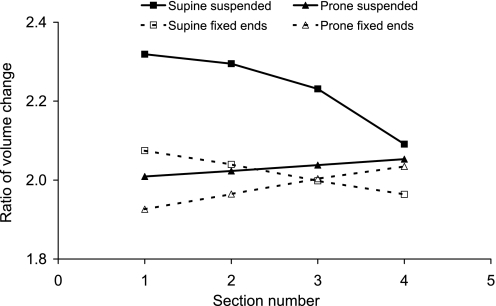
To understand how the shape with respect to gravity results in different density gradients, we consider the example illustrated in Fig. A2, where a simple volumetric wedge shape with the same material properties as the lung model is expanded to two times its references state (cf. FRC) and is subjected to a body (gravity) force. The wedge oriented such that gravity is in the direction of the widest surface (Fig. A2, B and D) is a simplistic representation of a horizontal section through the supine lung. The wedge with gravity in the direction of the narrowest surface (Fig. A2, C and E) represents a horizontal section through the prone lung. When the wedge is “suspended” such that gravity is in the direction of the free surface, deformation of the “supinelike” wedge in Fig. A3 is largest; the wide constrained surface restricts the downward deformation of the tissue. When both ends of the wedge are constrained, the two orientations develop a similar gradient in the volumetric deformation (Fig. A3); however, the supine wedge undergoes mostly expansion relative to the uniform geometry in Fig. A2A, and the prone wedge undergoes mostly compression. Neither the fully constrained (fixed at both ends) nor the suspended model fully represents the constraints on the more complex and curvilinear lung geometry. In the lung model, the boundary conditions do not fully constrain the displacement of either surface: only a small number of nodes is fixed in the gravitational direction to prevent translation of the model during the simulation, and the remainder of the surface nodes are free to displace in all three directions.
Fig. A2.
Deformation of a simple wedge geometry when subjected to a body force for no body force and isotropic expansion to twice the reference volume (sections are numbered as plotted in Fig. A3) (A), suspension from the narrow surface (B), suspension from the wide surface (C), and fixed at both ends and the body force direction, as indicated by the arrows (D and E).
Fig. A3.
Volumetric deformations corresponding to the displacements in Fig. A2. The ratio of volume change is shown for each section as labeled in Fig. A2A. Note that, for each condition, the wedge was initially expanded to twice its reference volume.
REFERENCES
- 1.Albert RK, Hubmayr RD. The prone position eliminates compression of the lungs by the heart. Am J Respir Crit Care Med 161: 1660–1665, 2000. [DOI] [PubMed] [Google Scholar]
- 2.Bar-Yishay E, Hyatt RE, Rodarte JR. Effect of heart weight on distribution of lung surface pressures in vertical dogs. J Appl Physiol 61: 712–718, 1986. [DOI] [PubMed] [Google Scholar]
- 3.Bradley CP, Pullan AJ, Hunter PJ. Geometric modeling of the human torso using cubic Hermite elements. Ann Biomed Eng 25: 96–111, 1997. [DOI] [PubMed] [Google Scholar]
- 4.de Wilde R, Clement J, Hellemans JM, Decramer M, Demedts M, Boving R, Van de Woestijne KP. Model of elasticity of the human lung. J Appl Physiol 51: 245–261, 1981. [DOI] [PubMed] [Google Scholar]
- 5.Fernandez JW, Mithraratne P, Thrupp SF, Tawhai MH, Hunter PJ. Anatomically based geometric modelling of the musculo-skeletal system and other organs. Biomech Model Mechanobiol 2: 139–155, 2004. [DOI] [PubMed] [Google Scholar]
- 6.Fredberg JJ, Kamm RD. Stress transmission in the lung: pathways from organ to molecule. Annu Rev Physiol 68: 507–541, 2006. [DOI] [PubMed] [Google Scholar]
- 7.Froese A, Bryan A. Effects of anesthesia and paralysis on diaphragmatic mechanics in man. Anesthesiology 41: 242–255, 1974. [DOI] [PubMed] [Google Scholar]
- 8.Fung YC Biomechanics: Motion, Flow, Stress, Growth. New York: Springer-Verlag, 1990.
- 9.Fung YC Stress, deformation, and atelectasis of the lung. Circ Res 37: 481–496, 1975. [DOI] [PubMed] [Google Scholar]
- 10.Hajji MA, Wilson TA, Lai-Fook SJ. Improved measurements of shear modulus and pleural membrane tension of the lung. J Appl Physiol 47: 175–181, 1979. [DOI] [PubMed] [Google Scholar]
- 11.Hoffman EA Effect of body orientation on regional lung expansion: a computed tomographic approach. J Appl Physiol 59: 468–480, 1985. [DOI] [PubMed] [Google Scholar]
- 12.Hoffman EA, Ritman EL. Effect of body orientation on regional lung expansion in dog and sloth. J Appl Physiol 59: 481–491, 1985. [DOI] [PubMed] [Google Scholar]
- 13.Hoffman EA, Ritman EL. Heart-lung interaction: effect on regional lung air content and total heart volume. Ann Biomed Eng 15: 241–257, 1987. [DOI] [PubMed] [Google Scholar]
- 14.Hubmayr RD, Walters BJ, Chevalier PA, Rodarte JR, Olson LE. Topographical distribution of regional lung volume in anesthetized dogs. J Appl Physiol 54: 1048–1056, 1983. [DOI] [PubMed] [Google Scholar]
- 15.Hutchison SJ Pericardial Diseases: Clinical Diagnostic Imaging Atlas. Philadelphia, PA: Saunders-Elsevier, 2008.
- 16.Hyatt RE, Bar-Yishay E, Abel MD. Influence of the heart on the vertical gradient of transpulmonary pressure in dogs. J Appl Physiol 58: 52–57, 1985. [DOI] [PubMed] [Google Scholar]
- 17.Kowalczyk P, Kleiber M. Modeling and numerical-analysis of stresses and strains in the human lung including tissue-gas interaction. Eur J Mech A-Solids 13: 367–393, 1994. [Google Scholar]
- 18.Lai-Fook SJ, Hyatt RE. Effects of age on elastic moduli of human lungs. J Appl Physiol 89: 163–168, 2000. [DOI] [PubMed] [Google Scholar]
- 19.Lee GC, Tseng NT, Yuan YM. Finite element modeling of lungs including interlobar fissures and the heart cavity. J Biomech 16: 679–690, 1983. [DOI] [PubMed] [Google Scholar]
- 20.Liu S, Margulies SS, Wilson TA. Deformation of the dog lung in the chest wall. J Appl Physiol 68: 1979–1987, 1990. [DOI] [PubMed] [Google Scholar]
- 21.Moreno L, Lyons H. Effect of body posture on lung volumes. J Appl Physiol 16: 27–29, 1961. [DOI] [PubMed] [Google Scholar]
- 22.Petersson J, Rohdin M, Sanchez-Crespo A, Nyren S, Jacobsson H, Larsson SA, Lindahl SGE, Linnarsson D, Neradilek B, Polissar NL, Glenny RW, Mure M. Posture primarily affects lung tissue distribution with minor effect on blood flow and ventilation. Respir Physiol Neurobiol 156: 293–303, 2007. [DOI] [PubMed] [Google Scholar]
- 23.Prisk GK, Yamada K, Henderson AC, Arai TJ, Levin DL, Buxton RB, Hopkins SR. Pulmonary perfusion in the prone and supine postures in the normal human lung. J Appl Physiol 103: 883–894, 2007. [DOI] [PMC free article] [PubMed] [Google Scholar]
- 24.Puybasset L, Cluzel P, Chao N, Slutsky AS, Coriat P, Rouby JJ. A computed tomography scan assessment of regional lung volume in acute lung injury. The CT scan ARDS study group. Am J Respir Crit Care Med 158: 1644–1655, 1998. [DOI] [PubMed] [Google Scholar]
- 25.Richter T, Bellani G, Harris RS, Vidal Melo MF, Winkler T, Venegas JG, Musch G. Effect of prone position on regional shunt, aeration, and perfusion in experimental acute lung injury. Am J Respir Crit Care Med 172: 480–487, 2005. [DOI] [PMC free article] [PubMed] [Google Scholar]
- 26.Stamenovic D, Yager D. Elastic properties of air- and liquid-filled lung parenchyma. J Appl Physiol 65: 2565–2570, 1988. [DOI] [PubMed] [Google Scholar]
- 27.Tai RC, Lee GC. Isotropy and homogeneity of lung tissue deformation. J Biomech 14: 243–252, 1981. [DOI] [PubMed] [Google Scholar]
- 28.Tawhai MH, Hunter PJ, Tschirren J, Reinhardt JM, McLennan G, Hoffman EA. CT-based geometry analysis and finite element models of the human and ovine bronchial tree. J Appl Physiol 97: 2310–2321, 2004. [DOI] [PubMed] [Google Scholar]
- 29.Tawhai MH, Nash MP, Hoffman EA. An imaging-based computational approach to model ventilation distribution and soft tissue deformation in the ovine lung. Acad Radiol 13: 113–120, 2006. [DOI] [PubMed] [Google Scholar]
- 30.West JB, Matthews FL. Stresses, strains, and surface pressures in the lung caused by its own weight. J Appl Physiol 32: 332–3445, 1972. [DOI] [PubMed] [Google Scholar]
- 31.Wiener-Kronish JP, Gropper MA, Lai-Fook SJ. Pleural liquid pressure in dogs measured using a rib capsule. J Appl Physiol 59: 597–602, 1985. [DOI] [PubMed] [Google Scholar]
- 32.Wilson JA, Meek WJ. The effect of the pericardium on cardiac distention as determined by the x-ray. Am J Physiol 82: 34–46, 1927. [Google Scholar]


