

Abstract
Shear wave velocity measurements are used in elasticity imaging to find the shear elasticity and viscosity of tissue. A technique called shear wave dispersion ultrasound vibrometry (SDUV) has been introduced to use the dispersive nature of shear wave velocity to locally estimate the material properties of tissue. Shear waves are created using a multifrequency ultrasound radiation force, and the propagating shear waves are measured a few millimeters away from the excitation point. The shear wave velocity is measured using a repetitive pulse-echo method and Kalman filtering to find the phase of the harmonic shear wave at 2 different locations. A viscoelastic Voigt model and the shear wave velocity measurements at different frequencies are used to find the shear elasticity (μ1) and viscosity (μ2) of the tissue. The purpose of this paper is to report the accuracy of the SDUV method over a range of different values of μ1 and μ2.
A motion detection model of a vibrating scattering medium was used to analyze measurement errors of vibration phase in a scattering medium. To assess the accuracy of the SDUV method, we modeled the effects of phase errors on estimates of shear wave velocity and material properties while varying parameters such as shear stiffness and viscosity, shear wave amplitude, the distance between shear wave measurements (Δr), signal-to-noise ratio (SNR) of the ultrasound pulse-echo method, and the frequency range of the measurements. We performed an experiment in a section of porcine muscle to evaluate variation of the aforementioned parameters on the estimated shear wave velocity and material property measurements and to validate the error prediction model.
The model showed that errors in the shear wave velocity and material property estimates were minimized by maximizing shear wave amplitude, pulse-echo SNR, Δr, and the bandwidth used for shear wave measurements. The experimental model showed optimum performance could be obtained for Δr = 3-6 mm, SNR ≥35 dB, with a frequency range of 100 to 600 Hz, and with a shear wave amplitude on the order of a few microns down to 0.5 μm. The model provides a basis to explore different parameters related to implementation of the SDUV method. The experiment confirmed conclusions made by the model, and the results can be used for optimization of SDUV.
I. Introduction
Inspection of the elastic properties of tissue is an emerging field in medical imaging research. One way to measure the viscoelastic properties of tissue is to measure shear wave propagation in tissue and calculate the shear wave velocity. Using this value, the shear modulus of the tissue can be calculated. The shear modulus of tissue has been shown to be an indicator of the presence of disease in tissues such as breast and liver [1]-[3].
Several research groups have introduced various methods to induce and measure shear waves in tissue. Magnetic resonance elastography (MRE) uses an acoustic driver to induce shear waves and an MRI scanner to measure the resulting motion [4]. Other groups have used either mechanical actuators or ultrasound radiation force to induce shear waves and ultrasonic imaging techniques to measure the wave propagation [5]-[12].
Most of these methods only estimate the shear elastic modulus from the shear wave data; however, there have been efforts by some groups to use dispersive models that account for the viscoelastic nature of the tissue [13]-[16]. To account for the viscoelastic nature of soft tissue and take advantage of the dispersive behavior of the shear wave velocity, Chen et al. introduced a method called shear wave dispersion ultrasound vibrometry (SDUV), which uses ultrasound radiation force to produce a harmonic shear wave and measure its propagation [17], [18]. This is performed at multiple frequencies to analyze the dispersion of the shear wave velocity, and then those values are fit by a model to obtain the shear elasticity and shear viscosity of the tissue.
Errors in the viscoelastic property estimates could impact diagnosis and potential treatment options. Some of the sources of error in this estimation relate to the accuracy of the measurement of motion. Accurate measurement of the shear wave propagation can depend on the tissue displacement amplitude, signal-to-noise ratio (SNR) of the ultrasound or MRI system, and patient motion whether internal or external.
The goal of this paper is to report the error sensitivities of the SDUV technique for estimating viscoelastic properties of tissue.
II. Methods
The displacement of a propagating shear wave can be modeled as [13]
| (1) |
where D0 is the displacement amplitude at r = r1, αs(ω) is the shear wave attenuation, ω is the angular frequency of the shear wave, and kr(ω) = ω/cs(ω), where cs(ω) is the shear wave velocity.
In a viscoelastic material modeled by the Voigt model the shear wave velocity and attenuation can be calculated with the following equations [16]:
| (2) |
| (3) |
In the Voigt model, μ1 and μ2 are the shear elasticity and viscosity, respectively, and ρ is the mass density of the medium.
In SDUV the shear wave of frequency ω can be measured by evaluating the phase difference at 2 different points along the propagation path [17]. For the purposes of this study, r1 is the reference position used to compute Δϕ.
| (4) |
Each measurement of the phase can be modeled where ϕ is the true phase and ϕe is the error in the phase estimate. We model the parameter ϕe as normal distribution with mean μϕ and standard deviation σϕ. The measured phase shift term can be modeled as
| (5) |
Because ϕe,1 and ϕe,2 are modeled as being normally distributed, the resulting Δϕe is also normally distributed with mean μe = μe,2 - μe,1 and variance ,
| (6) |
The shear wave velocity with the error terms included is
| (7) |
where . To complete the derivation, the error in the shear wave velocity is
| (8) |
| (9) |
| (10) |
The shear wave velocity error has a distribution defined by its mean, μe, which we also call bias, and standard deviation, σe, which we call the jitter. This error will then influence the error of the estimates of μ1 and μ2.
Shear wave attenuation will cause propagating shear waves to decrease in amplitude with distance. Therefore, the 2 phase measurements will be of vibration with different amplitudes. Using simulation data, we can estimate the phase bias and jitter associated with different displacement amplitudes. We can use these parameters to model Δϕe and use (2) and (7) to find the errors of estimating μ1 and μ2.
III. Simulation And Experiment
A. Simulation
A motion detection model of a vibrating scattering medium was used to analyze measurement errors of the vibration phase in a scattering medium [19]. This motion detection model uses pulse-echo measurements of a group of vibrating scatterers, a phase-based method [20] to estimate the motion, and a previously described Kalman filter to extract the displacement amplitude and phase [21]. The model used 1000 unique scattering phantoms to evaluate the bias and jitter associated with harmonic motion detection in a scattering medium.
For a given combination of μ1 and μ2, the true values of cs(ω) and αs(ω) were calculated for a range of frequencies using (2) and (3), respectively. Given Δr, the calculated cs(ω) can be used to find the phase shift Δϕ. Assuming a value of D0 at r1 = 2.0 mm from the excitation point, the displacement amplitude at r2 can be found using αs(ω) and (1) for the frequency range of interest. Using the results from the computational model in [19], the values of μe and σe can be determined and substituted into (6). This distribution can then be used to find in (7). The mean of at each frequency is used and the resulting points are used to perform a nonlinear regression of (2) in MATLAB (The MathWorks, Inc., Natick, MA) using a function called nlinfit.m to find estimates of μ1 and μ2. The effective shear wave velocity at each frequency could be expressed as . Fig. 1 shows the true and estimated shear wave velocities for 2 different combinations of μ1 and μ2 as an example of the data generated using this model.
Fig. 1.
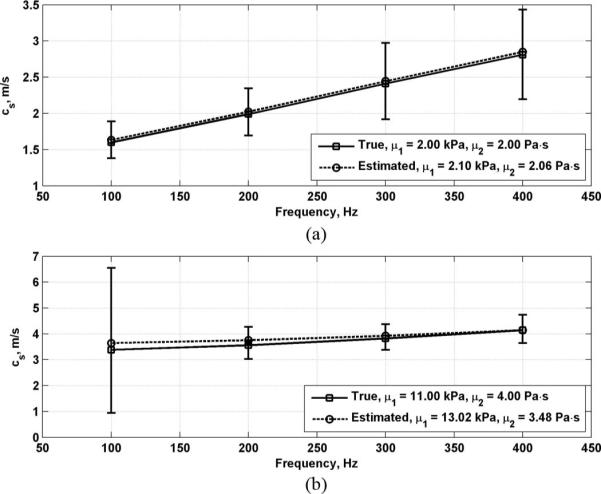
True and estimated shear wave velocity with curve fits to (2). open circles represent μe, the mean of phase difference error Δϕe; the error bars represent one standard deviation, σe, of Δϕe. (a) μ1 = 2.00 kPa, μ2 = 2.00 Pa·s; (b) μ1 = 11.00 kPa, μ2 = 4.00 Pa·s.
To assess the error sensitivities of the SDUV method, we modeled the effect of phase errors on estimates of shear wave velocity and material property while varying parameters such as μ1 and μ2, shear wave amplitude, Δr, signal-to-noise ratio (SNR) of the ultrasound pulse-echo method, and the frequency range of the measurements. For the purposes of this study, we assume that errors in Δr are negligible.
The ranges for μ1 and μ2 were 0 to 20 kPa and 0 to 10 Pa·s, respectively, as these ranges are of clinical relevance for different soft tissues such as liver and skeletal muscle [2], [3], [18], [22]. The default parameters for the simulations were D0 = 1.0 μm, Δr = 4 mm, SNR = 35 dB, and fm = 400 Hz. The shear wave velocities at 100, 200, …, fm were used for the curve fitting to find μ1 and μ2.
The default parameters were chosen based on experience with reported experiments [18], [19]. An initial displacement of D0 = 1.0 μm for each frequency component is achievable in most cases with radiation force excitation. A distance between measurements of Δr = 4 mm provides enough phase change to adequately determine the phase velocity of the shear wave. An SNR of 35 dB should be achievable in the imaging of soft tissues at reasonable depths of 3 to 5 cm. A maximum frequency of fm = 400 Hz will provide 4 data points for dispersion analysis. The shear wave should still have enough amplitude to be tracked adequately at 400 Hz. Curve fitting with 4 points has been found to be robust enough to accurately estimate the viscoelastic material properties.
B. Experiment
To evaluate variation of the aforementioned parameters on the shear wave velocity and material property measurements and to validate the computer model we performed in vitro SDUV experiments in a section of porcine muscle.
The porcine tissue was embedded in a gelatin block made with 300 Bloom gelatin (Sigma-Aldrich, St. Louis, MO) with a concentration of 10% by volume and glycerol (Sigma-Aldrich) with a concentration of 10% by volume. Ultrasound radiation force was produced using tonebursts of 3.0 MHz ultrasound with lengths of Tb = 200 and 400 μs repeated at a rate of 100 Hz.
The pressure was measured by a needle hydrophone with 0.2-mm diameter active area (HNP-0200, Onda Corporation, Sunnyvale, CA) with a preamplifier (AH-2010, Onda Corporation) in water. The spatial peak pulse average intensity, after derating by 0.3 dB/cm/MHz for 2 cm of tissue (Isppa,0.3), of the tonebursts with lengths of Tb = 200 and 400 μs were 52.2 and 32.8 W/cm2, respectively, and the spatial peak time average intensity (Ispta,0.3) of the SDUV sequence with lengths of Tb = 200 and 400 μs were 1.045 and 1.310 W/cm2, respectively. These values are above the Food and Drug Administration (FDA) regulatory limit of 720 mW/cm2 [23]. The values for the 2 different toneburst lengths of Isppa,0.3 are different because of some power drop in our amplifier that is observed more for the longer toneburst. The mechanical index (MI) for this experiment was 1.06 and 0.99 for tonebursts with length 200 and 400 μs, respectively.
The repetition of these tonebursts produces a multifrequency radiation force with components at harmonics of this repetition frequency. Tissue motion is measured using pulse-echo ultrasound at 7.5 MHz (ECHO Ultrasound, Lewistown, PA). Both transducers were co-focused before the experiment. The excitation transducer was moved to change Δr while the pulse-echo motion detection transducer remained fixed. For each measurement position, 5 measurements were made to make the results more robust, and the mean value of those 5 measurements was used for further analysis. A diagram of the experimental setup is shown in Fig. 2. The echo data were processed with methods described by Hasegawa and Kanai [20] and Zheng et al. [21]. Values of μ1 and μ2 were calculated from measured shear wave propagation velocity in the muscle tissue both along and across the muscle fibers.
Fig. 2.
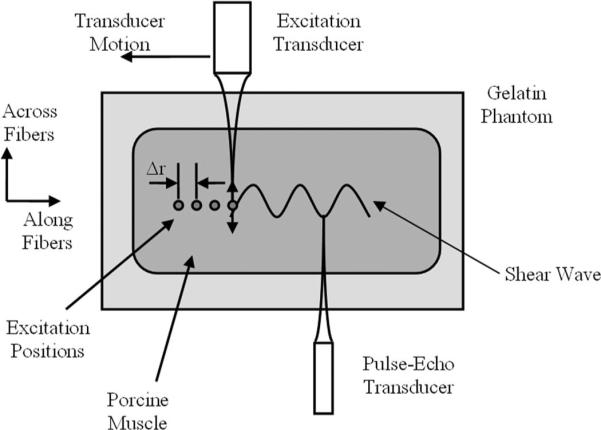
diagram of the experiment on porcine muscle embedded in a gelatin phantom. The excitation transducer produces radiation force. This transducer is moved during the experiment to increase Δr both along and across the muscle fibers. The muscle fiber orientations are shown above. The pulse-echo transducer was fixed and measured the motion due to the propagating shear wave.
IV. Results
A. Simulation Results
Fig. 3 shows images of the shear wave velocity and attenuation for varying values of μ1 and μ2 for f = 100, 300, and 500 Hz evaluated using (2) and (3). This and the following figures will have the values of μ1 on the x-axis and μ2 on the y-axis. It should be noted that all panels have different scales. Shear wave velocity and attenuation both increase with increased frequency. The shear wave attenuation has a very high peak for shear viscosity just greater than 0 Pa·s and very low values of shear elasticity. The shear viscosity of water and other liquids, which do not support shear stresses, is about 0.001 Pa·s [24]. Therefore, the closer the value of μ2 comes to the value for liquids, the higher the attenuation or resistance to allow propagation of shear waves becomes. For the idealized case of μ2 = 0 Pa·s, the shear wave attenuation is identically zero in the Voigt model, i.e., a purely elastic medium. This is a limitation of the Voigt model since a purely elastic medium does not exist in nature. However, this exercise does demonstrate what would happen if a purely elastic medium is assumed.
Fig. 3.

shear wave velocity, cs, and attenuation, αs, properties for varying values of μ1 and μ2 and vibration frequency. (a) cs, 100 Hz, (b) cs, 300 Hz, (c) cs, 500 Hz, (d) αs, 100 Hz, (e) αs, 300 Hz, (f) αs, 500 Hz. note that the scales are different for each panel.
Fig. 4 shows the errors in μ1 and μ2 for values of D0 = 0.5, 1.0, and 2.0 μm. The scale for each panel showing μ1 and μ2 errors is the same for Figs. 4-7. Values outside of these ranges were clipped such that values above the range are bright white and values below these ranges appear dark black. This was done to maximize the dynamic range of the data for comparison between variations of different parameters. As D0 increases, the estimation errors decrease. Fig. 5 shows the errors in μ1 and μ2 for values of Δr = 3, 4, and 5 mm. Errors are highest when Δr = 3 mm and decrease as Δr increases. The errors in μ1 and μ2 for varying echo SNR to values of SNR = 25, 35, and 45 dB are shown in Fig. 6. The errors decrease as SNR increases. Fig. 7 shows the results for varying fm = 300, 400, and 500 Hz. Using higher values of fm yields results with lower errors, particularly for μ2 because μ2 is closely coupled to the frequency terms. Overestimation errors for μ1 and μ2 are consistently highest for materials with low μ1 and high μ2. Underestimation of μ2 occurs for materials with high μ1 and low but nonzero values of μ2.
Fig. 4.

Errors in μ1 and μ2 while varying D0. (a) μ1, D0 = 0.5 μm; (b) μ1, D0 = 1.0 μm; (c) μ1, D0 = 2.0 μm; (d) μ2, D0 = 0.5 μm; (e) μ2, D0 = 1.0 μm; (f) μ2, D0 = 2.0 μm.
Fig. 7.

Errors in μ1 and μ2 while varying fm. (a) μ1, fm = 300 Hz; (b) μ1, fm = 400 Hz; (c) μ1, fm = 500 Hz; (d) μ2, fm = 300 Hz; (e) μ2, fm = 400 Hz; (f) μ2, fm = 500 Hz.
Fig. 5.

Errors in μ1 and μ2 while varying Δr. (a) μ1, Δr = 3 mm: (b) μ1, Δr = 4 mm: (c) μ1, Δr = 5 mm: (d) μ2, Δr = 3 mm: (e) μ2, Δr = 4 mm: (f) μ2, Δr = 5 mm.
Fig. 6.

Errors in μ1 and μ2 while varying SNR. (a) μ1, SNR = 25 dB; (b) μ1, SNR = 35 dB; (c) μ1, SNR = 45 dB; (d) μ2, SNR = 25 dB; (e) μ2, SNR = 35 dB; (f) μ2, SNR = 45 dB.
B. Experimental Results
At each measurement position, 5 measurements were made and the mean of the phase of the 5 measurements was used for calculating shear wave velocity. Although the true values of μ1 and μ2 are unknown in the muscle tissue, a consistency or convergence in the values for differing parameters is evidence that the estimates exhibit good precision. Fig. 8 shows the results for measurements of μ1 and μ2 along the muscle fibers while varying the excitation toneburst length to values of Tb = 200 and 400 μs, Δr = 2 to 6 mm, and fm = 200 to 700 Hz. By doubling the toneburst length, the radiation force and the resulting motion is doubled, so this serves as a comparison of different values of D0. The values of μ1 are consistently about 11 kPa for Δr = 3 to 5 mm and fm = 300 to 600 Hz. The values of μ2 are consistently about 4 Pa·s for Δr = 3 to 6 mm and fm = 300 to 600 Hz.
Fig. 8.

Measurements along muscle fibers of μ1 and μ2 for variation of excitation toneburst length, Δr, and fm. (a) μ1 results for Tb = 200 μs, (b) μ1 results for Tb = 400 μs, (c) μ2 results for Tb = 200 μs, (d) μ2 results for Tb = 400 μs.
Fig. 9 shows results for measurements of μ1 and μ2 across the muscle fibers while varying the excitation toneburst length to values of Tb = 200 and 400 μs, Δr = 1 to 4 mm, and fm = 200 to 700 Hz. The values of μ1 are consistently about 5 kPa for Δr = 1 to 4 mm and fm = 400 to 600 Hz. The values of μ2 are consistently about 2 Pa·s for Δr = 1 to 4 mm and fm = 400 to 600 Hz.
Fig. 9.

Measurements across muscle fibers of μ1 and μ2 for variation of excitation toneburst length, Δr, and fm. (a) μ1 results for Tb = 200 μs, (b) μ1 results for Tb = 400 μs, (c) μ2 results for Tb = 200 μs, (d) μ2 results for Tb = 400 μs.
To evaluate the precision of this method, we used the data for measurements made along and across the fibers with the following parameters Tb = 200 and 400 μs, Δr = 4 mm, and fm = 500 Hz. The shear wave velocity estimates from the 5 measurements with mean and standard deviation are shown in Table I. For each set of shear wave velocity estimates, μ1 and μ2 were estimated and the mean and standard deviation are summarized in Table II.
TABLE I.
Experimental Shear Wave Velocity Estimates for Five Repeated Measurements.*
| Along fibers |
Across fibers |
|||
|---|---|---|---|---|
| Frequency (Hz) | Tb = 200 μs | Tb = 400 μs | Tb = 200 μs | Tb = 400 μs |
| 100 | 3.48 ± 0.09 | 3.47 ± 0.04 | 2.18 ± 0.02 | 2.16 ± 0.01 |
| 200 | 3.63 ± 0.04 | 3.67 ± 0.01 | 2.36 ± 0.03 | 2.38 ± 0.02 |
| 300 | 3.83 ± 0.06 | 3.84 ± 0.02 | 2.54 ± 0.04 | 2.61 ± 0.01 |
| 400 | 4.16 ± 0.04 | 4.06 ± 0.03 | 2.62 ± 0.04 | 2.74 ± 0.03 |
| 500 | 4.26 ± 0.09 | 4.03 ± 0.02 | 2.59 ± 0.07 | 2.76 ± 0.04 |
Mean ± STD.
TABLE II.
Experimental Viscoelastic Property Estimates for Five Repeated Measurements.*
| Along fibers |
Across fibers |
|||
|---|---|---|---|---|
| Tb (μs) | μ1 (kPa) | μ2 (Pa·s) | μ1 (kPa) | μ2 (Pa·s) |
| 200 | 11.98 ± 0.43 | 3.51 ± 0.21 | 5.11 ± 0.11 | 1.26 ± 0.11 |
| 400 | 12.50 ± 0.17 | 2.92 ± 0.09 | 4.99 ± 0.06 | 1.57 ± 0.05 |
Mean ± STD.
V. DISCUSSION
The model showed that errors in the material property estimates were minimized by maximizing shear wave amplitude, pulse-echo SNR, Δr, and the frequency range used. However, it is expected that the values of Δr and the frequency range used would be limited as the displacement would fall to a level where the bias and jitter of the phase becomes too large and the errors actually increase. This phenomenon was demonstrated in the experimental results. The experimental model showed optimum performance could be obtained for Δr = 3 to 6 mm, with a frequency range of 100 to 600 Hz, an experimental SNR of about 38 dB, and shear wave amplitude on the order of a micron or less. This optimum performance was for this particular experimental model, and those optimal parameters will vary depending on the medium being investigated. Given a range of expected values μ1 and μ2, this simulation model could be used as a guide to determine the optimal parameters. This would have to be confirmed by experimentation. The default values of the simulations were based on these ranges for the model input parameters to provide a basis for comparison. The frequency range and value of Δr were limited because attenuation reduced the motion amplitude to a point that accurate measurements could not be made. due to this limited spatial extent, the material property estimate is localized within a few millimeters and should be largely unaffected by boundary conditions. The values of the viscoelastic properties exhibited about a 2:1 ratio when comparing the properties along and across the muscle fibers. This type of relationship has also been reported in other studies [18], [25].
We can relate the simulation results to physical relationships. as D0 increases, the motion estimation is prone to less error, particularly phase errors which are directly related to measurement of the shear wave velocity. When Δr and ω increase, Δϕ will increase, and this is important because the shear wave velocity error is inversely proportional to the (Δϕ)2, as was demonstrated in (9). With reduced phase velocity error, the material property estimates will improve.
The variation in the shear wave velocity estimates at a given frequency, shown in Table I, is very small as is the variation in the material property estimates, evident in Table II. It was observed that a higher value of Tb yielded lower variation, probably because the displacement amplitude was higher. This is in agreement with the simulation results where increases in D0 led to lower levels of error.
The experimental results showed 2 distinct combinations of μ1 and μ2 in the relatively wide range of combinations for μ1 and μ2 studied through the computational model. Given the experimental estimates of μ1 and μ2 and the other experimental parameters such as D0, SNR, Δr, and fm, the computational model predicts the μ1 error ranging between 1.22 and 2.46 kPa and between 0.24 and 0.75 kPa for measurements along and across the muscle fibers, respectively, and the μ2 error ranging between −0.02 and −1.42 Pa·s and between −0.04 and −0.21 Pa·s for measurements along and across the muscle fibers, respectively. These ranges are larger than the variation in the measurements shown in Table II.
Assuming that convergence of the material property values is a way to assess the true value in the experiment, we can evaluate how different parameters determine the precision of the measurements. divergence from the previously stated average values occurs at the lower values of Δr and fm, which agrees with the simulation model. However, it was also shown that divergence occurs at the higher values of Δr and fm evaluated, which is probably due more to effects from attenuation of the shear waves and from increasing phase errors.
The material property errors in the simulations were largest for 3 different combinations of μ1 and μ2, low μ1 and high μ2, high μ1 and high μ2, and high μ1 and low μ2. These errors can be understood by considering how errors in shear wave velocity would bias the estimates of the material properties. When μ1 is low and μ2 is high, the terms with μ2 dominate the determination of cs(ω), and estimation of μ1 and μ2 is very sensitive to bias and slope changes in cs(ω) values. When μ1 is high and μ2 is high, the values of cs(ω) at low frequencies are very similar so accurate estimation of μ1 and μ2 becomes more prone to errors. Underestimation of μ2 occurs when μ1 is high and μ2 is low. In this case, μ1 has a large role in determining cs(ω) and the dispersion may appear less than it truly is, and the estimates are lower than the true value of μ2.
This study was based on using the Voigt model for estimating μ1 and μ2. Chen et al. showed that for similar bovine tissue, the Voigt model captures the dispersion of the shear wave velocity very well for the frequency range examined in this study [18]. The medium and data should dictate which model should be used, as the Voigt model may not be appropriate for all types of tissue or organs. In this case, the model presented in this paper should still be valid except for the use of (2) and (3), which are specific to the Voigt model. different equations could be substituted that fit the problem but the overall analysis for errors in wave velocity measurements should hold.
To assess the true rheology of a medium, the shear wave velocity and attenuation dispersion should be characterized. Therefore, error may arise from estimating the material properties from one parameter, in this case, the shear wave velocity, especially if the rheological model used is not correct. To improve robustness of material property estimates, the shear wave attenuation dispersion could also be utilized. However, displacement amplitude detection is typically prone to more error than phase measurement [19], so shear wave velocity has been used more frequently.
The model is also based on assuming that the error term ϕe,1 and ϕe,2 parameters are normally distributed. This was chosen primarily to make the mathematical modeling analytically easier, but it did seem to provide the best fit to simulated data when different distributions were compared. The phase errors are specific for the excitation and motion tracking point-spread functions used, so applications using different transducers could be modeled using the theory presented in [19]. Depending on experimental data for different applications, the distribution used for these error terms could be changed and the model could be reformulated based on these changes.
When SDUV experiments are performed, the displacement amplitude at the excitation point for all frequency components is assumed to be equal. The radiation force excitation has a frequency-domain envelope defined by a sinc function. For tonebursts of length 200 and 400 μs and a toneburst repetition rate of 100 Hz, the magnitude of the force components from 100 to 700 Hz vary by 3.2% and 12.2%, respectively. Typically, the first motion measurement is made about 2 mm from the excitation point to avoid interference from the toneburst used for radiation force, so the displacement amplitude of components at different frequencies could decay to values that are slightly different from each other based on the values of μ1 and μ2 and the attenuation at different frequencies. For the results presented in this study, the amplitudes were considered equal, but compensation techniques for this phenomenon may need to be explored in future work, either by working out a method to get reliable measurements at the excitation point or by compensating for attenuation that may occur in a short propagation distance.
Diffraction of the shear waves from the radiation force is also neglected in this study and may be a source of error. diffraction will affect the lower frequency measurements of shear wave velocity. The use of a wide bandwidth of the shear wave velocity for material property estimation assists in reducing the effects of the error due to diffraction.
This model neglected any errors associated with errors in Δr. phase aberration and focusing errors could create errors in the position that motion measurements are performed. However, depending on the frequency of the shear wave and its velocity, the variation in the phase measurement associated with Δr errors may be small and have a minimal effect on material property estimation. In the experiment, a stepping motor system was used that has a resolution of 2.5 μm so positioning of the motion detection transducer should be very precise.
The Ispta,0.3 used in this experiment is greater than the Fda regulatory limit of 720 mW/cm2 [23]. The values reported here were measured in water and derated for the tissue encountered. To reduce the intensity, the voltage levels, toneburst length, or repetition frequency of the pushing toneburst could be decreased to yield intensity values that would be within the regulatory limit.
The advantage the model offers is a way to optimize experimental parameters to achieve reduction in SDUV measurement errors for clinically relevant values of μ1 and μ2. The simulation model has been validated and can be used to provide benchmarks for application design for clinical tests. Given a set of acceptable limits on the error specifications and expected values of μ1 and μ2 for a clinical application, the appropriate input parameters including D0, SNR, Δr, and fm that meet that set of specifications could be selected. This includes using different parameters to offset limitations that may be present. For example, if the tissue under investigation is expected to be quite stiff, having large values for μ1, the value of achievable D0 may be low but if system SNR can be increased, this may provide suitable compensation to achieve a reasonable error level. Future work could be devoted to determining the independence of input parameters that would assist in the optimization of appropriate combinations of the parameters to yield a specified error level.
VI. CONCLUSIONS
We present a computational model and experimental approach to analyze errors in measurements of shear wave velocity and material properties using SDUV. The model provides a basis to explore different error sensitivities of parameters related to implementation of the SDUV method. The experiment in porcine muscle confirmed conclusions made by the model, providing confidence in using the simulation model as a platform for optimization for future applications of SDUV.
ACKNOWLEDGEMENTS
The authors thank Randall R. Kinnick for experimental assistance, Dr. Yi Zheng for MATLAB code for the Kalman filter, and Jennifer Milliken for administrative assistance. Drs. Urban, Chen, and Greenleaf have financial interest in some of the methods described.
This study was supported in part by grants EB002640 and EB002167 from the National Institutes of Health.
Biographies

Matthew W. Urban (s'02-M'07) was born in sioux Falls, sd, on February 25, 1980. He received the B.s. degree in electrical engineering at south dakota state University, Brookings, sd, in 2002 and the ph.d. degree in biomedical engineering at the Mayo clinic college of Medicine, rochester, Mn, in 2007. He is currently a research fellow in the department of Biomedical Engineering, Mayo clinic college of Medicine.
He has been a summer undergraduate fellow at the Mayo clinic Biomechanics laboratory. His current research interests are ultrasonic signal and image processing, vibro-acoustography, and vibrometry applications.
Dr. Urban is a member of Eta Kappa nu, Tau Beta pi, and the acoustical society of america.

Shigao Chen (M'02) received the B.s. and M.s. degrees in biomedical engineering from Tsinghua University, china, in 1995 and 1997, respectively, and the ph.d. degree in biomedical imaging from the Mayo Graduate school, rochester, Mn, in 2002. He is currently an assistant professor, Mayo Graduate school, and a research associate, department of Biomedical Engineering, Mayo clinic college of Medicine. His research interest is noninvasive quantification of viscoelastic properties of soft tissue using ultrasound.

James F. Greenleaf (M'73-sM'84-F'88) was born in salt lake city, UT, on February 10, 1942. He received the B.s. degree in electrical engineering from the University of Utah, salt lake city, in 1964, the M.s. degree in engineering science from purdue University, lafayette, In, in 1968, and the ph.d. degree in engineering science from the Mayo Graduate school of Medicine, rochester, Mn, and purdue University in 1970. He is currently professor of Biophysics and associate professor of Medicine, Mayo Medical school, and consultant, department of physiology, Biophysics, and cardiovascular disease and Medicine, Mayo Foundation.
He has served on the IEEE Technical committee for the Ultrasonics symposium for five years. He served on the IEEE Ultrasonics, Ferroelectrics, and Frequency control society (UFFc-s) subcommittee on Ultrasonics in Medicine/IEEE Measurement Guide Editors, and on the IEEE Medical Ultrasound committee. doctor Greenleaf was president of the UFFc-s in 1992 and 1993 and is currently Vice president for Ultrasonics.
Dr. Greenleaf has 12 patents and is a recipient of the 1986 J. Holmes pioneer award and the 1998 William J. Fry Memorial lecture award from the american Institute of Ultrasound in Medicine, and is a Fellow of IEEE, american Institute of Ultrasound in Medicine, and american Institute for Medical and Biological Engineering. dr. Greenleaf was the distinguished lecturer for IEEE Ultrasonics, Ferroelectrics, and Frequency control society (1990/1991). His special field of interest is ultrasonic biomedical science, and he has published more than 327 articles and edited or authored five books in the field.
REFERENCES
- [1].Sinkus R, Tanter M, Xydeas T, Catheline S, Bercoff J, Fink M. Viscoelastic shear properties of in vivo breast lesions measured by Mr elastography. Magn. Reson. Imaging. 2005 Feb.23:159–165. doi: 10.1016/j.mri.2004.11.060. [DOI] [PubMed] [Google Scholar]
- [2].Rouviere O, Yin M, Dresner MA, Rossman PJ, Burgart LJ, Fidler JL, Ehman RL. MR elastography of the liver: preliminary results. Radiology. 2006 Aug.240:440–448. doi: 10.1148/radiol.2402050606. [DOI] [PubMed] [Google Scholar]
- [3].Huwart L, Peeters F, Sinkus R, Annet L, Salameh N, ter Beek LC, Horsmans Y, Van Beers BE. Liver fibrosis: noninvasive assessment with Mr elastography. NMR Biomed. 2006 Apr.19:173–179. doi: 10.1002/nbm.1030. [DOI] [PubMed] [Google Scholar]
- [4].Muthupillai R, Lomas DJ, Rossman PJ, Greenleaf JF, Manduca A, Ehman RL. Magnetic resonance elastography by direct visualization of propagating acoustic strain waves. Science. 1995 Sep. 29269:1854–1857. doi: 10.1126/science.7569924. [DOI] [PubMed] [Google Scholar]
- [5].Yamakoshi Y, Sato J, Sato T. Ultrasonic imaging of internal vibration of soft tissue under forced vibration. IEEE Trans. Ultrason. Ferroelectr. Freq. Control. 1990;37:45–53. doi: 10.1109/58.46969. [DOI] [PubMed] [Google Scholar]
- [6].Dutt V, Kinnick RR, Muthupillai R, Oliphant TE, Ehman RL, Greenleaf JF. Acoustic shear-wave imaging using echo ultrasound compared to magnetic resonance elastography. Ultra-sound Med. Biol. 2000 Mar.26:397–403. doi: 10.1016/s0301-5629(99)00166-0. [DOI] [PubMed] [Google Scholar]
- [7].Catheline S, Wu F, Fink M. A solution to diffraction biases in sonoelasticity: The acoustic impulse technique. J. Acoust. Soc. Am. 1999 May;105:2941–2950. doi: 10.1121/1.426907. [DOI] [PubMed] [Google Scholar]
- [8].Sarvazyan AP, Rudenko OV, Swanson SD, Fowlkes JB, Emelianov SY. Shear wave elasticity imaging: A new ultrasonic technology of medical diagnostics. Ultrasound Med. Biol. 1998 Nov.24:1419–1435. doi: 10.1016/s0301-5629(98)00110-0. [DOI] [PubMed] [Google Scholar]
- [9].Nightingale K, Mcaleavey S, Trahey G. Shear-wave generation using acoustic radiation force: In vivo and ex vivo results. Ultrasound Med. Biol. 2003 Dec.29:1715–1723. doi: 10.1016/j.ultrasmedbio.2003.08.008. [DOI] [PubMed] [Google Scholar]
- [10].Bercoff J, Tanter M, Fink M. Supersonic shear imaging: a new technique for soft tissue elasticity mapping. IEEE Trans. Ultrason. Ferroelectr. Freq. Control. 2004 Apr.51:396–409. doi: 10.1109/tuffc.2004.1295425. [DOI] [PubMed] [Google Scholar]
- [11].Wu Z, Hoyt K, Rubens DJ, Parker KJ. Sonoelastographic imaging of interference patterns for estimation of shear velocity distribution in biomaterials. J. Acoust. Soc. Am. 2006 Jul.120:535–545. doi: 10.1121/1.2203594. [DOI] [PubMed] [Google Scholar]
- [12].Tanter M, Bercoff J, Athanasiou A, Deffieux T, Gennisson JL, Montaldo G, Muller M, Tardivon A, Fink M. Quantitative assessment of breast lesion viscoelasticity: Initial clinical results using supersonic shear imaging. Ultrasound Med. Biol. 2008 Sep.34:1373–1386. doi: 10.1016/j.ultrasmedbio.2008.02.002. [DOI] [PubMed] [Google Scholar]
- [13].Bercoff J, Tanter M, Muller M, Fink M. The role of viscosity in the impulse diffraction field of elastic waves induced by the acoustic radiation force. IEEE Trans. Ultrason. Ferroelectr. Freq. Control. 2004 Nov.51:1523–1536. doi: 10.1109/tuffc.2004.1367494. [DOI] [PubMed] [Google Scholar]
- [14].Catheline S, Gennisson JL, Delon G, Fink M, Sinkus R, Abouelkaram S, Culioli J. Measurement of viscoelastic properties of homogeneous soft solid using transient elastography: An inverse problem approach. J. Acoust. Soc. Am. 2004 Dec.116:3734–3741. doi: 10.1121/1.1815075. [DOI] [PubMed] [Google Scholar]
- [15].Hoyt K, Kneezel T, Castaneda B, Parker KJ. Quantitative sonoelastography for the in vivo assessment of skeletal muscle viscoelasticity. Phys. Med. Biol. 2008 Aug.53:4063–4080. doi: 10.1088/0031-9155/53/15/004. [DOI] [PMC free article] [PubMed] [Google Scholar]
- [16].Gennisson JL, Lerouge S, Cloutier G. Assessment by transient elastography of the viscoelastic properties of blood during clotting. Ultrasound Med. Biol. 2006 Oct.32:1529–1537. doi: 10.1016/j.ultrasmedbio.2006.06.008. [DOI] [PubMed] [Google Scholar]
- [17].Chen S, Fatemi M, Greenleaf JF. Quantifying elasticity and viscosity from measurement of shear wave speed dispersion. J. Acoust. Soc. Am. 2004 Jun.115:2781–2785. doi: 10.1121/1.1739480. [DOI] [PubMed] [Google Scholar]
- [18].Chen S, Urban MW, Pislaru C, Kinnick RR, Green-leaf JF. Shearwave dispersion ultrasound vibrometry for measuring tissue elasticity and viscosity. IEEE Trans. Ultrason. Ferroelectr. Freq. Control. 2009 Jan.56:55–62. doi: 10.1109/TUFFC.2009.1005. [DOI] [PMC free article] [PubMed] [Google Scholar]
- [19].Urban MW, Chen S, Greenleaf JF. Harmonic motion detection in a vibrating scattering medium. IEEE Trans. Ultrason. Ferroelectr. Freq. Control. 2008;55:1956–1974. doi: 10.1109/TUFFC.887. [DOI] [PMC free article] [PubMed] [Google Scholar]
- [20].Hasegawa H, Kanai H. Improving accuracy in estimation of artery-wall displacement by referring to center frequency of rF echo. IEEE Trans. Ultrason. Ferroelectr. Freq. Control. 2006 Jan.53:52–63. doi: 10.1109/tuffc.2006.1588391. [DOI] [PubMed] [Google Scholar]
- [21].Zheng Y, Chen S, Tan W, Kinnick R, Greenleaf JF. Detection of tissue harmonic motion induced by ultrasonic radiation force using pulse-echo ultrasound and Kalman filter. IEEE Trans. Ultrason. Ferroelectr. Freq. Control. 2007 Feb.54:290–300. doi: 10.1109/tuffc.2007.243. [DOI] [PubMed] [Google Scholar]
- [22].Ringleb SI, Bensamoun SF, Chen QS, Manduca A, An KN, Ehman RL. Applications of magnetic resonance elastography to healthy and pathologic skeletal muscle. J. Magn. Reson. Imaging. 2007 Feb.25:301–309. doi: 10.1002/jmri.20817. [DOI] [PubMed] [Google Scholar]
- [23].U.s. Food and drug administration . Information for Manufacturers seeking Marketing clearance of diagnostic Ultrasound systems and Transducers. U. s. dept. of Health and Human services, Food and drug administration, center for radiological devices; rockville, Md: Sep. 30, 1997. [Google Scholar]
- [24].Lide DR. CRC Handbook of Chemistry and Physics. 72nd ed. CRC Press; Boca Raton, FL: 1991. [Google Scholar]
- [25].Gennisson JL, Catheline S, Chaffai S, Fink M. Transient elastography in anisotropic medium: application to the measurement of slow and fast shear wave speeds in muscles. J. Acoust. Soc. Am. 2003 Jul.114:536–541. doi: 10.1121/1.1579008. [DOI] [PubMed] [Google Scholar]