

Abstract
Caenorhabditis elegans is one of the most prominent model systems for embryogenesis. However, it has been impractical to collect large amounts of precisely staged embryos. Thus, early C. elegans embryogenesis has not been amenable to most modern high-throughput genomics or biochemistry assays. To overcome this problem, we devised a method to collect large amounts of staged C. elegans embryos by Fluorescent Activated Cell Sorting (termed eFACS). eFACS can in principle be applied to all embryonic stages. As a proof of principle we show that a single eFACS run routinely yields tens of thousands of almost perfectly staged one-cell embryos. Since the earliest embryonic events are driven by post-transcriptional regulation, we combined eFACS with next-generation sequencing to profile the embryonic expression of small, non-coding RNAs. We discovered complex and orchestrated changes in the expression between and within almost all classes of small RNAs, including miRNAs and 26G-RNAs, during embryogenesis.
Introduction
The nematode Caenorhabditis elegans is one of the best-explored model organisms for developmental biology. The mechanistic basis of embryogenesis in C. elegans has been dissected by describing the entire cell lineage1 and by numerous molecular and genetic analyses. Various key proteins involved in early cell division as well as hundreds of essential genes required for early embryogenesis and their knock-down phenotypes have been described2-8. However, a true understanding of embryogenesis will require the knowledge of stage-specific gene expression. Modern high-throughput technologies such as deep sequencing, proteomics and their many applications can be used, for example, to identify and quantify the transcriptome, protein levels, and protein-protein interactions on a genome-wide scale. Prerequisite to study the progression of embryogenesis with many of these methods is large amounts of precisely staged embryos to yield enough RNA or other material. However, this is currently not possible. Isolated embryos represent mixtures of developmental stages, ranging from the early one-cell zygote to the almost hatching larvae with approximately 600 cells. To date staged embryos are usually obtained by hand using a mouth pipette, making it impractical to apply large-scale techniques that typically require tens of thousands of embryos. While methods to collect cells from dissociated embryos exist9, there is currently no method to collect specific embryonic stages in large quantities. Methods have been described to obtain large numbers of semi-synchronized embryos by blocking their development with fluorodeoxyuridine10, or to obtain young embryos from hermaphrodites that have just begun to produce mature oocytes11. Although these methods can yield reasonable quantities of young embryos, the collected embryos are not synchronous and these approaches cannot be used to select specific developmental stages.
Here we describe a method to collect large amounts of staged embryos by Fluorescent Activated Cell Sorting (eFACS). eFACS can be applied to any embryonic stage in which a specific fluorescent marker protein can be stably expressed and allows the resolution of embryonic stages with sufficient yield for high throughput technology that requires large amounts of starting material.
In C. elegans embryos, some specific zygotic transcription of protein coding genes is initiated at the 4-cell stage, although pharmacological and genetic experiments have suggested that zygotic genes are not required until later in embryogenesis12,13. Maternal components seem sufficient to direct the embryo through the initial cleavage rounds up to approximately the onset of gastrulation. Interference with key enzymes involved in the RNAi pathway lead to numerous defects including embryonic lethality, suggesting functional roles for non-coding RNAs in embryogenesis14-16. It is unknown which small RNA populations (miRNAs, 21U-RNAs, endogenous siRNAs, 26G-RNAs) are present in the early embryo and it is unclear how the complexity and composition of the transcriptome changes within the very first cell cycles17-20. We thus set out to use eFACS in combination with deep sequencing to profile small RNA expression during early embryogenesis.
Results
eFACS yields large samples of one-cell staged embryos
The strain used for our eFACS experiments expresses an OMA-1::GFP fusion protein under control of the oma-1 promoter21. The OMA-1::GFP fluorescence is detected in developing oocytes and the one-cell stage embryo. The GFP signal rapidly decreases in the two-cell embryo and is too weak to be detected in the embryo after the 4-cell stage21. These characteristics make the strain useful for selecting one-cell stage embryos by fluorescence.
After passing the embryos through a FACS we observed a GFP positive (fluorescent) population that was distinct from background. Around 3-7% of embryos within the sample have high GFP fluorescence (Fig. 1a). Specifically sorting this population yields a sample of ∼70% one-cell stage embryos contaminated with older embryos (Fig. 1b,d). We investigated if we could sort twice (hereafter referred to as resorting) to obtain an even higher enrichment in one-cell embryos. The first embryonic cleavages progress rapidly and allow a time window of only 40 minutes for sorting living embryos1. After this time a mixed embryo population is depleted from one-cell stage embryos. Even with extensive cooling to delay cell division we were unable to resort to achieve further enrichment (see Discussion). However, methanol fixation of embryos solved this problem and allowed further enrichment of the desired population (Fig. 1b). This procedure yielded routinely ∼60,000 embryos as a practically pure one-cell stage sample (>98%) (Fig. 1c,e). Most of those resorted one-cell embryos resided in the pronuclear migration and pseudocleavage part of the first cell cycle (Fig. 1c,e). Selecting a less GFP fluorescent population (Supplementary Fig. 1a) and resorting (Supplementary Fig. 1b) yielded a mixture of two-to-four-cell embryos with some contamination (15% one-cell, 5% eight-cell, < 2% older stages) (Supplementary Fig. 1e).
Figure 1.
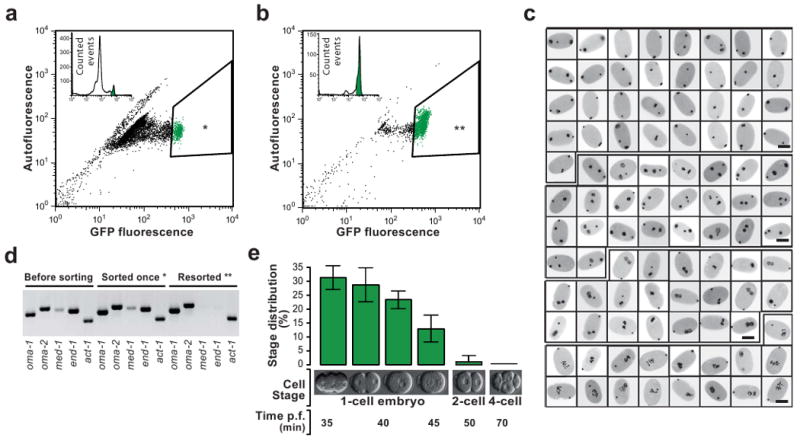
eFACS yields tens of thousands of cleanly staged one-cell embryos with at least 98% purity.
(a) A mixed population of embryos from the OMA-1::GFP strain is passed through a Fluorescent Activated Cell Sorter (FACS). Shown is the GFP fluorescent signal vs autofluorescence. One-cell embryos with a high GFP signal (3-5% of the initial population) are selected (*). 10,000 embryos are depicted in the scatter plot. (b) The first sort enriches the one-cell stage embryo population to ∼70%. 2,000 embryos are depicted in the scatter plot. Sorting once more (resorting) the same population (**) yields one-cell embryos at a purity of >98% (see below). (c) Developmental stage analysis of resorted embryos of a randomly selected sample (96 embryos). DAPI stained pronuclei appear black. All embryos are one-cell stage. Scale bars, 25μm. (d) RT-PCR analysis of once-sorted (*), Resorted embryos (**), and a mixed embryo population prior to sorting. In resorted embryos the one-cell stage specific marker genes oma-1 and oma-2 but not early zygotic (four-to-eight-cell stage) genes med-1 and end-1 are amplified. However, in embryos that were sorted only once, expression of med-1 and end-1 is still detectable. Act-1 was used as RT-PCR control. (e) Summary statistics of microscopic analyses of resorted embryos. The majority of embryos are in the pseudocleavage and chromosome condensation phase (30%) and in the pronuclear migration phase (30%) of the first cell cycle. Two-cell and older embryos represent less than 2% of the resorted embryo population (Error bars, s.d., n = 5, 100 embryos counted per replicate).
Six samples covering different developmental stages
To study composition and dynamics of small RNAs in early embryogenesis we obtained altogether six samples (four by eFACS) of embryos covering various developmental stages (Fig. 2) from which small RNA libraries were generated and deep sequenced (Methods). Using our mapping pipeline (Methods), between 52% and 83% of reads could be mapped to the genome (Fig. 2; further details in Supplementary Table 1).
Figure 2.

Dissecting small RNA expression during embryogenesis.
Summary of the six samples used for small RNA cloning and next-generation sequencing (Illumina). Two different one-cell stage samples were obtained by embryo Fluorescent Activated Cell Sorting (eFACS): (i) The living-sorted one-cell stage embryo sample represents a mixed embryo sample enriched in one-cell stage embryos. (ii) The vast majority of the fixed and twice-sorted (resorted) one-cell stage embryo sample consists of one-cell embryos (>98%) in which embryos are mainly in very early phases of their first cell cycle (Fig. 1). The two-to-four-cell stage sample was obtained by resorting fixed embryos and represents a mixture of one-cell to eight-cell embryos strongly enriched in two-to-four-cell stage embryos (Supplementary Fig. 1). Two older embryo populations were generated by (i) eFACS of GFP negative embryos, which represent a mixed embryo population depleted in early embryos and by (ii) harvesting post gastrulation embryos by allowing isolated embryos to develop for 3 hours at 20°C. Finally, also a mixed embryo population was obtained. The total number of successfully mapped small RNAs in each sample is tabulated to the right.
Comparing fixed and living embryos obtained by eFACS
The methanol fixation of embryos enabled us to sort twice and further enrich embryo populations. To test if methanol fixation altered miRNA expression, we compared expression profiles for 10 miRNAs between fixed and non-fixed embryos by qRT-PCRs (Supplementary Fig. 2). Relative expression of these miRNAs was unaffected by fixation. Further, to test if sorting fixed embryos is comparable to living-sorted embryos we compared sequencing-based estimates of miRNA expression between these samples. We expect some differences between these samples since we know that contrary to the fixed resorted eFACS sample (>98% one-cell embryos), the living, once sorted sample is contaminated by ∼30% mixed embryos.
We found that miRNA expression is overall highly correlated between these samples (Fig. 3a, log expression, Pearson 0.86), although we observed substantial scatter and some miRNAs which were absent in the fixed-sorted sample. We suspected that these miRNAs are expressed only in older embryos and are therefore not detected in the one-cell stage sample. To test this hypothesis, we first directly measured miRNA expression in an independently obtained, living mixed embryo sample by sequencing (‘mixed embryos’ Fig. 2). We then respectively subtracted miRNA expression (quantified by normalized sequencing reads, Methods) of this mixed embryo sample from miRNA expression from both sorted samples. The small remaining set of miRNAs had strongly reduced scatter, correlated almost perfectly between both samples (Fig. 3b, Pearson 0.94), and was more strongly expressed in the fixed sample. Thus, these miRNAs (which contain, among others, all miRNAs from the miR-35 cluster) are likely one-cell embryo specific. Furthermore, miRNA expression fold-changes during embryonic development quantified by eFACS and deep sequencing can accurately reflect in vivo fold-changes. We will present further evidence for this based on qRT-PCR validation below.
Figure 3.

FACS sorting of fixed one-cell embryos can be used to reveal miRNA expression dynamics.
(a) Scatter plot of miRNA expression quantified by normalized sequencing reads in the fixed resorted one-cell stage embryos (>98% purity) versus the live-sorted sample (∼70% one-cell embryos, ∼30% older embryos). The graph reveals a high correlation (Pearson 0.86) but considerable scatter and some miRNAs that seem exclusively expressed in only one of the samples (grey dots). Grey dashed line: main diagonal. (b) miRNA expression of live- and fixed-sorted one-cell stage embryos after in silico subtraction of miRNA expression in mixed embryos correlate almost perfectly (Pearson 0.94). The plot shows all miRNAs with higher expression in the one-cell embryos compared to the mixed embryos. Virtually all of these (linear regression, orange line) reside above the diagonal (grey dashed line) demonstrating the higher enrichment of one-cell specific miRNAs in the fixed-sorted sample. (c) Fold changes of miRNA expression between the one-cell stage embryos to post-gastrulation embryos as quantified by deep sequencing is shown in a double-logarithmic scatter plot. Orange line: linear regression. Dotted lines: 2 fold change. (d) qRT-PCRs for selected miRNAs (marked in red in (c)) were performed to assay miRNA fold changes on living, hand-picked embryos. Fold changes obtained by sequencing are plotted versus fold changes obtained by qRT-PCRs (Pearson 0.85). Coordinated expression fold changes are observed within the miRNA clusters miR-35 and miRNA-42 (Supplementary Fig. 3). Error bars s.d. (n=3).
Dynamics of miRNA expression in early development
Perhaps surprisingly, eFACS revealed that ∼60% of all known miRNAs are already expressed in the one-cell embryo (Fig. 3a and Supplementary Table 5). We selected 16 miRNAs, with read counts covering three orders of magnitude, for independent validation by qRT-PCR (Fig 3c, marked in red) on hand-picked, living one-cell embryos and confirmed the expression of all of them (Supplementary Table 8). We then computed fold-changes of miRNA expression from sequencing data between one-cell embryos and our post-gastrulation sample according to a logistic model (Methods). These fold-changes were also directly assayed by qRT-PCRs for the 16 miRNAs on independently hand picked, living embryos from corresponding developmental stages. Fold-changes determined by sequencing and qRT-PCR were found to be in good correlation (Fig. 3d, Pearson 0.85). However, there are marked differences for some miRNAs (see discussion). We next examined expression changes of all miRNAs between one-cell, two-to-four-cell, and post-gastrulation samples. The least amount of change was visible across the first cell divisions (one-cell stage to two-to-four-cell stage). However, miR-48 seemed to decrease >5-fold from one-cell to two-to-four cell embryos (Supplementary Fig. 4a). The strongest miRNA expression changes were observed upon gastrulation, where several miRNAs were for the first time highly expressed (Supplementary Fig. 4b). Nevertheless, we also observed miRNAs that peaked in expression in the early embryo, including the miR-35 cluster (miR-35-41), the miR-61 cluster (miR-61, miR-250) and miRNA-1829b/c. As noted above, we already observed these miRNAs to be enriched in the one-cell embryo (Fig. 3b). Altogether, we conclude that these miRNAs are markers for very early embryogenesis.
Identification of new miRNAs and 21 U-RNAs
To discover potentially novel miRNAs, we mined our pooled datasets with miRDeep, an algorithm that identifies Dicer hairpin products such as miRNAs in deep sequencing data22. miRDeep reported 19 novel miRNAs (Methods, Supplementary Table 2). 16 were supported by detected star strands. Further, precursors of two novel miRNAs fell exactly between adjacent coding exons, strongly suggesting that they are mirtrons. We observed expression from 7506 of 15341 known 21U-RNA loci (Supplementary Tables 6 and 7). Reads mapping to known 21U-RNA loci derived almost exclusively from the sense strand, had almost always a 5′ Uracil, and their length distribution sharply peaked at 21 nt. We discovered 389 novel 21U-RNAs (Supplementary Table 4). Their genomic distribution followed the published pattern20,23 with additional dispersed genomic loci.
Differential expression across or within small RNA classes
We next compared the expression of all known classes of small RNAs during embryogenesis. However, we note that we most likely only observe small RNAs with a 5′ monophosphate due to the cloning protocol (Methods). Overall, we observed strong, orchestrated changes in the composition of small RNAs between the sequenced samples (Fig. 5 and Supplementary Fig. 2). Older embryos are dominated by miRNAs while in very early stages additional small RNA classes are observed, including mitochondrial tRNA in one-cell and two-to-four-cell embryos as well as a sizable fraction of rRNA. The rRNA and tRNA-derived fractions in all samples have a uniform length distribution and are thus likely degradation products. 21U-RNAs are highly expressed in early embryos but difficult to detect in older embryos. We also observed differential expression of endo-siRNAs and 26G-RNAs (see below).
Figure 5.

Differential expression between and within almost all classes of small RNAs during embryogenesis.
Small RNA length distribution at different developmental stages. The relatively small number of sequencing reads that mapped anti-sense to known transcripts is plotted below the horizontal axis. Many of these reads are most likely endogenous siRNAs (see text). The transcript length profiles for all other reads show distinct characteristic features for the different small RNA classes. tRNAs and rRNAs have uniform length distributions while the length of miRNAs and 21U-RNAs peak around 22 and 21 nucleotides, respectively. ∼60% all known miRNAs are already detected in the one-cell embryo. In the one-cell embryo, reads mapping to rRNAs are highly expressed, drop in expression in the two-to-four-cell embryos, and are virtually absent in older embryos. 21U-RNAs are very abundant in the early embryo. 26G-RNAs were most highly expressed in older embryos. The older embryo samples are dominated by miRNAs, followed by 26G-RNAs and reads of length 26 nt that mapped anti-sense to known mRNAs. The live sorted one-cell stage sample, which is contaminated with older embryos, exhibits features from the early embryo samples (21U-RNA, rRNA) as well as the older embryos (26G-RNA).
Endogenous siRNAs are observed in the one-cell embryo
The length distribution of reads mapping sense or antisense to exons or introns of mRNA transcripts varied distinctly (Fig. 6). Sense reads were distributed uniformly, suggesting that they originated from degraded mRNAs. Reads mapping antisense to exons were dominated by 22 nt and 26 nt reads with a strong bias for a 5′ Uracil or Guanine, respectively (consistent with previous reports17,20). We will refer to the corresponding small RNAs as endogenous siRNAs (endo-siRNAs). Perhaps surprisingly, most one-cell embryo endo-siRNAs mapped to mitochondrial enzymes. The majority of these mRNAs are known to be upregulated in rrf-1, eri-1, rde-3 and dcr-1 mutants, which suggests that they are under control of small RNAs (Supplementary Table 3). We also consistently observed possible degradation products of mitochondrial tRNAs in the early embryo but not in other samples (Fig. 5). Interestingly, we found more endo-siRNA of length ∼22 nt in the one- and two-to-four-cell stage embryos, while endo-siRNAs of length ∼26 nt dominated in the older samples. Additionally, we observed in older embryos a two-fold enrichment of reads mapping antisense to 3′UTRs (27-32%) when compared to one-cell or two-to-four-cell stages (15% 3′UTR reads).
Figure 6.

26G-RNAs are expressed from intergenic clusters
(a) Two genomic clusters of 26G-RNAs on chromosome II and chromosome X. We observed most of the reads from one strand in our embryo samples. Black bars represent the positions of 5′ Guanine nucleotides in the genome. Grey bars and roman numerals indicate the features for which Northern blots were performed. Profiles are normalized to yield identical areas under the sense strand curves. (b) Validation of five (out of five tested) 26G-RNAs by Northern blots with total RNA from mixed embryos. The observed transcript lengths vary slightly between 24-28 nt. Some of the tested probes exhibit a double band in the Northern blots (II, III, IV), while others (I and V) exhibit only a single band. A 21 nt probe for miR-1 was used as a positive control.
Genomic organization and expression of 26G-RNAs
After removing known RNA classes (see Methods), we studied the set of remaining reads. The length distribution of these RNAs peaked at 26 nt. These 26mers did not map to any annotated loci and had a strong 5′ Guanine bias (75.7%). Hereafter, we refer to 26 nt reads with a 5′G as 26G-RNAs24. While lowly present in early embryos, we observed high 26G-RNA expression in older embryos. Computational analyses revealed that 26G-RNAs mapped to several clusters in intergenic regions on different chromosomes (Fig. 6a). We validated five (out of five tested) 26G-RNAs from two clusters (Fig. 6b).
Discussion
Sorting C. elegans embryos expressing a stage specific GFP marker via FACS (eFACS) made it possible to obtain a large staged embryo population. As a proof of principle we used eFACS to obtain large samples of staged one-cell and two-to-four cell embryos. Due to the low abundance of one-cell zygotes in embryos extracted via standard bleaching, resorting is necessary to yield a pure one-cell population. Methanol fixation allows resorting. Our resorted one-cell sample had a purity of >98%. Methanol fixation did not alter miRNA expression (Supplementary Fig. 2) or mRNA expression (data not shown). Nevertheless, we cannot rule out that methanol fixation or sorting does induce some artifacts when using eFACS for other purposes. We observed some differences in miRNA expression fold-changes determined by sequencing and qRT-PCRs in independently assayed embryos (Fig. 3d), including an outstanding discrepancy for miR-58. We believe that this discrepancy can be in part explained by saturation effects in the library preparation for sequencing because miR-58 is by far the most highly expressed miRNA. This problem and biases in sequencing in general may also be responsible for other discrepancies. Moreover, we observed a shift in overall miRNA fold-changes towards increased fold-changes quantified by qRT-PCR. An inherent problem when comparing sequencing and qRT-PCR data is that both methods require normalization. Sequencing data were normalized under the assumption that net fold-changes are close to zero while qRT-PCRs were normalized to an internal standard. While both assumptions have their problems, different normalization procedures only shift the baseline of fold-changes and do not influence the relative fold-changes to each other and thus do not influence any conclusions presented in this study.
In principle, eFACS can be used to extract large samples of embryos enriched in any desired embryonic stage. Thus, eFACS opens the door to many modern high-throughput technologies to assay embryonic stage specific gene expression. Several of such investigations are already ongoing. A limitation of eFACS is that eFACS depends on the availability of a good fluorescent marker gene for the desired embryonic stage. State-of-the-art FACS allows the simultaneous usage of up to eight fluorescence channels. Strains expressing different fluorescent fusion proteins with temporally overlapping changes in gene expression could be combined and thus it should be possible to use eFACS in situations where a single optimal marker gene is not available. Moreover, it was shown that it is possible to engineer the specific degradation of a protein at a specific time and in a specific cell type25.
Alternatively, we have shown that embryos can be sorted alive to obtain staged samples at a purity of ∼70%. However, one technical constraint in eFACS is that the large size of the embryos forced us to sort at very low speeds of ∼400/second. We cooled embryos (15°C) to delay cell divisions but were still unable to resort living embryos. We also experimented with lower temperature settings (4-10°C). However, these settings reduced viability (<60%) after sorting and still resulted in relatively low purity. It is entirely possible that more advanced FACS machines will allow to sort at higher speeds comparable to standard cell sorting (>20,000/second). In this case, one could sort and even resort to obtain samples of the same size and purity as our fixed embryo eFACS runs. Fixation could be omitted and eFACS just with the OMA-1::GFP strain could be used to obtain thousands of staged living embryos that could be allowed to develop synchronously to the embryonic stage of interest. Further improvements to this approach might also be achieved by careful animal staging11 prior to eFACS.
We applied eFACS to profile small RNA expression during embryogenesis. Previous large-scale studies of small RNA expression had to use samples composed of mixed-stage embryos. These studies could not detect the orchestrated and dynamic changes between and within different classes of small RNAs that we observed when comparing the one-cell embryo to later stages. Several examples illustrate this finding. Firstly, it is very interesting that the majority of miRNAs is already expressed in the one-cell embryo, suggesting that they are maternally deposited. This raises the question why so many miRNAs are expressed in the early embryo. Secondly, we showed that miRNAs from the miR-35 cluster are likely early embryo specific. Genetic knockouts and mutations for 95 miRNAs have been published26. Strikingly, the miR-35 cluster is the only known miRNA cluster with an embryonic lethal knockout phenotype. Thirdly, we observed many small RNAs of uniform length mapping sense to rRNAs in one-cell embryos (living-sorted or methanol-fixed), with decreased expression in two–to-four-cell embryos, but virtually absent in samples from older stages that were in part also obtained by sorting. Thus, although we do not have independent validation, it seems unlikely that the observed rRNA expression is an experimental artifact. rRNAs, unlike mRNAs, are already transcribed in the one-cell embryo13. One may speculate about a turnover of maternally and paternally provided rRNAs to zygotically transcribed rRNAs. Finally, we find consistent evidence for a turnover of mitochondrial components in the one-cell embryo. We observed degradation products of mitochondrial tRNAs in the early embryo as well as many siRNAs directed against mitochondrial enzymes. Thus, it is tempting to speculate about mechanisms that selectively degrade paternal mitochondria in early zygotes, as described in vertebrates27.
Our data allowed us to shed light on the nature of yet virtually undescribed classes of small RNAs such as 26G-RNAs. Observations of small RNAs, in particular of length ∼26 nt with a 5′ Guanine bias have been reported earlier17,20 and were recently dubbed 26G-RNAs24. However, we found that 26G-RNAs are dynamically expressed and that they cluster in several intergenic regions. Northern blot analysis suggested that they may be generated or modified such that they appear in different sizes. Besides an increase of 26G-RNAs in older embryos we also observed an increase of 26nt endo-siRNAs mapping antisense to coding mRNAs. We failed to computationally detect a ‘ping pong’ biogenesis mechanism28,29 between 26G-RNAs and 26nt endo-siRNAs.
Our eFACS data and analyses raise many more open questions. However, altogether one is tempted to conclude that the complexity of small RNA expression dynamics in very early embryogenesis is comparable to the expression dynamics of protein encoding genes, and that eFACS will make a contribution towards a more complete understanding of gene regulatory networks during early animal development.
Supplementary Material
Supplementary Figure 1: eFACS of two-to-four-cell stage embryos.
Supplementary Figure 2: Comparison of miRNA expression in fixed and living mixed embryos.
Supplementary Figure 3: Validation of 16 miRNA fold changes computed from the deep sequencing data by qRT-PCRs on hand-picked living embryos.
Supplementary Figure 4: miRNA expression fold changes between the different samples.
Supplementary Table 1: Sequencing and mapping results in the samples.
Supplementary Table 2: miRNA predictions using miRDeep.
Supplementary Table 3: Top 100 reads mapping antisense to coding features.
Supplementary Table 4: Novel 21U-RNAs.
Supplementary Table 5: Sequencing miRNA expression.
Supplementary Table 6: 21U-RNAs are highly expressed in 1-cell embryos.
Supplementary Table 7: Expression of 21U-RNAs.
Supplementary Table 8: qRT-PCR results 16 miRNAs on hand-picked one-cell stage embryos.
Supplementary Table 9: List of primers and probes used in this study
Figure 4.

Abundance of small RNAs during embryogenesis.
Overall composition of different classes of small RNAs at different developmental stages obtained by deep sequencing. Small RNA categories were ordered by their overall abundance in all samples (miRNA > rRNA > 21U-RNA > tRNA > exons > 26G-RNA > mitochondrial > introns > 3′UTR > sn- & snoRNA > unknown). The relative abundance of different classes of small RNAs during embryogenesis is dynamic and appears to be regulated. The relative abundance of small RNAs in mixed embryos convolutes specific changes in small RNA expression during embryogenesis.
Acknowledgments
We are grateful to R. Lin for providing us with the TX189[P(oma-1)::oma-1::GFP] strain. All other strains used in this project were provided by the Caenorhabditis Genetic Center, which is funded by the National Center for Research Resources. MS gratefully acknowledges part-time funding from the Max-Delbrück-Center and New York University PhD exchange program and a travel grand from Boehringer Ingelheim Fonds. JM thanks the German Research Foundation for a fellowship in the International Research Training Group Genomics and Systems Biology of Molecular Networks (GRK 1360). FP and NR acknowledge partial funding from National Human Genome Research Institute (ModEncode U01 HG004276) and National Institutes of Health (R01HD046236). We thank S. Lebedeva for help with sequencing runs.
Footnotes
Author Contributions: FP and NR conceived, designed, and supervised the study. TC contributed to initial eFACS experiments. HPR helped with FACS machine settings and runs. WC and NL contributed to library preparations and sequencing. JM designed and performed computational studies with the exception of predicting new miRNAs (MRF). MS designed and performed the experiments. MS, JM, FP, NR analyzed the data. MS and NR wrote the paper, JM and FP edited it.
References
- 1.Sulston JE, Schierenberg E, White JG, Thomson JN. The embryonic cell lineage of the nematode Caenorhabditis elegans. Dev Biol. 1983;100:64–119. doi: 10.1016/0012-1606(83)90201-4. [DOI] [PubMed] [Google Scholar]
- 2.Piano F, et al. RNAi analysis of genes expressed in the ovary of Caenorhabditis elegans. Curr Biol. 2000;10:1619–1622. doi: 10.1016/s0960-9822(00)00869-1. [DOI] [PubMed] [Google Scholar]
- 3.Piano F, et al. Gene clustering based on RNAi phenotypes of ovary-enriched genes in C. elegans. Curr Biol. 2002;12:1959–1964. doi: 10.1016/s0960-9822(02)01301-5. [DOI] [PubMed] [Google Scholar]
- 4.Kamath RS, et al. Systematic functional analysis of the Caenorhabditis elegans genome using RNAi. Nature. 2003;421:231–237. doi: 10.1038/nature01278. [DOI] [PubMed] [Google Scholar]
- 5.Gonczy P, Rose LS. Asymmetric cell division and axis formation in the embryo. WormBook. 2005:1–20. doi: 10.1895/wormbook.1.30.1. [DOI] [PMC free article] [PubMed] [Google Scholar]
- 6.Sonnichsen B, et al. Full-genome RNAi profiling of early embryogenesis in Caenorhabditis elegans. Nature. 2005;434:462–469. doi: 10.1038/nature03353. [DOI] [PubMed] [Google Scholar]
- 7.Fernandez AG, et al. New genes with roles in the C. elegans embryo revealed using RNAi of ovary-enriched ORFeome clones. Genome Res. 2005;15:250–259. doi: 10.1101/gr.3194805. [DOI] [PMC free article] [PubMed] [Google Scholar]
- 8.Oegema K, Hyman AA. Cell division. WormBook. 2006:1–40. doi: 10.1895/wormbook.1.72.1. [DOI] [PMC free article] [PubMed] [Google Scholar]
- 9.Strange K, Christensen M, Morrison R. Primary culture of Caenorhabditis elegans developing embryo cells for electrophysiological, cell biological and molecular studies. Nat Protoc. 2007;2:1003–1012. doi: 10.1038/nprot.2007.143. [DOI] [PubMed] [Google Scholar]
- 10.Stroeher VL, et al. DNA-protein interactions in the Caenorhabditis elegans embryo: oocyte and embryonic factors that bind to the promoter of the gut-specific ges-1 gene. Dev Biol. 1994;163:367–380. doi: 10.1006/dbio.1994.1155. [DOI] [PubMed] [Google Scholar]
- 11.Schauer IE, Wood WB. Early C. elegans embryos are transcriptionally active. Development. 1990;110:1303–1317. doi: 10.1242/dev.110.4.1303. [DOI] [PubMed] [Google Scholar]
- 12.Edgar LG, Wolf N, Wood WB. Early transcription in Caenorhabditis elegans embryos. Development. 1994;120:443–451. doi: 10.1242/dev.120.2.443. [DOI] [PubMed] [Google Scholar]
- 13.Seydoux G, Dunn MA. Transcriptionally repressed germ cells lack a subpopulation of phosphorylated RNA polymerase II in early embryos of Caenorhabditis elegans and Drosophila melanogaster. Development. 1997;124:2191–2201. doi: 10.1242/dev.124.11.2191. [DOI] [PubMed] [Google Scholar]
- 14.Denli AM, et al. Processing of primary microRNAs by the Microprocessor complex. Nature. 2004;432:231–235. doi: 10.1038/nature03049. [DOI] [PubMed] [Google Scholar]
- 15.Grishok A, et al. Genes and mechanisms related to RNA interference regulate expression of the small temporal RNAs that control C. elegans developmental timing. Cell. 2001;106:23–34. doi: 10.1016/s0092-8674(01)00431-7. [DOI] [PubMed] [Google Scholar]
- 16.Knight SW, Bass BL. A role for the RNase III enzyme DCR-1 in RNA interference and germ line development in Caenorhabditis elegans. Science. 2001;293:2269–2271. doi: 10.1126/science.1062039. [DOI] [PMC free article] [PubMed] [Google Scholar]
- 17.Ambros V, et al. MicroRNAs and other tiny endogenous RNAs in C. elegans. Curr Biol. 2003;13:807–818. doi: 10.1016/s0960-9822(03)00287-2. [DOI] [PubMed] [Google Scholar]
- 18.Baugh LR, et al. Composition and dynamics of the Caenorhabditis elegans early embryonic transcriptome. Development. 2003;130:889–900. doi: 10.1242/dev.00302. [DOI] [PubMed] [Google Scholar]
- 19.Evans TC, Hunter CP. Translational control of maternal RNAs. WormBook. 2005:1–11. doi: 10.1895/wormbook.1.34.1. [DOI] [PMC free article] [PubMed] [Google Scholar]
- 20.Ruby JG, et al. Large-scale sequencing reveals 21U-RNAs and additional microRNAs and endogenous siRNAs in C. elegans. Cell. 2006;127:1193–1207. doi: 10.1016/j.cell.2006.10.040. [DOI] [PubMed] [Google Scholar]
- 21.Lin R. A gain-of-function mutation in oma-1, a C. elegans gene required for oocyte maturation, results in delayed degradation of maternal proteins and embryonic lethality. Dev Biol. 2003;258:226–239. doi: 10.1016/s0012-1606(03)00119-2. [DOI] [PubMed] [Google Scholar]
- 22.Friedlander MR, et al. Discovering microRNAs from deep sequencing data using miRDeep. Nat Biotechnol. 2008;26:407–415. doi: 10.1038/nbt1394. [DOI] [PubMed] [Google Scholar]
- 23.Batista PJ, et al. PRG-1 and 21U-RNAs interact to form the piRNA complex required for fertility in C. elegans. Mol Cell. 2008;31:67–78. doi: 10.1016/j.molcel.2008.06.002. [DOI] [PMC free article] [PubMed] [Google Scholar]
- 24.Ghildiyal M, Zamore PD. Small silencing RNAs: an expanding universe. Nat Rev Genet. 2009;10:94–108. doi: 10.1038/nrg2504. [DOI] [PMC free article] [PubMed] [Google Scholar]
- 25.Nance J, Munro EM, Priess JR. C. elegans PAR-3 and PAR-6 are required for apicobasal asymmetries associated with cell adhesion and gastrulation. Development. 2003;130:5339–5350. doi: 10.1242/dev.00735. [DOI] [PubMed] [Google Scholar]
- 26.Miska EA, et al. Most Caenorhabditis elegans microRNAs are individually not essential for development or viability. PLoS Genet. 2007;3:e215. doi: 10.1371/journal.pgen.0030215. [DOI] [PMC free article] [PubMed] [Google Scholar]
- 27.Sutovsky P. Ubiquitin-dependent proteolysis in mammalian spermatogenesis, fertilization, and sperm quality control: killing three birds with one stone. Microsc Res Tech. 2003;61:88–102. doi: 10.1002/jemt.10319. [DOI] [PubMed] [Google Scholar]
- 28.Aravin AA, et al. Developmentally regulated piRNA clusters implicate MILI in transposon control. Science. 2007;316:744–747. doi: 10.1126/science.1142612. [DOI] [PubMed] [Google Scholar]
- 29.Brennecke J, et al. Discrete small RNA-generating loci as master regulators of transposon activity in Drosophila. Cell. 2007;128:1089–1103. doi: 10.1016/j.cell.2007.01.043. [DOI] [PubMed] [Google Scholar]
Associated Data
This section collects any data citations, data availability statements, or supplementary materials included in this article.
Supplementary Materials
Supplementary Figure 1: eFACS of two-to-four-cell stage embryos.
Supplementary Figure 2: Comparison of miRNA expression in fixed and living mixed embryos.
Supplementary Figure 3: Validation of 16 miRNA fold changes computed from the deep sequencing data by qRT-PCRs on hand-picked living embryos.
Supplementary Figure 4: miRNA expression fold changes between the different samples.
Supplementary Table 1: Sequencing and mapping results in the samples.
Supplementary Table 2: miRNA predictions using miRDeep.
Supplementary Table 3: Top 100 reads mapping antisense to coding features.
Supplementary Table 4: Novel 21U-RNAs.
Supplementary Table 5: Sequencing miRNA expression.
Supplementary Table 6: 21U-RNAs are highly expressed in 1-cell embryos.
Supplementary Table 7: Expression of 21U-RNAs.
Supplementary Table 8: qRT-PCR results 16 miRNAs on hand-picked one-cell stage embryos.
Supplementary Table 9: List of primers and probes used in this study