

Abstract
Hb9 interneurons (Hb9 INs) are putative components of the mouse spinal locomotor central pattern generator (CPG) and candidates for the rhythm-generating kernel. Studies in slices and hemisected spinal cords showed that Hb9 INs display TTX-resistant membrane potential oscillations, suggesting a role in rhythm generation. To further investigate the roles of Hb9 INs in the locomotor CPG, we used two-photon calcium imaging in the in vitro isolated whole neonatal mouse spinal cord preparation to record the activity of Hb9 INs, which were subsequently stained for unambiguous genetic identification. We elicited fictive locomotion by transmitter application or by electrically stimulating the caudal tip of the spinal cord. Although most Hb9 INs were rhythmically active during fictive locomotion, their activity was sparse and they failed to fire with each cycle of the episode. If Hb9 INs are the principal pacemakers of the CPG in the hemisegment in which they are located, they should direct the firing of motor neurons, with their activity preceding that of their ipsilateral segmental ventral roots. Instead, during each locomotor cycle, onset of Hb9 IN activity lagged behind the onset of the ipsilateral ventral root burst by a mean phase of 0.21 during electrical stimulation and 0.28 during transmitter application. Whole-cell recordings in intact and hemisected spinal cords confirmed the imaging results. Our data suggest that Hb9 INs participate in fictive locomotion, but the delayed onset of activity relative to ipsilateral motoneurons suggests that Hb9 INs are unlikely to be the sole intrasegmental rhythm-generating kernel of the CPG.
Introduction
Central pattern generators (CPGs) are neural networks that produce a regular rhythmic output to drive a repetitive motor activity (Marder and Bucher, 2001, 2007). Interneurons that coordinate the rhythm and pattern of motoneuron outputs are components of the CPG. In vertebrate systems, a fictive locomotor pattern can be elicited in isolated spinal cords in vitro (Grillner, 2003; Kiehn, 2006) by transmitter application or electrical stimulation and recorded as motoneuron burst firing in ventral nerve roots. Lesion studies (Kudo and Yamada, 1987; Kjaerulff and Kiehn, 1996) suggest that the hindlimb CPG is distributed and each lumbar spinal segment alone is capable of rhythmogenesis. Although the cellular components of the locomotor CPGs have been characterized in lampreys, Xenopus tadpoles, and zebrafish (Roberts et al., 1998; Sillar et al., 1998; Grillner, 2003; Fetcho et al., 2008), studies in mammals have been hindered by the difficulty of identifying cell types. Transgenic mouse strains now make it possible to visualize and record from putative CPG neurons that express fluorescent proteins driven by promoters of different transcription factors (Kiehn, 2006).
The Hb9 interneurons (Hb9 INs) are a set of excitatory, ventromedial interneurons expressing the Hb9 transcription factor (Thaler et al., 1999; Wichterle et al., 2002; Hinckley et al., 2005; Wilson et al., 2005). They have several rhythmogenic characteristics: they fire rhythmically in phase with the ipsilateral ventral root during chemically induced rhythmic activity in the isolated hemicord (Hinckley et al., 2005) and can display TTX-resistant, voltage-dependent membrane potential oscillations in the presence of NMDA, serotonin (5-HT), and dopamine (DA) in slices (Wilson et al., 2005; Gordon and Whelan, 2006; Ziskind-Conhaim et al., 2008b). Because they were the first genetically identified neurons that have oscillatory properties in the spinal cord, Hb9 INs are attractive candidates for participation in the intrasegmental rhythm-generating kernel of a pacemaker-driven CPG (Kiehn, 2006; Brownstone and Wilson, 2008; Ziskind-Conhaim et al., 2008b). However, none of these results were obtained in whole spinal cords with intact locomotor networks.
Calcium imaging can monitor the activity of neurons in an isolated whole spinal cord during fictive locomotion (Bonnot et al., 2002, 2005). In collaboration with the Brownstone group, we have shown that ventromedial interneurons can be labeled with membrane-permeant calcium indicator dyes, and their activity monitored relative to the ventral root bursts (Wilson et al., 2007a,b). In this study, we have studied the activity of identified Hb9 INs during fictive locomotion evoked by both transmitter application and electrical stimulation of the caudal tip of the spinal cord. We found that, although the majority of Hb9 INs are rhythmically active during fictive locomotion, the mean onset phase of Hb9 activity trails that of the ipsilateral ventral roots in the same spinal segment, both when a bout of fictive locomotion starts and on a cycle-by-cycle basis during fictive locomotion. Hb9 INs also fire sparsely and usually fall silent during a continuing bout of electrically stimulated fictive locomotion. Our results argue against a model of Hb9 INs as the sole pacemaker cells for the intrasegmental networks that drive locomotion.
Materials and Methods
In vitro spinal cord preparation.
Hb9–green fluorescent protein (GFP) (mHB9-gfp 1b) and Hb9–lacZ (Hb9nlsLacZ/+) transgenic mice were generated by Dr. Thomas Jessell's laboratory (Columbia University, New York, NY), donated to us by Dr. Robert Brownstone (Dalhousie University, Halifax, Nova Scotia, Canada), and then bred in mouse facilities at Cornell University (Ithaca, NY). Crossing of the two heterozygous transgenic lines led to Hb9–GFP/lacZ mice that express both GFP and β-galactosidase (LacZ). These mouse lines were described previously (Arber et al., 1999; Wichterle et al., 2002; Wilson et al., 2005). All preparations were performed in accordance with Cornell University Institutional Animal Care and Use Committee and National Institutes of Health guidelines. Neonatal [postnatal 1 (P1) to P3] Hb9–GFP and Hb9–GFP/lacZ mice were used in this study. Mice were killed by decapitation, and their spinal cords were removed by laminectomy (Kudo and Yamada, 1987; Jiang et al., 1999) in ice-cold (4°C), oxygenated (95% O2/5% CO2) sucrose-based Ringer's solution (in mm: 206 sucrose, 2 KCl, 2 MgSO4, 1.25 NaH2PO4, 1 CaCl2, 1 MgCl2, 26 NaHCO3, and 10 d-glucose) or low-calcium Ringer's solution (in mm: 111 NaCl, 3.08 KCl, 25 NaHCO3, 1.18 KH2PO4, 3.8 MgSO4, 0.25 CaCl2, and 11 d-glucose). The ventral meninges were removed near the midline in segments T11 to L3 but left the ventral roots intact. The spinal cord was pinned, ventral-side up, in a Sylgard-filled dish and superfused with oxygenated (95% O2/5% CO2) normal mouse Ringer's solution (in mm: 111 NaCl, 3.08 KCl, 1.25 MgSO4, 2.52 CaCl2, 25 NaHCO3, 1.18 KH2PO4, and 11 d-glucose) at a flow rate of ∼6 ml/min. After dissection, the spinal cord was incubated at room temperature for 1 h before whole-cell recording or calcium indicator dye loading and imaging.
Fictive locomotion and ventral root recordings.
Fictive locomotion was elicited using one of two methods: bath application of transmitters or electrical stimulation of the caudal tip of the spinal cord. In the chemical stimulation method, transmitters or their agonists (9 μm NMDA, 12 μm 5-HT, and 18 μm DA, unless otherwise specified) were added to the superfusing normal Ringer's solution. In the electrical stimulation method, a blunt, fire-polished stimulation electrode was used to suck up the caudal tip of the spinal cord including the coccygeal roots and stimulated using a battery-operated stimulus isolator (A365; World Precision Instruments) driven by a 30 s, 1 Hz train of 1-ms-duration square pulses generated using a function generator (DS345; Stanford Research Systems). The threshold current to reliably elicit fictive locomotion episodes was empirically determined, typically 10–50 μA, and the spinal cord was allowed to rest for at least 3 min between consecutive stimulation episodes. To record motoneuron activity extracellularly from the ventral roots, suction electrodes were attached onto two ventral roots, typically left and right L1 or L2. Electrical signals were sent to an alternating current amplifier (1700; A-M Systems), filtered between 100 Hz and 1 kHz, and recorded by a digitizer (Digidata 1322A; Molecular Devices) using the pClamp 8 software (Molecular Devices).
Calcium indicator dye loading.
A dye solution of Fluo-3 AM was prepared as described by Garaschuk et al. (2006). Briefly, a solution of 10 mm Fluo-3 AM (Invitrogen) and Pluronic F-127 (20% by weight; Invitrogen) was prepared in DMSO (Sigma-Aldrich). This solution was diluted 10-fold with a HEPES-based buffer solution (in mm: 150 NaCl, 2.5 KCl, and 10 HEPES, at pH 7.3), filtered with a 0.22 μm centrifugal filter unit (Ultrafree-CL; Millipore Corporation), and backfilled into glass pipettes (with filaments, 1–4 MΩ; Sutter Instruments). To label the spinal cord, a pipette was inserted 100–200 μm under the ventral surface using a micromanipulator (Burleigh) and under visual guidance using oblique illumination. During entry, a holding pressure of 4 psi was controlled by a Picospritzer (PV820; World Precision Instruments). To eject dye, 10 s pressure puffs at 10 psi were repeated four to eight times. A total of 6–12 injection sites labeled the ventromedial region between T13 and L2. An optimal labeling pattern was typically observed after 1 h, when imaging began, and persisted for >6 h.
Two-photon microscopy.
Our two-photon microscope is based on a Bio-Rad Radiance 2000 scan head mounted on an upright microscope (BX50WI; Olympus). Excitation was focused with an Olympus 40×/numerical aperture 0.8 W infrared objective. The average excitation laser intensity was 20–40 mW. Epifluorescence was separated into two channels by a long-pass dichroic mirror (DCLP500; Chroma Technology) and emission filters (BGG22 and 575/150; Chroma Technology). Fluorescence below 500 nm was detected by a bialkali photomultiplier tube (HC125-02; Hamamatsu), and fluorescence above 500 nm was detected by a GaAsP photomultiplier tube (H7422; Hamamatsu). We used a method described previously to distinguish Fluo-3 from GFP fluorescence (Wilson et al., 2007b). Briefly, to image calcium transients, both Fluo-3 and GFP fluorescence were excited at 800 nm and collected in the >500 nm channel. The change in Fluo-3 fluorescence would therefore reflect only qualitative changes in intracellular calcium concentration but could be easily imaged because GFP expression in these mice was relatively low. To identify GFP-labeled cells, the laser was tuned to 900 nm, at which the two-photon action cross-section of Fluo-3 is low, and GFP fluorescence was collected exclusively in the <500 nm channel. Cascade blue was excited at 800 nm and detected using a different emission filter (390/60; Chroma Technology). In time-lapse imaging, the field of view was reduced to 128 × 128 pixels to facilitate a scan rate of 4–9 Hz. To synchronize the images with electrical recordings, we used pClamp software to record transistor–transistor logic (TTL) pulses that were generated by the Radiance control unit after each image frame was acquired.
Whole-mount staining of neurons that express LacZ.
GFP expression in the Hb9–GFP line is leaky, with expression not only in Hb9-expressing motoneurons and interneurons but also in ectopically labeled interneurons that do not themselves express Hb9 (Hinckley et al., 2005; Wilson et al., 2005). The Hb9–lacZ mouse is a homologous recombinant such that LacZ expression is confined only to Hb9-expressing neurons (Arber et al., 1999). To confirm the identity of the true Hb9 INs, after photographing the GFP fluorescence, the whole spinal cord from Hb9–GFP/lacZ double transgenic mice was stained for LacZ activity. An iron buffer solution (in mm: 5 potassium ferricyanide crystalline, 5 potassium ferricyanide trihydrate, and 2 magnesium chloride, in PBS) was prepared and stored in a light-protected container at 4°C. A stock 5-bromo-4-chloro-3-indolyl-β-d-galactopyranoside (X-gal) solution (20 mg/ml X-gal, in dimethylformamide) was prepared and stored at −20°C. Both stock solutions were warmed to 37°C before use. To make the staining solution, the stock X-gal solution was diluted 1:10 in the iron buffer solution (final X-gal concentration, 2 mg/ml), and sodium deoxycholate (0.01% by weight) and NP-40 substitute (0.02% by weight) were added. The spinal cord was covered with a lid to reduce evaporation and incubated in the staining solution overnight at room temperature to let the X-gal penetrate the whole spinal cord. Optimal staining occurred after 6–18 h. This staining resulted in cell-sized, blue precipitates that were clearly visible up to 200 μm below the ventral surface. We have tried other methods to stain LacZ-expressing cells in whole spinal cord by pressure injecting or incubating with fluorescent LacZ substrates (ImaGene Red or ImaGene Green; Invitrogen) or by replacing the iron buffer solution with nitroblue tetrazolium, all of which resulted in too much background staining. To correlate GFP and LacZ expression patterns, before X-gal staining, we took a mosaic image of the GFP fluorescence, with depths in 10 μm increments and an overall width of at least two lumbar segments, using two-photon microscopy. Next, without moving the spinal cord, the X-gal staining solution was added. Later, the X-gal reaction was imaged with a color CCD camera (CV-S3200; Israel Aerospace Industries) at different depths in the same lumbar regions. One-to-one correspondence of GFP and LacZ expressions could be determined by comparing the mosaic projection images (Fig. 1). Sometimes, cells would overlap in projection images, and, in those cases, the depth information was used to resolve the ambiguity.
Figure 1.
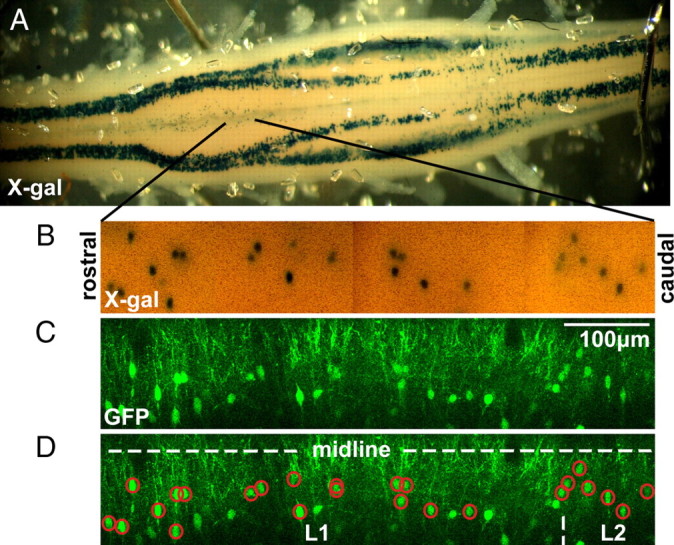
Identification of Hb9 interneurons. A, Spinal cord of an Hb9–GFP/lacZ mouse after an overnight X-gal stain. Hb9-expressing cells, including columns of motoneurons and small clusters of interneurons near the midline from T12–L2, appeared as blue precipitates because they were LacZ+. The T13–L2 ventromedial region had a slight orange tint as a result of the calcium-sensitive fluorescent dyes used for imaging experiments. B, Mosaic of projection images of the ventromedial region of a different spinal cord with X-gal-stained LacZ+ interneurons. Black lines indicate the approximate location in the spinal cord in which these images were taken. C, The corresponding mosaic of projection images of GFP fluorescence taken with a two-photon microscope before X-gal stain. D, By comparing the spatial distribution of the X-gal and GFP fluorescence mosaics over multiple lumbar segments, we can identify post hoc GFP-labeled interneurons that were either Hb9 INs (GFP+/LacZ+, red circles) or ectopically labeled. The locations of the midline and lumbar segments are illustrated by dotted white lines. The width of this image is the width of one lower thoracic or upper lumbar segment (i.e., L1).
Whole-cell recordings.
Whole-cell recordings were made from spinal cords dissected as above. In some preparations, cells were exposed in a hemicord by cutting the entire spinal cord along the midline as described by Hinckley et al. (2005). Patch recordings were made with standard techniques as described by Zhong et al. (2007). Briefly, borosilicate glass pipettes with a tip resistance of 5–7 MΩ were filled with an internal solution containing (in mm): 138 K-gluconate, 10 HEPES, 5 ATP-Mg, 0.3 GTP-Li, and 0.0001 CaCl2, pH 7.4 with KOH. Pipettes were visually guided to GFP-positive (GFP+) cells identified by fluorescence illumination. A Multiclamp 700A amplifier and Clampex pClamp 9 software (Molecular Devices) were used. Fictive locomotion was evoked as in the imaging preparation. We attempted to identify the authentic Hb9 neurons in these recordings using the physiological criteria proposed by Han et al. (2007) based on observations by Wilson et al. (2005). However, as Han and colleagues also found, these physiological criteria do not clearly fractionate the neurons into two groups, and we found that neurons that were identified as Hb9-like or non-Hb9-like had similar rhythmic properties. Thus, we present electrophysiological data on all the GFP-labeled interneurons.
Data analysis.
Analysis of imaging data was performed with routines written in MATLAB (MathWorks). All fluorescence traces shown in the figures are unfiltered raw traces. Fluorescence data from Bio-Rad-formatted images and electrophysiology recordings from pClamp data files were imported as data arrays. Using the recorded TTL trigger signals from the Radiance control unit, time-lapse fluorescence data were interpolated and matched in time to the electrophysiological data. Cells were outlined manually based on their Fluo-3 and GFP fluorescence. The fluorescence of a cell, F(t), was the sum of all pixel values within the cell outline. The change in fluorescence, ΔF/F0, was calculated as (F(t) − F0)/F0, where F(t) is the fluorescence at time t, and F0 is the baseline fluorescence, the mean of F(t) from the first 10 imaging frames of the time-lapse series. During electrical stimulation, the baseline reflects fluorescence during a prestimulus resting state, but, during transmitter application, the baseline is measured during continuous activity. Therefore, the values of ΔF/F0 measured during transmitter application are qualitative. For each cell, calcium signal peaks were identified by a routine that checks for rising fluorescence edges that increase in fluorescence by >3 SDs over the baseline fluorescence. This peak-picking routine can produce false positives, so edges that did not resemble a sharp rise followed by an exponential decay were manually deleted from analysis. In ∼5% of the data, we had to correct for lateral motion of the images in the x–y plane by thresholding the time-lapse fluorescence images into black-and-white frames and then finding the x–y shifts between consecutive frames that gave maximum cross-correlation. Motion correction for time-lapse images never exceeded ±5 pixels for x–y shifts, or the dataset was discarded. None of the figures in this study came from motion-corrected fluorescence images or traces, although those data were included in calculating population statistics.
To analyze the temporal relationship between calcium activity and fictive locomotor activity recorded from the ventral roots, we used a double normalization procedure (Berkowitz and Stein, 1994; Zhong et al., 2007) to generate circular plots. Ventral root recordings were rectified and then smoothed with a time constant of 750 ms. The beginning of a fictive locomotor cycle, 0.0 on the circular plot, was defined as the moment when the ipsilateral ventral root activity became stronger than the contralateral ventral root activity. Similarly, the middle of a fictive locomotor cycle, 0.5 on the circular plot, was the moment when ipsilateral ventral root activity became weaker than the contralateral root activity. Using this double-normalized timescale, onsets of calcium peaks or action potentials from a single cell were plotted over the range from 0 to 1. An arrow represents the vector whose direction was the mean phase of onsets of calcium or action potential activity and whose length reflected the r value; this r value is a measure of correlation between the timing of onsets of calcium peaks or action potentials, which indicates whether the activity is significantly rhythmic and coordinated with the ventral root bursts (Kjaerulff and Kiehn, 1996; Zar, 1996). The absolute value of the locomotor cycle period was calculated by finding the largest frequency component above 0.2 Hz in the Fourier transform of ventral root recordings.
Whole-cell recording results were analyzed using custom routines written in MATLAB (MathWorks), Clampfit (Molecular Devices), and Spike2 (Cambridge Electronic Design), as in the study by Zhong et al. (2007). Ventral root bursts were defined, and the phase of each action potential was calculated as in the imaging preparation.
Statistics.
All statistical tests are taken from Zar (1996). We classified imaged cells as rhythmically active if they showed an n of at least six calcium peaks over four locomotor episodes and had r > 0.5, and p < 0.05 in the Rayleigh's test using the approximation equation for p described by Zar (1996). All intracellularly recorded cells had an n of hundreds of action potentials, and the cells were classified as rhythmic if they had r > 0.5, and p < 0.05 in the Rayleigh's test. Mean phase angles of many cells were averaged, and the resulting population mean angles were compared using the two-sample Hotelling test for whether the two population means are significantly different, with a confidence level of p < 0.05. Errors for phase angles are expressed with 95% confidence limits calculated by Batchelet's test for second-order mean angles. Statistical significance of some distributions was measured with a Wilcoxon's signed-rank test or a one-way ANOVA. All errors are expressed as the SEM, unless otherwise specified.
Results
Hb9 interneurons can be positively identified in Hb9–GFP/lacZ double transgenic mice
Past studies of the role of Hb9 INs in the spinal locomotor network (Hinckley et al., 2005; Wilson et al., 2005, 2007a,b; Hinckley and Ziskind-Conhaim, 2006; Han et al., 2007; Ziskind-Conhaim et al., 2008b) used the Hb9–GFP transgenic mouse line (Wichterle et al., 2002), in which the Hb9 promoter drives expression of GFP. However, immunocytochemical colabeling for Hb9 protein revealed that, in this strain, GFP is expressed not only in Hb9 INs but also ectopically in other cells that do not express the Hb9 transcription factor protein (Hinckley et al., 2005; Wilson et al., 2005). As a result, whole-cell recordings from a GFP-labeled cell may reflect activity of an Hb9 IN or an ectopically labeled cell that is genetically undefined. To distinguish between these two possibilities, numerous electrophysiological criteria for Hb9 IN have been suggested (Han et al., 2007; Wilson et al., 2007a, 2008; Ziskind-Conhaim and Hinckley, 2008a). However, it is not clear which set of criteria is best or whether they can discriminate between the Hb9-expressing and ectopic populations of neurons (Han et al., 2007). An alternate strategy for identifying Hb9 INs is to use an Hb9–lacZ transgenic mouse line in which the knocked-in transgene produces LacZ. It has been demonstrated using Hb9 antibody staining that all of the LacZ-expressing cells are Hb9+ (Arber et al., 1999). Therefore, by cross-breeding Hb9–GFP and Hb9–lacZ transgenic lines, it is possible to identify Hb9 INs via GFP fluorescence and subsequent LacZ stains. Indeed, this Hb9–lacZ approach works well in thin slices for immunohistochemistry (Wilson et al., 2005).
We have further pursued the GFP/LacZ strategy by staining for LacZ activity in whole spinal cords from Hb9–GFP/lacZ mice (Fig. 1A). Our optimized whole-mount staining protocols, based on an overnight incubation with X-gal, resulted in round, cell-sized, blue precipitates across multiple thoracic and lumbar segments. The stained Hb9-expressing cells included the columns of motoneurons as well as clusters of Hb9 INs located in the ventromedial region of the T12–L2 segments. Cells located as deep as ∼200 μm below the ventral surface were stained and imaged with a color CCD camera. By comparing image mosaics of the X-gal stain with the GFP fluorescence captured before LacZ staining (Fig. 1B,C), we can identify which GFP-expressing cells are also LacZ+ and therefore are true Hb9 INs (Fig. 1D, red circles). We found no correlation between cell size and identity. There were more Hb9 INs near the midline, but some ectopically labeled cells were in the same region. In one representative stain of two ipsilateral lumbar segments centered at L1 in a P2 Hb9–GFP/lacZ mouse, we found that 59% (40 of 68) of the GFP-labeled cells were Hb9 INs. This percentage is comparable with the numbers reported in two previous studies [∼55% (Wilson et al., 2005); 74% (Hinckley et al., 2005)] and highlights the importance of avoiding the numerous ectopically labeled cells in Hb9–GFP mice.
Rhythmic calcium transients can be recorded from multiple Hb9 INs during fictive locomotion in the intact spinal cord
Most experiments (Hinckley et al., 2005; Wilson et al., 2005; Hinckley and Ziskind-Conhaim, 2006; Han et al., 2007; Wilson et al., 2007a; Ziskind-Conhaim et al., 2008b) studied putative Hb9 INs in slices or in hemisected spinal cords because the cells lie relatively deep beneath the ventral surface and cannot be visualized with wide-field fluorescent microscopy. Here, we used two-photon laser-scanning microscopy (Denk et al., 1990; Stosiek et al., 2003; Zipfel et al., 2003; Wilson et al., 2007b) to image interneurons 50–200 μm deep within whole spinal cords (Fig. 2A). Multiple bolus injections of the membrane-permeant calcium-sensitive fluorescent dye Fluo-3 AM at sites along the midline in T13–L2 segments labeled hundreds of cells in the ventromedial region. Fluo-3 AM was chosen because a previous survey in our group found that this dye showed the most uniform labeling pattern and fluorescence responses with good signal-to-noise ratios (Wilson et al., 2007b). Time-lapse images recorded calcium transients from the internalized AM-ester dye, which have been shown previously to reflect action potential activity with high fidelity (Kerr et al., 2005; Sato et al., 2007).
Figure 2.

AM-ester calcium indicator dye accurately reflects the number and timing of spikes from spinal interneurons. A, Interneurons in the ventromedial region of in vitro isolated whole neonatal mouse spinal cord were loaded with Fluo-3 AM. After the spinal cord was hemisected, whole-cell recording was made using pipette filled with dextran-conjugated Cascade Blue. B, Within 5 min of break-in, current injection steps elicited membrane potential depolarization and fluorescence transients. A small current step led to depolarization without action potential (AP) and no detectable fluorescence change, whereas larger steps resulted in spikes and fluorescence peaks, demonstrating that fluorescence reflects suprathreshold activity. C, The intensity of fluorescence peak scales linearly with the number of spikes evoked, although there were some variation among three interneurons from the same cord and dye preparation. D, Individual fluorescence data points (red rectangles) are shown with the corresponding electrical recording during one current step. Fluorescence transient peaks in the imaging frame after an action potential. The measured onset of fluorescence peak (red arrow) appears to occur before the start of spiking activity because of our limited imaging frame rate.
To verify this calcium peak-action potential correlation for spinal interneurons and also to determine the sensitivity of our microscope, we performed simultaneous whole-cell recording and calcium imaging of unidentified interneurons in the ventromedial region of the spinal cord (n = 3 cells). The pipette was visualized with dextran-conjugated Cascade Blue, which also intracellularly labeled the interneuron (Fig. 2A). Because the calcium indicator dye washed out quickly, recordings were done within 5 min of break-in. In current clamp, incremental current injection steps led to membrane potential depolarizations with increasing numbers of action potentials. Simultaneously, we imaged the Fluo-3 fluorescence transients from the recorded interneuron (Fig. 2B). With a small amount of injected current, the interneuron depolarized but did not spike and showed no detectable fluorescence transient. With larger amounts of injected current, the interneuron fired one or more action potentials, which evoked a fluorescence peak whose amplitude correlated linearly with the number of action potentials (Fig. 2C) (linear fit R2 = 0.79–0.91).
For this study, it was essential to determine the timing of the calcium peaks relative to the action potentials. The imaging rate of the laser-scanning microscope (typically 7 Hz in our experiments) limits the temporal resolution at which we can measure calcium peaks. Actual calcium influx is known to occur within milliseconds of action potentials (Markram et al., 1995), but, because a barrage of action potentials during fictive locomotion can last for seconds and the fluorescence can continue to sum for many frames, the time of the fluorescence peak may be considerably delayed relative to the start of firing. Thus, we chose to identify the frame before the fluorescence sharply rises (defined by ΔF/F0 > 3 SDs of F0) as the earliest time that an action potential could cause an increase in fluorescence. As seen in Figure 2D, each action potential is followed by a fluorescence peak in the next imaging frame. Preceding each significant fluorescence peak is a sharp rising edge whose local minimum point (Fig. 2D, red arrow) was used to estimate the earliest time when an action potential driving the fluorescence peak could occur. This “onset of fluorescence peak” was measured for 103 current injection steps that resulted in one to seven action potentials; as expected, we found that the onset of fluorescence peak preceded the first electrophysiologically recorded action potential by 0.15 ± 0.1 s (±SD), i.e., within one image frame, when imaging at 7 Hz. Together, these results demonstrate that the fluorescent peaks reflect suprathreshold activity and scale linearly with the number of action potentials. Moreover, the earliest possible time for beginning of interneuron spiking activity can be determined using the onset of rise in fluorescence to discrete peaks, with an accuracy of approximately the time to obtain one image frame (0.14 s). This calculated onset time precedes the actual onset time of the action potential burst (by up to the time of one frame), but it cannot follow it.
We proceeded to investigate the activity of identified Hb9 INs in Hb9–GFP/lacZ mice. From the Fluo-3 AM-labeled cell population, we identified Hb9 INs by their GFP fluorescence and the subsequent X-gal stain (Fig. 3A,B). During imaging, fictive locomotion was elicited by one of two methods: (1) electrical stimulation of the caudal tip of the spinal cord (Gordon and Whelan, 2006; Zhong et al., 2007), and (2) chemical stimulation by bath application of 9 μm NMDA, 12 μm 5-HT, and 18 μm DA. Both methods produced robust fictive locomotion with rhythmic ventral root bursting and left–right alternation, which was recorded using suction electrodes from upper lumbar ventral roots. Figure 3C shows one representative set of calcium transients from a group of four GFP+ interneurons [three of which were subsequently shown to be Hb9+, whereas one was Hb9 negative (Hb9−)] (Fig. 3B) during fictive locomotion. The cells were at the border of the L1 and L2 segments, whereas the extracellular recordings were made from the ipsilateral L1 and contralateral L2 roots. During fictive locomotion elicited by electrical stimulation, the three Hb9 INs, but not the ectopically labeled cell, showed sharp calcium peaks at the onset of fictive locomotion, as well as detectable peaks during later cycles of the locomotor episode. Fluorescence also slightly increases uniformly across many Fluo-3 AM-labeled cells at the beginning of electrical stimulation, with no peaks, as seen shortly after electrical stimulation in the ectopically labeled Hb9− cell 4 in Figure 3C. This early increase in fluorescence in Fluo-3 AM-labeled cells is likely not attributable to spiking activity for two reasons. First, the early increase is gradual and does not resemble the spike-related calcium peak that has a sharp rise and an exponential decay (Fig. 2). Second, this slow, gradual signal can also be detected with similar amplitude and form in all neighboring non-Hb9 interneurons and even in neighboring neuropil regions that lack visible neuronal somata (supplemental Fig. 1, available at www.jneurosci.org as supplemental material). This suggests a common origin for the early increase in fluorescence, and we conjecture that it arises from out-of-focus fluorescence from dye-labeled superficial axonal afferents, which would respond to the electrical stimulation of the caudal tip of the spinal cord. During chemically evoked fictive locomotion, the Hb9 INs had calcium peaks that were in phase with the ipsilateral ventral root activity, whereas the ectopically labeled cell showed peaks that were not rhythmically in phase with the ventral root bursts. Bath application of NMDA/5-HT/DA caused a 19 ± 5% increase of baseline fluorescence intensity in all Fluo-3 AM-labeled cells (n = 12 cells; p < 0.01, Student's t test). This fluorescence increase applied to cells with or without GFP and reflected an overall increase in calcium concentration when the spinal cord was excited by transmitters, which returned to the original baseline intensity after transmitter washout. These results demonstrated our ability to image calcium transients of multiple, identified Hb9 INs in a whole spinal cord during fictive locomotion.
Figure 3.

Two-photon calcium imaging of Hb9 interneurons during fictive locomotion. A, Experimental setup. AM-ester calcium-sensitive fluorescent dyes were pressure injected into the ventromedial region of an in vitro spinal cord from a neonatal Hb9–GFP/lacZ mouse. Suction recording electrodes were used to record extracellular electrical signals from ipsilateral and contralateral ventral roots (e.g., iL1 or iL2 and cL1 or cL2). Fictive locomotion was evoked by either bath application of NMDA, 5-HT, and DA, or electrical stimulation of the caudal tip of the cord. B, Two-photon projection images show cells near the injection sites that were indiscriminately loaded with Fluo-3 AM and several cells that were expressing GFP. The GFP-labeled interneurons were subsequently identified to be either Hb9 INs or ectopically labeled by the post hoc X-gal stain. C, Typical fluorescent traces show calcium transients in individual GFP-labeled interneurons during fictive locomotion. Electrical stimulation of the caudal tip of the cord elicited fictive locomotor episodes lasting ∼30 s. Extracellular recordings of ventral roots and their corresponding low-pass-filtered traces showed the signature left–right alternation of fictive locomotion. Hb9 INs, cells 1–3, had calcium peaks when ipsilateral ventral root was active (shaded gray), whereas the ectopically labeled cell, cell 4, did not have calcium peaks. Onsets of calcium peaks are indicated (triangles; black if in phase with ipsilateral root activity, red if out of phase). For the same set of cells, calcium transients were also imaged during fictive locomotion evoked by 9 μm NMDA, 12 μm 5-HT, and 18 μm DA. In chemically induced fictive locomotion, Hb9 INs fired in phase with ipsilateral ventral root activity, whereas ectopically labeled cell fired tonically in both ipsilateral and contralateral phases of fictive locomotion.
At the beginning of a fictive locomotion episode, onset of Hb9 IN spiking activity occurs after the onset of ipsilateral ventral root activity
Transmitter-elicited fictive locomotion is well characterized (Kjaerulff and Kiehn, 1996; Jiang et al., 1999; Whelan et al., 2000) and provides a sustained period of fictive locomotion but is not useful for studying the initial onset of a locomotor bout. In contrast, electrical stimulation of the caudal tip of the spinal cord evokes episodes of fictive locomotion, which can be repeated >20 times in a single preparation (Lev-Tov et al., 2000; Whelan et al., 2000). Each episode consists of robust fictive locomotor patterns lasting ∼30 s with rhythmic bursting and left–right alternation; it has a distinct initiation point, allowing us to study the events that occur at the beginning of a bout, during the transition from a resting state to fictive locomotion. To more closely investigate the possible role of Hb9 INs as the pacemaker kernel that drives the intrasegmental locomotor circuit, we looked at the timing of the initial onsets of Hb9 IN calcium peaks relative to the ipsilateral ventral root activity of that segment. We found that, at the start of fictive locomotor episodes elicited by electrical stimulation, onsets of Hb9 IN calcium peaks lagged behind the beginning of ipsilateral ventral root activity (Fig. 4A). The mean time lag for each Hb9 IN was calculated, and the values for all Hb9 INs were summarized in a histogram (Fig. 4B). The mean lag was 1.4 ± 0.3 s (n = 25 cells) and was significantly delayed compared with ipsilateral motor output (p < 0.001, Student's t test). This lag is much greater than the error introduced by the imaging frame rate (∼0.15 s) and therefore cannot be explained by the slow calcium imaging rate. Some neurons failed to fire at all during the first ventral root burst (Fig. 4B). Of 25 neurons tested, only three had their average onset of calcium peak before the onset of the ipsilateral ventral root burst, and the mean onset was significantly later than the ventral root burst onset (p = 6 × 10⁻⁵, Wilcoxon's signed-rank test). These data suggest that Hb9 INs are rarely active before or at the onset of ipsilateral ventral root activity; rather, most become active well after the onset of ipsilateral motoneuron bursting.
Figure 4.

Onset of Hb9 interneuron calcium peak lags the onset of ipsilateral motor output. A, Fluorescence trace shows the calcium transient of an Hb9 IN (GFP+/LacZ+) at the beginning of a fictive locomotor episode elicited by tonic electrical stimulation of the caudal tip of the spinal cord. Fictive locomotion followed seconds after electrical stimulation began. The onset of the calcium peak clearly lagged the beginning of ipsilateral ventral root activity. B, The lag time between onset of calcium peak and ipsilateral ventral root activity was averaged over multiple fictive locomotor episodes for each Hb9 IN. The distribution of the mean lag times are summarized in a histogram. C, Circular plot shows the onsets of calcium peaks (triangles; black for electrical stimulation, white for chemical) from one Hb9 IN relative to the locomotor cycle (ipsilateral half-cycle shaded gray). Most calcium peak onsets lie in the first quadrant of the circular plot, indicating that they lagged behind the beginning of ipsilateral motor output (labeled 0.0). Vector shows the mean phase and r value, which is statistically significant and indicates that this Hb9 IN was rhythmically active. The inner circle indicates r = 0.5, the threshold for rhythmicity. The locomotor cycle periods were 2.4 s for electrical stimulation and 4.7 s for chemical stimulation. D, Population circular plot summarizes the phase of spiking activity from all Hb9 INs that had calcium peaks during fictive locomotion. Each dot represents the end of a mean phase vector from a single Hb9 IN, i.e., from a single-cell plot such as C (black for electrical stimulation, white for chemical). contra., Contralateral; ipsi., ipsilateral.
Our analysis looked at the timing of Hb9 activity in the T13–L2 spinal segment relative to the ipsilateral flexor-related ventral root activity in the same or an immediately adjacent segment. It is conceivable that, instead of driving the flexor motoneurons, the Hb9 INs may drive ipsilateral extensors. However, our data argue against this possibility. During caudal cord electrical stimulation, onsets of activity from ipsilateral extensors (recorded in L5) and from the contralateral L2 flexors typically occur synchronously (G. Zhong and R. M. Harris-Warrick, unpublished observations), allowing us to monitor ipsilateral extensor activity with the contralateral L2 bursts. During some stimulations, fictive locomotion began with an ipsilateral flexor burst, whereas in others it began with the contralateral flexor (and thus the ipsilateral extensor) burst. If Hb9 IN activity were linked to the ipsilateral extensor/contralateral flexor, the lag time of onset at the beginning of an evoked locomotor episode, as measured from the ipsilateral flexor, would be different in those fictive locomotion episodes beginning with a contralateral compared with an ipsilateral flexor burst. In contrast, if Hb9 IN activity were linked to the ipsilateral flexor, we would expect no difference in lag times between the two groups. Our data showed no difference between the distributions of lag times of the two groups (p = 0.24, Student's t test); both groups are evenly distributed around the mean of 1.42 (p > 0.1, Wilcoxon's test). We conclude that there is no evidence suggesting that the timing of activity of the Hb9 IN onset is associated with the activity of the contralateral flexor and therefore the ipsilateral extensor motoneurons.
During ongoing bouts of fictive locomotion, rhythmic activity and timing of Hb9 INs also lag behind ipsilateral ventral root activity
To evaluate the rhythmicity of Hb9 INs during ongoing fictive locomotion, we used circular statistics. Circular plots show the relative phase between the onset of the Hb9 IN calcium peak and the onset of ipsilateral motor output. In Figure 4C, the onsets of calcium peaks are shown for a single Hb9 IN during electrically and chemically evoked fictive locomotion. The mean phase is plotted as a vector, in which the vector length reflects the r value, indicating the statistical significance of the rhythmicity. This neuron was significantly rhythmic during both types of stimulation. Significantly, it had a mean onset phase in the first quadrant, after the onset of the ipsilateral ventral root burst; 89% of the onsets of calcium peaks were in the first and second quadrants of the plot, whereas only 11% were in the fourth quadrant in which they would be leading the ventral root burst. As a population, 83% (25 of 30) of the imaged Hb9 INs responded with multiple calcium peaks during electrically evoked fictive locomotion episodes and 63% (19 of 30) during chemical stimulation. The onset phase of their activity during the cycle is summarized in a population phase plot (Fig. 4D); the vectors of 80% of these responsive Hb9 INs lie outside the r = 0.5 inner circle, and thus they are rhythmically active. The mean onset phase of the significantly rhythmic Hb9 INs during fictive locomotion was 0.21 [r = 0.58; 95% confidence intervals (CIs) of +0.03, −0.04] for electrical stimulation and 0.28 (r = 0.52; 95% CIs of +0.08, −0.07) for chemical stimulation; both values are significantly later than 0, the onset of ipsilateral ventral root bursting (electrical stimulation, p < 4 × 10⁻⁵; chemical stimulation, p < 0.01; Wilcoxon's test). The onset phases in the two conditions were not significantly different from one another (p < 0.25, Hotelling test). Again, these delays are far too long to be explained by the slow calcium imaging rate.
Because phase plots can be skewed by some Hb9 INs that were only weakly activated during electrically evoked fictive locomotion, with only a small number of calcium peaks, we further investigated the set of the most active Hb9 INs that responded with at least six calcium peaks over all fictive locomotor episodes during electrical (n = 18) and chemical stimulations (n = 15). Within this subset of cells, we found that 78% of Hb9 INs (14 of 18) were rhythmically active during electrical stimulation (average r = 0.71) and 73% (11 of 15) during chemical stimulation (average r = 0.66). Even for these most strongly rhythmic cells, the mean onset time vector was significantly >0 for both electrical stimulation (0.19, CIs of +0.04, −0.05; p = 6 × 10⁻⁵, Wilcoxon's test) and for chemical stimulation 0.24 (CIs of +0.17, −0.06; p = 0.0005). There was no relationship between the segment in which a cell was located and its onset phase relative to its ipsilateral ventral root (one-way ANOVA, p = 0.83 for electrical stimulation, p = 0.55 for chemical stimulation). Previous reports, which examined multiple lumbosacral segments with millisecond resolution, found rostrocaudal waves of activation for motoneurons (Bonnot et al., 2002) and dorsal spinal interneurons (Cuellar et al., 2009). Because we imaged in smaller regions with slower temporal resolution and because the reported average delay along a single segment in the in vitro mouse spinal cord (Bonnot et al., 2002) is on the order of tens of milliseconds, we would not necessarily detect similar rostrocaudal waves if they exist in Hb9 INs. The existence of such waves may also depend on cell type and should be investigated in future experiments. All Hb9 INs that were rhythmically active during chemically induced fictive locomotion were also rhythmically active during electrical stimulation, but some Hb9 INs that were rhythmic during electrical stimulation were not rhythmic during chemically induced fictive locomotion. However, calcium imaging might have underestimated the number of interneurons with calcium peaks during chemical stimulation because the fluorescence changes during chemical stimulation tended to have smaller amplitudes, possibly attributable to additional tonic activity and calcium elevation in the presence of excitatory transmitters. Our data suggest that most Hb9 INs showed rhythmic and well timed calcium peaks during both electrically and chemically evoked fictive locomotion, but the onsets of the calcium peak activity consistently lagged the onsets of ipsilateral ventral root.
Electrophysiological recordings confirm that Hb9 IN onset activity lags ventral root activity
Having used calcium imaging to demonstrate that the onset of Hb9 IN activity lags behind the onset of ipsilateral ventral root activity, we confirmed these findings using intracellular recordings, which offer much finer temporal resolution. Whole-cell recordings were made from GFP+ interneurons in the whole and hemisected spinal cords of Hb9–GFP mice. Intracellular recording of GFP+ cells in whole spinal cord is difficult because most Hb9 INs lie relatively deep beneath the ventral surface and are thus impossible to visualize with standard fluorescence microscopes. Our initial attempts to expose the neurons with slits in the ventral surface showed that damage to the ventral surface near the midline can significantly reduce the likelihood of eliciting fictive locomotion via electrical stimulation of the caudal spinal cord. We addressed this problem in two ways. First, we made intracellular recordings from superficial GFP+ cells in whole spinal cords. Figure 5A shows one successful whole-cell recording of a GFP+ IN in the whole spinal cord. This neuron showed subthreshold oscillations and rhythmic spiking activity during a fictive locomotor bout elicited by electrical stimulation (Fig. 5B) but tonic activity during chemical stimulation, even when the neuron was hyperpolarized (Fig. 5C). A circular plot of all action potentials (Fig. 5D) showed that the neuron was rhythmically active during electrically stimulated but not chemically stimulated, fictive locomotion. During electrical stimulation-evoked fictive locomotion, the mean firing phase for all action potentials in this cell was 0.32 (r = 0.61). To make a comparison with the calcium imaging experiments, which measured the onset of spiking activity, we also calculated the timing of the first action potential per ipsilateral ventral root burst: the mean phase for the first action potential in each burst was 0.20 (r = 0.70) during electrical stimulation-evoked fictive locomotion. It is interesting that this cell was rhythmic during electrically evoked but not chemically evoked fictive locomotion. The lack of chemically evoked rhythmicity was not attributable to deterioration of the cell or the spinal cord, because rhythmic bursting in response to electrical stimulation was observed before and after neurotransmitter application. We also saw, in the imaging preparation, several cells that respond during electrically evoked but not chemically evoked fictive locomotion. These anecdotal observations raise the intriguing possibility that, depending on how it is evoked, fictive locomotion recruits different populations of interneurons for the CPG.
Figure 5.

Intracellular recordings in whole and hemisected spinal cords confirm that spiking activity lags ipsilateral motor output. A, Experimental setup for intracellular recording of GFP+ interneurons in the spinal cord of a neonatal Hb9–GFP mouse. B, C, Representative intracellular recordings from one putative Hb9 IN in whole spinal cord during fictive locomotion elicited by electrical or chemical stimulation. Note that both ventral root and intracellular activity diminish over the course of the long electrical stimulation, which is much longer than the stimulation used in imaging experiments. D, A circular plot shows that spikes from this GFP+ interneuron were mostly in phase with the ipsilateral motor output during electrical stimulation (shaded gray, black triangles), although spikes during chemical stimulation were not rhythmic (white triangles). E, Experimental setup for intracellular recording of GFP+ interneurons in a hemisected spinal cord of a neonatal Hb9–GFP mouse. F, Representative recording from one GFP+ interneuron in a hemisected spinal cord during chemically evoked fictive locomotion. A bias current was applied to counteract the generally excitatory effect of the transmitters and display the bursts more clearly. G, A circular plot shows that spikes from this one GFP+ interneuron were mostly in phase with the ipsilateral motor output during chemical stimulation (shaded gray, white triangles). H, Population circular plot of all GFP+ cells recorded from hemisected spinal cords show that approximately half of the GFP+ cells were rhythmic, i.e., outside the r = 0.5 circle. I, The rhythmic GFP+ INs have mean phases of spiking activity that lags the ipsilateral root activity. J, To compare with calcium imaging data, the population circular plot is regraphed using only the first spike per burst (instead of all spikes). The mean phases still significantly lags the ipsilateral root activity. AP, Action potential; contra., contralateral; ipsi., ipsilateral.
To record intracellularly from more neurons, we adopted the hemisected spinal cord preparation (Fig. 5E) (Hinckley et al., 2005) that provided better access through the completely transected midline surface but in which electrically evoked fictive locomotion was not possible. Extracellular recordings from one ventral root showed that slow rhythmic bursting activity could be elicited by chemical stimulation. Whole-cell recordings of GFP+ interneurons revealed rhythmic spiking activity (Fig. 5F). Most cells were highly depolarized and fired almost continuously in the presence of NMDA/5-HT/DA, but, when a holding current was applied to lower the membrane potential toward its natural level, visible bursts appeared in many of the cells, as reported previously by Hinckley et al. (2005). The circular plot of one typical GFP+ IN (Fig. 5G) confirmed that its peak of activity lagged the onset of ipsilateral ventral root activity, with a mean phase of 0.18 and a mean vector value of r = 0.82. The rhythmic onset of activity of this cell (measured by the first action potential in each burst) lagged the onset of ipsilateral ventral root activity with a mean phase of 0.12 (r = 0.86). As a population, 53% of the GFP+ interneurons (9 of 17) (Fig. 5H) tested were rhythmically active, with r > 0.5. For these rhythmic GFP+ INs (average r = 0.57), if all action potentials were counted, the mean phase of firing was 0.17 (95% CIs of +0.7, −0.11) (Fig. 5I). To make a comparison with the calcium imaging experiments, which measured the onset of spiking activity, we also plotted the timing of the first action potential per ipsilateral ventral root burst. Consistent with our imaging results, the mean onset phase of firing was 0.12 (95% CIs of +0.07, −0.09; r = 0.64) and was significantly later than zero (p = 0.001, Wilcoxon's test) (Fig. 5J). Only one of nine rhythmic GFP+ INs had a mean onset of spiking before the onset of the ipsilateral ventral root burst. The mean onset phases recorded either electrophysiologically (in the hemisected spinal cord, 0.12) (Fig. 5J) or by calcium imaging (0.28) (Fig. 4D) were not significantly different from one another (p < 0.25, Hotelling test), and both were significantly later than zero. These electrophysiological data corroborate our imaging results to demonstrate that the onset of rhythmic firing by Hb9 INs lags behind the onset of ipsilateral ventral root activity during fictive locomotion.
Activity patterns of Hb9 interneurons are sparse and variable
Because there are relatively few Hb9 INs (∼100–500, 40 per lumbar segment near L1) (Fig. 1), if they are to drive the rest of the CPG as the primary pacemaker neurons, they should show relatively robust and consistent levels of activity during each cycle of fictive locomotion. Electrical stimulation of the caudal spinal cord makes it possible to repeatedly induce episodes of fictive locomotion and see whether Hb9 IN activity is the same or different with each locomotor bout. During repeated episodes of fictive locomotion elicited by electrical stimulation, we imaged calcium transients of single Hb9 INs (Fig. 6A,B) and found that the activity of each Hb9 IN was variable on a cycle-by-cycle basis. In each episode, there were fewer calcium peaks than ipsilateral ventral root bursts, so the Hb9 INs did not fire during every locomotor cycle. Moreover, most calcium peaks occurred during the beginning of a fictive locomotor episode, with the probability of observing a calcium peak falling nearly to zero during a prolonged episode (Fig. 6C). In contrast, ventral root activity, quantified by the integrated area of each ventral root burst, remained stable and strong throughout the fictive locomotor episode (Fig. 6C, bottom trace). We also failed to find regular calcium peaks from a single Hb9 IN during each cycle of chemically evoked fictive locomotion (Fig. 6D). As described above, most Hb9 INs showed rhythmic activity relative to the ipsilateral ventral root discharges but were only active in ∼67% of the cycles. These data imply that Hb9 IN activity is not required for every ventral root burst and, moreover, that Hb9 INs may be more involved with the initiation than in the maintenance of an electrically evoked fictive locomotor episode.
Figure 6.

Firing patterns of Hb9 interneurons during a bout of fictive locomotion. A, Representative fluorescence trace of calcium transient from one Hb9 IN (GFP+/LacZ+) during fictive locomotion elicited by electrical stimulation of the caudal spinal cord. Shaded area represents when ipsilateral ventral root is active, and bar represents onset of calcium peak. This is shown schematically at the bottom of the trace. B, Calcium transients of one Hb9 IN during fictive locomotor episodes elicited by electrical stimulations that were repeated 10 times. Patterns of calcium peaks did not repeat and were sparse compared with the number of locomotor cycles. The Hb9 INs tended to show activity at the beginning of a fictive locomotor episode and fall off sharply with repeated bursts during a bout. These data are quantified in C, showing the probability of the neuron delivering a calcium transient for each burst in the bout (data averaged from 40 bouts). By comparison, the integrated areas of ipsilateral and contralateral ventral root activity were relatively stable throughout the bout (bottom graph in C). a.u., Arbitrary units. D, Calcium transients of a single Hb9 IN during fictive locomotion elicited by bath application of 5-HT, NMDA, and DA; the three lines show consecutive records of activity during 30 locomotor cycles. Calcium peaks were observed in most but not all the locomotor cycles. E, During electrically evoked fictive locomotion, four nearby Hb9 INs show uncoordinated calcium transients. F, The frequencies of observing the four cells in E firing together in the same cycle are quantified using 10 bouts. A trend line shows the expected frequencies for four cells if they are independent, identical, and generate calcium peaks with probability as shown in C. Similarity between the trend line and the observed frequency suggest that Hb9 INs were not strongly coupled.
Calcium imaging enabled us to record calcium transients from multiple Hb9 INs at once. When comparing as many as five Hb9 INs within the same field of view, we did not observe any obvious spatial organization in their activation patterns. Within a single electrically evoked fictive locomotion episode, activity of Hb9 INs from cycle to cycle appeared uncoordinated (Fig. 6E). We quantified the frequencies of observing multiple Hb9 INs firing together during the same cycle (Fig. 6F) and compared these with the predicted frequencies assuming that each Hb9 IN was independent and showed activity according to the calcium peak probability in Figure 6C. There was no significant difference between the expected frequencies and the observed frequencies, suggesting that these Hb9 INs were not strongly coupled and fired independently during fictive locomotion.
Heterogeneous firing activity of ectopically labeled interneurons
So far we have focused on the genetically defined population of Hb9 INs. Because our X-gal stain also identifies ectopically labeled (Hb9−, GFP+/LacZ−) cells, we looked at their patterns of calcium activity during fictive locomotion. Ectopically labeled cells typically showed two kinds of calcium transients (Fig. 7A). Approximately half of the cells (14 of 27, 52%) remained silent during fictive locomotion evoked by either method (Figs. 7A, right, 3C). The other half of the ectopically labeled cells (13 of 27, 48%) had calcium transients during chemical (7 of 27) and/or electrical (13 of 27) stimulation. Among all the ectopically labeled cells, 30% (8 of 27) had calcium peaks with a distinct “sawtooth” shape, including a large, sharp peak (Fig. 7A, left). Although the frequency of sawtooth-like calcium peaks was approximately the same as the fictive locomotion stepping cycle, the onsets of sawtooth-like calcium peaks were not significantly phase locked relative to the ipsilateral ventral root bursts during chemically elicited fictive locomotion (Fig. 7B). Moreover, the frequency of these sawtooth-like calcium peaks increased at higher transmitter concentrations at which fictive locomotion had ceased (Fig. 7C); note that the two ectopically labeled cells recorded simultaneously were not coordinated in their firing. As a population, few ectopically labeled cells were significantly rhythmic during chemically stimulated (3 of 27) or electrically stimulated (6 of 27) fictive locomotion (Fig. 7D), and the onset times of these few rhythmically active cells were typically in the first quadrant, after onset of ipsilateral ventral root activity. These results show that ectopically labeled cells (GFP+/LacZ−) have heterogeneous activity patterns; a minority are rhythmically active in phase with fictive locomotion, whereas the majority are silent or show rhythmic activity that is unrelated to fictive locomotion.
Figure 7.
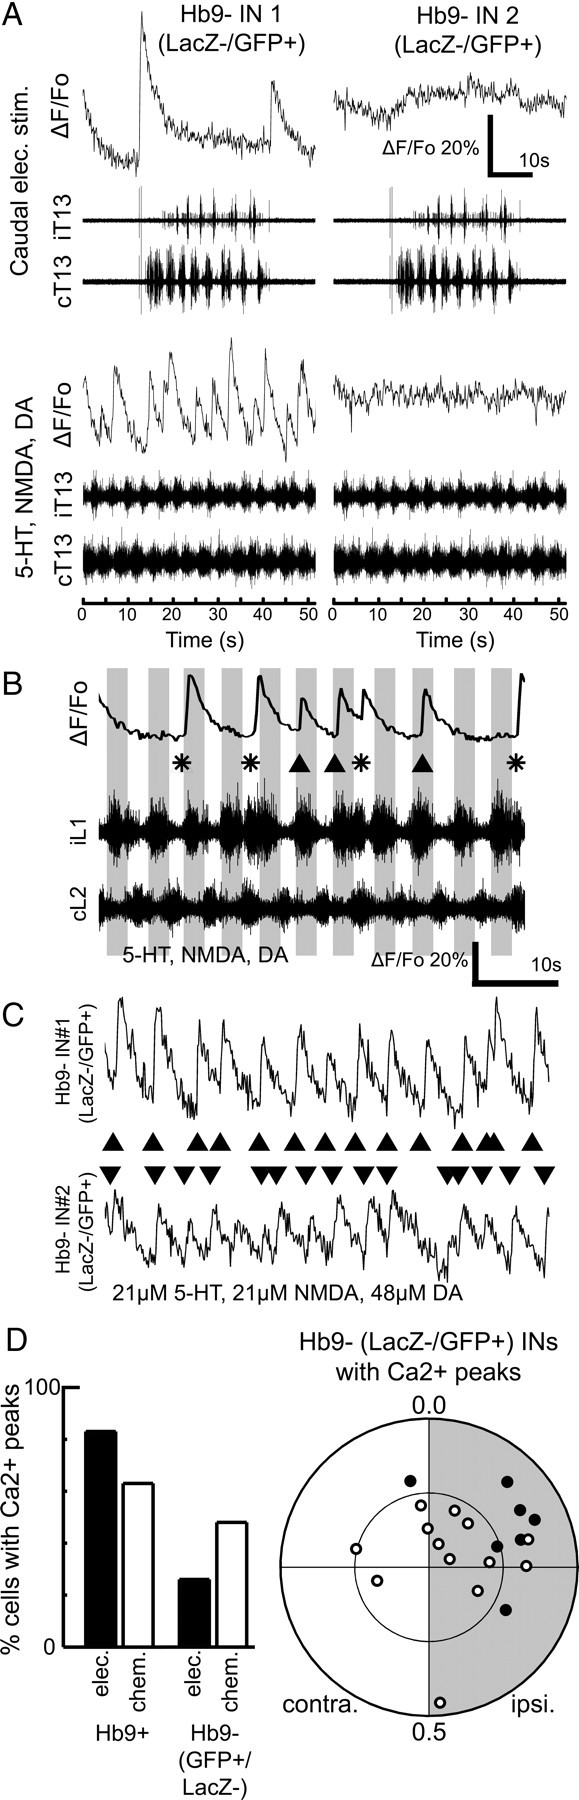
Heterogeneous types of calcium transients observed in ectopically labeled (Hb9−, GFP+/LacZ−) cells. A, Representative fluorescence traces of calcium transients seen in two types of ectopically labeled cells. Approximately half of the ectopically labeled cells showed large sawtooth-like calcium peaks during fictive locomotion, especially during fictive locomotion evoked by bath application of transmitters. The remaining half of the ectopically labeled cells were silent in all conditions tested. B, Magnified view shows that the sawtooth-like calcium peak onsets were not rhythmically coordinated to the phases of fictive locomotion (triangles if in phase with ipsilateral root activity, asterisks if out of phase). C, At higher transmitter concentrations, the frequency of occurrences of sawtooth-like calcium peak increased. Two ectopically labeled cells within the same imaging field of view showed calcium transients with distinctly different onset timing. D, Compared with Hb9+ interneurons, fewer ectopically labeled cells responded to electrical and/or chemical stimulations with calcium peaks. Population circular plot displaying only the responsive cells shows that most of them, including the ones exhibiting sawtooth-like calcium peaks, were not rhythmically active during chemical stimulation. contra., Contralateral; ipsi., ipsilateral.
Discussion
We used two-photon calcium imaging and electrophysiological recording to investigate the timing of onset of spiking activity in Hb9 INs during fictive locomotion in neonatal mouse spinal cords. Our data suggest that Hb9 INs are likely to be components of the spinal locomotor CPG, but, because their onset of spiking activity lags behind that of the ipsilateral ventral root activity, Hb9 INs are not likely to provide the major intrasegmental rhythmic drive for the motor pattern.
McCrea and colleagues (Lafreniere-Roula and McCrea, 2005; Rybak et al., 2006a,b; McCrea and Rybak, 2008) analyzed spontaneous motor deletions during fictive locomotion and argue for a two-layer model of the CPG, wherein a kernel of neurons forms the rhythm-generating network that in turn drives interneurons in a pattern-generating network to organize locomotion. The structure of such a rhythm-generating kernel is unknown, but, based on invertebrate networks, it could arise from a combination of network interactions and the intrinsic properties of the component neurons. These interactions could vary from one extreme, in which a network of non-oscillatory neurons generates a rhythm by mutual excitation and fatigue, to the other extreme, in which the neurons possess endogenous pacemaking oscillatory properties (Marder and Bucher, 2001; Feldman and Del Negro, 2006; Brownstone and Wilson, 2008). Finding cell types in the spinal cord with properties appropriate for a role in one model will provide evidence as to which model is correct.
The Hb9 INs have elicited significant interest since their first electrophysiological characterizations (Hinckley et al., 2005; Wilson et al., 2005). They are rhythmically active during transmitter-evoked fictive locomotion in the isolated hemicord (Hinckley et al., 2005) and show TTX-resistant oscillations in the presence of the same transmitters (Wilson et al. 2005; Ziskind-Conhaim et al., 2008b). This raised the possibility that these neurons are conditional oscillators that may play a central role in the rhythm-generating kernel of the CPG (Brownstone and Wilson, 2008; Ziskind-Conhaim et al., 2008b).
In an insightful review, Brownstone and Wilson (2008) laid out a set of criteria that would define a neuron as a component of the rhythm-generating kernel of the spinal locomotor CPG. For example, they must be positioned ventromedially in the region in which the CPG has been located by lesion and imaging studies; they must receive appropriate sensory and descending synaptic inputs that can affect the rhythm; and they must be excitatory and have properties (synaptic or intrinsic) that support rhythm generation. Finally, they must be rhythmically active during fictive locomotion, and future cellular knock-out studies must show that they are necessary for the network to function. The Hb9 INs meet many of these predictions.
We propose three additional criteria to characterize a class of interneurons that plays a central role in the segmental CPG rhythm-generating kernel. First, because the rhythm-generating kernel drives the pattern-generating network and indirectly the motoneurons in each segment, members of the rhythm-generating network should start firing before the motoneurons of that segment at the onset of a bout of fictive locomotion, and their onset phase should lead that of the motoneurons during each cycle of a locomotor bout. Second, the neurons should remain active throughout a bout of fictive locomotion, providing continuous drive for the rhythm. A third and weaker prediction is specific to the Hb9 INs: because there are so few of them in each spinal segment (∼40 per lumbar segment near L1) (Fig. 1), each neuron should be active in every or nearly every cycle, to provide sufficient drive to the pattern-generating networks of the CPG.
We have tested these three criteria using calcium imaging and electrophysiological recordings. In the in vitro isolated whole spinal cord preparation, we initiated repeated bouts of fictive locomotion by electrical stimulation of the caudal spinal cord and recorded the timing of onset of Hb9 activity relative to the ipsilateral ventral root in the same or adjacent segment. In the overwhelming majority of measurements, the first detectable rise of the Hb9 calcium peak lagged behind the onset of ipsilateral ventral root burst activity by an amount that could not be explained by the slow frame rate of the calcium measurements (Fig. 4). Thus, initial activity in the Hb9 INs does not precede the first motoneuron bursts in their segment, making it impossible for them to initiate motoneuron activity. This alone does not disqualify the Hb9 INs: it is possible that the unpatterned synaptic input from caudal spinal cord stimulation excites many neurons, and the motoneurons simply start firing first. However, then we would expect that, in subsequent cycles of the motor bout, the normal CPG network would take charge of rhythm generation, and the Hb9 INs would begin to lead the motoneurons, providing the rhythmic drive demanded of the rhythm-generating network. However, this is not so. With electrically evoked bouts of locomotor activity, the onset of Hb9 IN activity continued to lag behind the ipsilateral ventral root bursts throughout the bout. Both in the intact spinal cord (with calcium imaging) and in the hemicord (with whole-cell recording), we found that, during transmitter-evoked fictive locomotion, the Hb9 INs almost always started to fire later in each cycle than the ipsilateral ventral roots. Thus, the timing of onset of Hb9 activity is not appropriate for them to provide the major intrasegmental rhythmic drive to initiate the next cycle of motoneuron activity.
The Hb9 INs also fail the second criterion, requiring continued activity during a locomotor episode. With electrically stimulated locomotor activity, we found that the Hb9 INs were most active during the first few cycles but rapidly reduced their activity or fell silent, so that virtually none of them were active in the final cycles of the bout (Fig. 6). Despite this, the strength and rhythmicity of the motoneuron bursts was not significantly decreased in the later cycles of a bout. It is hard to imagine a crucial component of the rhythm-generating kernel of the CPG acting in this way.
The third criterion is a weaker one: based on the relative paucity of Hb9 INs in the spinal cord, it seems reasonable that they should be active on each or nearly each cycle of the locomotor rhythm, to provide sufficient drive to the pattern-forming network. Again, this is not seen, during either electrically evoked fictive locomotion, in which the Hb9 INs rapidly decrease their activity, or transmitter-evoked fictive locomotion, in which an Hb9 IN on average only fires a calcium peak on ∼67% of the cycles. It is possible that only a small minority of Hb9 INs need be active at any time, but, if so, they would have to evoke very strong synaptic drive to their follower cells. The same paucity argument also suggests that it is unlikely that the small fraction (3 of 25) of Hb9+ interneurons observed with a mean onset phase preceding ipsilateral motor activity form a subpopulation that has a pacemaker role; given that there are only ∼40 Hb9 INs per spinal segment, this would require that four to five neurons would drive the locomotor pattern.
Although these new criteria appear to rule out a role for the Hb9 INs as the major pacemaking neurons in the segmental rhythm-generating kernel of the CPG, nonetheless, they might still contribute to the rhythm-generating component of the CPG. For example, the Hb9 INs might still participate in rhythm generation as part of a distributed network of mutually exciting interneurons. After another phase-leading interneuron initiated the next motor burst, the Hb9 INs could be “holding” timing information before handing the excitation off to another class of cells, before the excitation finally returns to the phase-leading cells, although other classes of neurons would have to share this task because Hb9 IN activity does not last throughout a bout of fictive locomotion.
An alternative role for the Hb9 INs could be in coordination between spinal segments; they may be part of the pacemaker network driving motoneuron activity in more caudal segments. We have not tested this directly, but it would require that the Hb9 INs begin to fire before onset of the caudal motoneuron pools. Bonnot et al. (2002) detected rostrocaudal waves of motoneuron activation in mouse spinal cord during fictive locomotion evoked by cauda equina stimulation, with a delay of ∼28–50 ms per segment throughout the lumbar cord. The delay from L1 to L5 would thus be ∼150–250 ms. This is considerably less than the mean delay from onset of the intrasegmental ipsilateral motoneurons to Hb9 onset during caudal cord stimulation (930 ms). Thus, it does not appear that the Hb9 INs are the pacemakers for motoneurons in more caudal segments. However, additional work will be required to test this directly.
Even if they are not major components of the rhythm-generating network, their significantly rhythmic activity with a highly uniform phase during fictive locomotion suggests that the Hb9 INs are active components of the locomotor CPG. One possibility is that they could act as amplifiers: once the motoneurons begin a burst, Hb9 and other cells active in the first half of the burst could further (directly or indirectly) excite the motoneurons and help push the burst to its peak intensity. Alternatively, because the Hb9 INs are more active early than late in a bout of electrically evoked locomotion, they may have some function in establishing a bout of locomotion rather than sustaining it. Of course, their uniform phase may reflect Hb9 INs being electrically coupled to, or receiving simultaneous inputs from, a group of presynaptic partners involved in locomotion, without Hb9 INs being required for locomotion at all. Finally, we note that studies of fictive locomotion in neonatal mice, which are not yet capable of walking, must be read with the caveat that cellular and network activity may change with increasing age. The field eagerly awaits a method of silencing Hb9 IN activity without affecting motoneuron activity, so the necessity of Hb9 INs for fictive locomotion can be directly tested.
Footnotes
This work was supported by the Nanobiotechnology Center, a Science and Technology Center Program of the National Science Foundation under Agreement ECS-9876771 (W.W.W.), National Institutes of Health Grant 9-P41-EB001976 (W.W.W.), and the Christopher and Dana Reeve Foundation (R.M.H.-W.). We thank Matthew Abbinanti, Nathan Cramer, and Guisheng Zhong for valuable discussion, as well as Robert Brownstone and Bruce Johnson for critical reading of this manuscript.
References
- Arber S, Han B, Mendelsohn M, Smith M, Jessell TM, Sockanathan S. Requirement for the homeobox gene Hb9 in the consolidation of motor neuron identity. Neuron. 1999;23:659–674. doi: 10.1016/s0896-6273(01)80026-x. [DOI] [PubMed] [Google Scholar]
- Berkowitz A, Stein PSG. Activity of descending propriospinal axons in the turtle hindlimb enlargement during two forms of fictive scratching: phase analyses. J Neurosci. 1994;14:5105–5119. doi: 10.1523/JNEUROSCI.14-08-05105.1994. [DOI] [PMC free article] [PubMed] [Google Scholar]
- Bonnot A, Whelan PJ, Mentis GZ, O'Donovan MJ. Spatiotemporal pattern of motoneuron activation in the rostral lumbar and the sacral segments during locomotor-like activity in the neonatal mouse spinal cord. J Neurosci. 2002;22:RC203, 1–6. doi: 10.1523/JNEUROSCI.22-03-j0001.2002. [DOI] [PMC free article] [PubMed] [Google Scholar]
- Bonnot A, Mentis GZ, Skoch J, O'Donovan MJ. Electroporation loading of calcium-sensitive dyes into the CNS. J Neurophysiol. 2005;93:1793–1808. doi: 10.1152/jn.00923.2004. [DOI] [PubMed] [Google Scholar]
- Brownstone RM, Wilson JM. Strategies for delineating spinal locomotor rhythm-generating networks and the possible role of Hb9 interneurons in rhythmogenesis. Brain Res Rev. 2008;57:64–76. doi: 10.1016/j.brainresrev.2007.06.025. [DOI] [PMC free article] [PubMed] [Google Scholar]
- Cuellar CA, Tapia JA, Juárez V, Quevedo J, Linares P, Martínez L, Manjarrez E. Propagation of sinusoidal electrical waves along the spinal cord during a fictive motor task. J Neurosci. 2009;29:798–810. doi: 10.1523/JNEUROSCI.3408-08.2009. [DOI] [PMC free article] [PubMed] [Google Scholar]
- Denk W, Strickler JH, Webb WW. Two-photon laser scanning fluorescence microscopy. Science. 1990;248:73–76. doi: 10.1126/science.2321027. [DOI] [PubMed] [Google Scholar]
- Feldman JL, Del Negro CA. Looking for inspiration: new perspective on respiratory rhythm. Nat Rev Neurosci. 2006;7:232–242. doi: 10.1038/nrn1871. [DOI] [PMC free article] [PubMed] [Google Scholar]
- Fetcho JR, Higashijima S, McLean DL. Zebrafish and motor control over the last decade. Brain Res Rev. 2008;57:86–93. doi: 10.1016/j.brainresrev.2007.06.018. [DOI] [PMC free article] [PubMed] [Google Scholar]
- Garaschuk O, Milos RI, Konnerth A. Targeted bulk-loading of fluorescent indicators for two-photon brain imaging in vivo. Nat Protoc. 2006;1:380–386. doi: 10.1038/nprot.2006.58. [DOI] [PubMed] [Google Scholar]
- Gordon IT, Whelan PJ. Monoaminergic control of cauda-equina-evoked locomotion in the neonatal mouse spinal cord. J Neurophysiol. 2006;96:3122–3129. doi: 10.1152/jn.00606.2006. [DOI] [PubMed] [Google Scholar]
- Grillner S. The motor infrastructure: from ion channels to neuronal networks. Nat Rev Neurosci. 2003;4:573–586. doi: 10.1038/nrn1137. [DOI] [PubMed] [Google Scholar]
- Han P, Nakanishi ST, Tran MA, Whelan PJ. Dopaminergic modulation of spinal neuronal excitability. J Neurosci. 2007;27:13192–13204. doi: 10.1523/JNEUROSCI.1279-07.2007. [DOI] [PMC free article] [PubMed] [Google Scholar]
- Hinckley CA, Ziskind-Conhaim L. Electrical coupling between locomotor-related excitatory interneurons in the mammalian spinal cord. J Neurosci. 2006;26:8477–8483. doi: 10.1523/JNEUROSCI.0395-06.2006. [DOI] [PMC free article] [PubMed] [Google Scholar]
- Hinckley CA, Hartley R, Wu L, Todd A, Ziskind-Conhaim L. Locomotor-like rhythms in a genetically distinct cluster of interneurons in the mammalian spinal cord. J Neurophysiol. 2005;93:1439–1449. doi: 10.1152/jn.00647.2004. [DOI] [PubMed] [Google Scholar]
- Jiang Z, Rempel J, Li J, Sawchuk MA, Carlin KP, Brownstone RM. Development of L-type calcium channels and a nifedipine-sensitive motor activity in the postnatal mouse spinal cord. Eur J Neurosci. 1999;11:3481–3487. doi: 10.1046/j.1460-9568.1999.00765.x. [DOI] [PubMed] [Google Scholar]
- Kerr JN, Greenberg D, Helmchen F. Imaging input and output of neocortical networks in vivo. Proc Natl Acad Sci U S A. 2005;102:14063–14068. doi: 10.1073/pnas.0506029102. [DOI] [PMC free article] [PubMed] [Google Scholar]
- Kiehn O. Locomotor circuits in the mammalian spinal cord. Annu Rev Neurosci. 2006;29:279–306. doi: 10.1146/annurev.neuro.29.051605.112910. [DOI] [PubMed] [Google Scholar]
- Kjaerulff O, Kiehn O. Distribution of networks generating and coordinating locomotor activity in the neonatal rat spinal cord in vitro: a lesion study. J Neurosci. 1996;16:5777–5794. doi: 10.1523/JNEUROSCI.16-18-05777.1996. [DOI] [PMC free article] [PubMed] [Google Scholar]
- Kudo N, Yamada T. N-methyl-d,l-aspartate-induced locomotor activity in a spinal cord-hindlimb muscle preparation of the newborn rat studied in vitro. Neurosci Lett. 1987;75:43–48. doi: 10.1016/0304-3940(87)90072-3. [DOI] [PubMed] [Google Scholar]
- Lafreniere-Roula M, McCrea DA. Deletions of rhythmic motoneuron activity during fictive locomotion and scratch provide clues to the organization of the mammalian central pattern generator. J Neurophysiol. 2005;94:1120–1132. doi: 10.1152/jn.00216.2005. [DOI] [PubMed] [Google Scholar]
- Lev-Tov A, Delvolvé I, Kremer E. Sacrocaudal afferents induce rhythmic efferent bursting in isolated spinal cords of neonatal rats. J Neurophysiol. 2000;83:888–894. doi: 10.1152/jn.2000.83.2.888. [DOI] [PubMed] [Google Scholar]
- Marder E, Bucher D. Central pattern generators and the control of rhythmic movements. Curr Biol. 2001;11:R986–R996. doi: 10.1016/s0960-9822(01)00581-4. [DOI] [PubMed] [Google Scholar]
- Marder E, Bucher D. Understanding circuit dynamics using the stomatogastric nervous system of lobsters and crabs. Annu Rev Physiol. 2007;69:291–316. doi: 10.1146/annurev.physiol.69.031905.161516. [DOI] [PubMed] [Google Scholar]
- Markram H, Helm PJ, Sakmann B. Dendritic calcium transients evoked by single back-propagating action potentials in rat neocortical pyramidal neurons. J Physiol. 1995;485:1–20. doi: 10.1113/jphysiol.1995.sp020708. [DOI] [PMC free article] [PubMed] [Google Scholar]
- McCrea DA, Rybak IA. Organization of mammalian locomotor rhythm and pattern generation. Brian Res Rev. 2008;57:134–146. doi: 10.1016/j.brainresrev.2007.08.006. [DOI] [PMC free article] [PubMed] [Google Scholar]
- Roberts A, Soffe SR, Wolf ES, Yoshida M, Zhao FY. Central circuits controlling locomotion in young frog tadpoles. Ann N Y Acad Sci. 1998;860:19–34. doi: 10.1111/j.1749-6632.1998.tb09036.x. [DOI] [PubMed] [Google Scholar]
- Rybak IA, Shevtsova NA, Lafreniere-Roula M, McCrea DA. Modelling spinal circuitry involved in locomotor pattern generation: insights from deletions during fictive locomotion. J Physiol. 2006a;577:617–639. doi: 10.1113/jphysiol.2006.118703. [DOI] [PMC free article] [PubMed] [Google Scholar]
- Rybak IA, Stecina K, Shevtsova NA, McCrea DA. Modelling spinal circuitry involved in locomotor pattern generation: insights from the effects of afferent stimulation. J Physiol. 2006b;577:641–658. doi: 10.1113/jphysiol.2006.118711. [DOI] [PMC free article] [PubMed] [Google Scholar]
- Sato TR, Gray NW, Mainen ZF, Svoboda K. The functional microarchitecture of the mouse barrel cortex. PLoS Biol. 2007;5:e189. doi: 10.1371/journal.pbio.0050189. [DOI] [PMC free article] [PubMed] [Google Scholar]
- Sillar KT, Reith CA, McDearmid JR. Development and aminergic neuromodulation of a spinal locomotor network controlling swimming in Xenopus larvae. Ann N Y Acad Sci. 1998;860:318–332. doi: 10.1111/j.1749-6632.1998.tb09059.x. [DOI] [PubMed] [Google Scholar]
- Stosiek C, Garaschuk O, Holthoff K, Konnerth A. In vivo two-photon calcium imaging of neuronal networks. Proc Natl Acad Sci U S A. 2003;100:7319–7324. doi: 10.1073/pnas.1232232100. [DOI] [PMC free article] [PubMed] [Google Scholar]
- Thaler J, Harrison K, Sharma K, Lettieri K, Kehrl J, Pfaff SL. Active suppression of interneuron programs within developing motor neurons revealed by analysis of homeodomain factor Hb9. Neuron. 1999;23:675–687. doi: 10.1016/s0896-6273(01)80027-1. [DOI] [PubMed] [Google Scholar]
- Whelan P, Bonnot A, O'Donovan MJ. Properties of rhythmic activity generated by the isolated spinal cord of the neonatal mouse. J Neurophysiol. 2000;84:2821–2833. doi: 10.1152/jn.2000.84.6.2821. [DOI] [PubMed] [Google Scholar]
- Wichterle H, Lieberam I, Porter JA, Jessell TM. Directed differentiation of embryonic stem cells into motor neurons. Cell. 2002;110:385–397. doi: 10.1016/s0092-8674(02)00835-8. [DOI] [PubMed] [Google Scholar]
- Wilson JM, Hartley R, Maxwell DJ, Todd AJ, Lieberam I, Kaltschmidt JA, Yoshida Y, Jessell TM, Brownstone RM. Conditional rhythmicity of ventral spinal interneurons defined by expression of the Hb9 homeodomain protein. J Neurosci. 2005;25:5710–5719. doi: 10.1523/JNEUROSCI.0274-05.2005. [DOI] [PMC free article] [PubMed] [Google Scholar]
- Wilson JM, Cowan AI, Brownstone RM. Heterogeneous electrotonic coupling and synchronization of rhythmic bursting activity in mouse Hb9 interneurons. J Neurophysiol. 2007a;98:2370–2381. doi: 10.1152/jn.00338.2007. [DOI] [PubMed] [Google Scholar]
- Wilson JM, Dombeck DA, Díaz-Ríos M, Harris-Warrick RM, Brownstone RM. Two-photon calcium imaging of network activity in XFP-expressing neurons in the mouse. J Neurophysiol. 2007b;97:3118–3125. doi: 10.1152/jn.01207.2006. [DOI] [PubMed] [Google Scholar]
- Wilson JM, Cowan AI, Brownstone RM. Hb9 interneurons: reply to Ziskind-Conhaim and Hinckley. J Neurophysiol. 2008;99:1047–1049. [Google Scholar]
- Zar JH. Biostatistical analysis. Ed 3. Upper Saddle River, NJ: Prentice Hall; 1996. [Google Scholar]
- Zhong G, Masino MA, Harris-Warrick RM. Persistent sodium currents participate in fictive locomotion generation in neonatal mouse spinal cord. J Neurosci. 2007;27:4507–4518. doi: 10.1523/JNEUROSCI.0124-07.2007. [DOI] [PMC free article] [PubMed] [Google Scholar]
- Zipfel WR, Williams RM, Webb WW. Nonlinear magic: multiphoton microscopy in the biosciences. Nat Biotechnol. 2003;21:1369–1377. doi: 10.1038/nbt899. [DOI] [PubMed] [Google Scholar]
- Ziskind-Conhaim L, Hinckley CA. Hb9 versus type 2 interneurons. J Neurophysiol. 2008a;99:1044–1046. doi: 10.1152/jn.01163.2007. author reply 1047–1049. [DOI] [PubMed] [Google Scholar]
- Ziskind-Conhaim L, Wu L, Wiesner EP. Persistent sodium current contributes to induced voltage oscillations in locomotor-related Hb9 interneurons in the mouse spinal cord. J Neurophysiol. 2008b;100:2254–2264. doi: 10.1152/jn.90437.2008. [DOI] [PMC free article] [PubMed] [Google Scholar]