

Abstract
Objectives
Granulosa cell tumors (GCTs) comprise 2–5% of ovarian tumors. Serum Müllerian Inhibiting Substance (MIS, also known as anti-Müllerian Hormone, or AMH) levels have been validated as a marker of GCT recurrence and progression. There has been little correlation between serum MIS/AMH levels several clinical parameters in GCTs, including tumor burden. We have performed a retrospective review correlating aggregate tumor mass as reported by pathologic examination or by radiology with serum MIS/AMH levels drawn on the date of examination.
Methods
We retrospectively identified 32 GCT patients at our institution over the last 15 years who had serum MIS/AMH measurements. Patients who had serum MIS/AMH measurements within three days of surgery or on the same day as abdominal computerized tomography scan (CT) or magnetic resonance imaging (MRI) were further evaluated.
Results
We found a significant direct correlation between patient serum MIS/AMH levels and gross aggregate tumor mass determined by pathology (slope=15.4±6.06, r=0.65, p<0.04) or by radiographic aggregate tumor mass for all data points identified (slope=0.07±0.03, r=0.33, p<0.04) and after correcting for selection bias (slope=1.45±0.17, r=0.93, p<0.01). We also identified a significant difference between serum MIS/AMH levels between samples drawn the same day as negative and positive abdominal CT or MRI scans (8.16±1.54 vs. 158.7±32.2 ng/ml, p<0.0001).
Conclusions
These data indicate a significant direct correlation between serum MIS/AMH levels and both gross and radiographic aggregate tumor mass in GCT patients. Together with the current literature, the present data argues for a more prominent role for serum MIS/AMH in the management of GCTs.
Introduction
Granulosa cell tumors (GCT) of the ovary are uncommon tumors derived from the granulosa cells. They comprise 2–5% of all ovarian cancers [1]. Of the two types of GCTs, the adult type is the more common form, with the juvenile type representing only 5% of all GCTs [1]. Initial therapy consists of surgery with or without postoperative chemoradiation. Though initial therapy is oftentimes successful, adult GCT is an indolent disease with median time to relapse estimated at 4 to 6 years after diagnosis [1]. For this reason, GCT patients often require long-term follow-up and surveillance.
Müllerian Inhibiting Substance (MIS, also known as anti- Müllerian hormone, AMH) is a transforming growth factor-beta family member which is responsible for regression of the Müllerian ducts during embryonic development [2]. MIS/AMH has since been shown to have important functional roles in the post-natal life of both sexes [2,3]. Utilizing the MIS/AMH enzyme-linked immunosorbent assay (ELISA) we [4] and others [5–8] have established normative serum MIS/AMH levels for both sexes from infancy to adulthood. In females, MIS/AMH levels are undetectable before puberty after which levels rise to a baseline range of 2–5 ng/ml for the duration of premenopausal adult life [2]. Reports describe undetectable to minimal variation to serum MIS/AMH levels with the menstrual cycle in premenopausal women [3,9]. After menopause, serum MIS/AMH levels return to undetectable levels [7]. In males, serum MIS/AMH is detectable throughout life [4].
Since the initial report of elevated MIS/AMH levels in GCT patients [10], serum MIS/AMH levels have been validated as a marker of disease recurrence, progression and treatment efficacy in adult-type GCTs [7,11,12]. To date, however, there has been little correlation in GCT patients between serum MIS/AMH levels several clinical parameters, including total tumor burden. To this end, we have performed a retrospective review correlating gross aggregate tumor mass as reported by pathologic examination and radiographic aggregate tumor mass as reported by radiology with serum MIS/AMH levels drawn near or on the date of examination.
Materials and Methods
Data Collection
Institutional Review Board approval was obtained. A retrospective review of records at the Massachusetts General Hospital was performed which identified 32 patients with a diagnosis of GCT over the last 15 years who have been treated at our institution and also had serum MIS/AMH measurements. Patients who had serum MIS/AMH determinations within 3 days before surgery and patients who had serum MIS/AMH determinations on same day as either an abdominal computerized tomography (CT) scan or magnetic resonance imaging (MRI) (including those performed for follow-up) were identified for further analysis. External referrals who had either their surgery or chemotherapy at another institution were excluded.
Gross aggregate tumor mass was calculated from pathology reports by multiplying the reported dimensions in millimeters of each mass and summing the values of those patients with multiple nodules. Patient CT or MRI reports were reviewed and radiographic aggregate tumor mass was calculated by multiplying the dimensions for each nodule reported by the radiologist and summing the values of multiple nodules. Serum MIS/AMH levels were determined by ELISA as described in Hudson et al, 1990 [4].
Statistical Analysis
All statistical analysis was performed using Graph Pad 5 software. A p-value of <0.05 was used for determining correlation by a significantly non-zero linear regression slope as well as a comparison of serum MIS/AMH level means using an unpaired two-tailed t-test.
Results
Serum MIS/AMH levels correlate with gross aggregate tumor mass
To explore a possible correlation between serum MIS/AMH levels and aggregate GCT tumor burden, an analysis of aggregate GCT tumor mass as reported by pathologic examination in relation to serum MIS/AMH levels was performed. From the total of 32 patients with the diagnosis of adult GCT and serum MIS/AMH determinations, 11 separate patients were identified who had serum MIS/AMH measurements within 3 days before surgery. The remaining patients had MIS/AMH measurements too far removed from the date of surgery. The patient ages at the time of surgery ranged from 31 to 70 years with a mean of 52.1 years and the reported aggregate tumor mass ranged from 11.7 to 1575 mm3, with a mean of 392.6 mm3. Specimen-matched serum MIS/AMH values ranged from 2.0 to 60.0 ng/ml with a mean value of 24.9 ng/ml. Linear regression analysis of these patients showed that there was a significant direct correlation between gross aggregate tumor mass as reported by pathology and serum MIS/AMH levels (slope=15.4±6.06, r=0.65, p<0.04, Fig. 1).
Figure 1. Serum MIS/AMH measurements correlate with gross aggregate tumor mass.

Linear regression analysis shows significant direct correlation between patient serum MIS/AMH levels in ng/ml drawn within 3 days before surgery and gross aggregate tumor mass in mm3 as determined by pathology examination of surgical specimens. Each data point represents a separate patient. The dotted lines indicate 95% confidence bands. (slope=15.4±6.06, r=0.65, p<0.04).
Serum MIS/AMH levels correlates with radiographic aggregate tumor mass
To explore further the relationship between GCT tumor burden and serum MIS/AMH levels, analysis of tumor burden was expanded to include radiologic estimates of aggregate tumor mass. A total of 43 serum MIS/AMH measurements performed the same day as abdominal CT or MRI were identified among 13 separate follow-up patients. The age of the patients at the time of examination ranged from 35 to 87 years of age with a mean of 51.6 years and the aggregate tumor mass ranged from 0 to 193 mm3, with a mean of 34.4 mm3. Radiology-matched serum MIS/AMH levels ranged from 0 to 1200 with a mean of 115.4. Analysis of the 43 serum MIS/AMH measurements with radiographic aggregate tumor mass showed a significant direct correlation between these two measurements (slope=0.07±0.03, r=0.33, p<0.04, Fig. 2A).
Figure 2. Serum MIS/AMH measurements correlates with radiographic aggregate tumor mass.
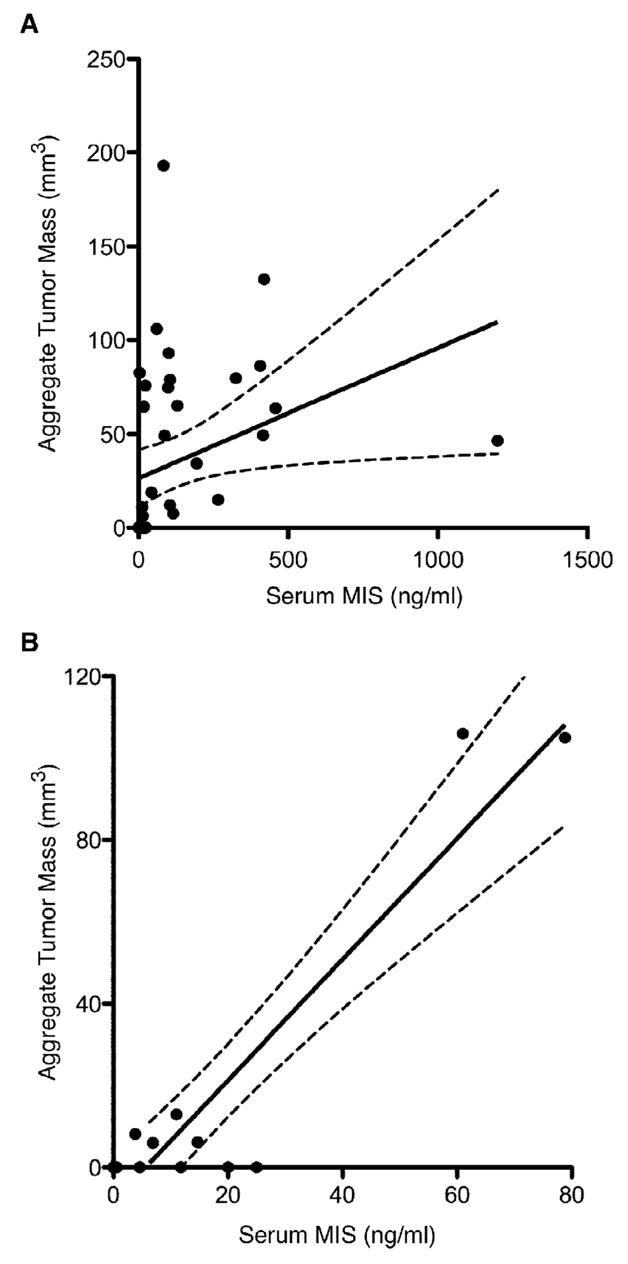
(A) Linear regression analysis shows significant direct correlation between patient serum MIS/AMH levels in ng/ml drawn the day of radiographic study and radiographic aggregate tumor mass. The 43 data points includes measurements from 13 patients during the course of follow-up. The dotted lines indicates 95% confidence bands. (slope=0.07±0.03, r=0.33, p<0.04). (B) To reduce selection bias, the single smallest tumor size estimation by radiology for each patient was correlated with serum MIS/AMH levels drawn the same day. Linear regression analysis of this subset also shows significant correlation. Each data point represents a separate patient. The dotted lines indicate 95% confidence bands. (slope=1.45±0.17, r=0.93, p<0.01).
The most conservative approach to analyze the data showing serum MIS/AMH correlates with radiographic tumor mass is to examine the levels associated with the smallest radiographic aggregate tumor mass for each patient. Linear regression analysis of this subset of data points again showed that there was a significant correlation between serum MIS/AMH levels and radiographic aggregate tumor mass (slope=1.45±0.17, r=0.93, p<0.01, Fig. 2B).
Additionally, analysis was performed to correlate serum MIS/AMH levels to the radiographic presence of disease. Serum MIS/AMH levels drawn the day of abdominal CT or MRI studies that reported no detectable disease were compared to levels drawn the day of radiographic studies that reported the presence of disease (as evidenced by a visible mass). The average of 19 serum MIS/AMH levels drawn the day of negative radiographic studies was 8.16±1.54 ng/ml with a range of 0 to 25.0 as compared to an average serum MIS/AMH of 158.7±32.2 ng/ml with a range of 3.6 to 458.0 for the 22 levels drawn when radiology reported the presence of a mass (p=0.0001, Fig 3).
Figure 3. Serum MIS/AMH measurements correlates with radiographically detectable GCT mass.
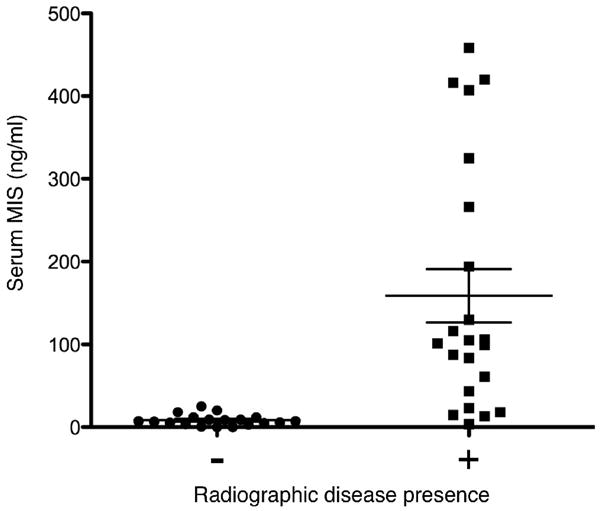
A comparison of serum MIS/AMH levels in ng/ml drawn the day of radiology studies that reported no detectable masses (n=19) to levels drawn the day of radiology studies that reported a detectable mass (n=22) in follow-up GCT patients showed that levels were significantly lower at times when a mass was detected by either abdominal CT or MRI (8.16±1.54 vs. 158.7±32.2 ng/ml, p<0.0001). Error bars represent standard error of the mean.
Discussion
Our data suggests that there is a direct correlation between the serum MIS/AMH levels of GCT patients and the aggregate tumor mass as measured by pathologic examination of surgical specimens or radiographic examination. While it has been previously established that MIS/AMH is a robust marker of tumor recurrence and treatment efficacy in patient surveillance more sensitive than serum inhibin levels and more specific than estradiol levels [7,10,11], these data show, for the first time, a significant correlation between aggregate tumor mass and serum MIS/AMH levels both in pathological specimens and, importantly, determined non-invasively by abdominal CT or MRI. Furthermore, the data also showed a dramatic difference in serum MIS/AMH levels in those patients with radiographically detectable disease when compared to those this negative radiology during follow-up.
There was no statistically significant difference in either patient ages at the time of procedure (51.2 vs. 52.6 years, p=0.93) or serum MIS/AMH levels (24.9 vs. 115.4 ng/ml, p=0.18) between the pathology specimens and radiology reports, respectively. We did notice that the average reported tumor size was larger in the pathology specimens than in the radiographic measurements (392.6 vs. 34.4 mm3, p<0.005). We attribute this difference to the fact that most of the surgical specimens were produced during initial mass resection, while most of the radiographic examinations were performed during follow-up as surveillance after initial resection or chemotherapy. As a result, radiographically surveyed masses were not allowed to grow as large as the initial masses before additional therapy was performed.
Though a correlation between tumor size and serum MIS/AMH levels may be intuitive given that granulosa cells are the source of MIS/AMH in the adult female [13,14], there is evidence to suggest otherwise. A recent report presented evidence that there was an inverse correlation between tumor size and tumor tissue MIS/AMH expression as detected by immunohistochemistry [15], though corresponding serum levels were not reported in these cases. Additionally, while the study addressed the size of the a single tumor, the present study accounts for total tumor burden rather than the individual largest mass. Together with the current data supporting the use of MIS/AMH in following GCT patients (reviewed in La Marca and Volpe 2007, Ref. 3), the present data would argue for a more prominent role for serum MIS/AMH measurements in the clinical management of GCTs. To facilitate its use in subsequent surveillance, we strongly recommend establishing a serum MIS/AMH baseline at the time of diagnosis of GCT, including obtaining serum samples in the operating room. Serum MIS/AMH assays are readily commercially available.
Although the study is retrospective, subject to the variability of pathologic and radiographic reports, and reflective of small numbers, these correlation data do strongly indicate a significant direct relationship between total tumor mass and serum levels of MIS/AMH. As it is apparent that further work, ideally multi-center and prospective, is needed to clarify definitively the relationship between serum MIS/AMH levels and important clinical parameters such as tumor burden, stage at diagnosis, duration of disease, likelihood of recurrence, and prognosis. The present findings would serve well as the ground work for these future studies.
Acknowledgments
Acknowledgements and Funding
The authors would like to thank Dr. Patricia K. Donahoe for her intellectual input and critical reading of this manuscript. HLC was supported by NIH/MGH T32 in Cancer Biology T32CA071345-11. DTM was supported by NIH CA17393-30, The Ovarian Cancer Research Fund, the McBride Family Fund. and the Commons Development Group, Inc.
Footnotes
Article Précis
We show a significant direct correlation between serum MIS/AMH levels and gross and radiographic aggregate tumor mass in GCT patients.
Conflict of Interest
DTM has a royalty license from DSL-Beckman, a provider of MIS/AMH assay kits. No kits were used in the context of this study.
Publisher's Disclaimer: This is a PDF file of an unedited manuscript that has been accepted for publication. As a service to our customers we are providing this early version of the manuscript. The manuscript will undergo copyediting, typesetting, and review of the resulting proof before it is published in its final citable form. Please note that during the production process errors may be discovered which could affect the content, and all legal disclaimers that apply to the journal pertain.
References
- 1.Schumer ST, Cannistra SA. Granulosa cell tumor of the ovary. J Clin Oncol. 2003;21:1180–9. doi: 10.1200/JCO.2003.10.019. [DOI] [PubMed] [Google Scholar]
- 2.Teixeira J, Maheswaran S, Donahoe PK. Müllerian inhibiting substance: an instructive developmental hormone with diagnostic and possible therapeutic applications. Endocr Rev. 2001;22:657–74. doi: 10.1210/edrv.22.5.0445. [DOI] [PubMed] [Google Scholar]
- 3.La Marca A, Volpe A. The Anti-Müllerian hormone and ovarian cancer. Hum Reprod Update. 2007;13:265–73. doi: 10.1093/humupd/dml060. [DOI] [PubMed] [Google Scholar]
- 4.Hudson PL, Dougas I, Donahoe PK, Cate RL, Epstein J, Pepinsky RB, MacLaughlin DT. An immunoassay to detect human Müllerian inhibiting substance in males and females during normal development. J Clin Endocrinol Metab. 1990;70:16–22. doi: 10.1210/jcem-70-1-16. [DOI] [PubMed] [Google Scholar]
- 5.Josso N, Legeai L, Forest MG, Chaussain JL, Brauner R. An enzyme linked immunoassay for anti-Müllerian hormone: a new tool for the evaluation of testicular function in infants and children. J Clin Endocrinol Metab. 1990;70:23–27. doi: 10.1210/jcem-70-1-23. [DOI] [PubMed] [Google Scholar]
- 6.Baker ML, Metcalfe SA, Hutson JM. Serum levels of Müllerian inhibiting substance in boys from birth to 18 years, as determine by enzyme immunoassay. J Clin Endocrinol Metab. 1990;70:11–15. doi: 10.1210/jcem-70-1-11. [DOI] [PubMed] [Google Scholar]
- 7.Rey RA, Lhommé C, Marcillac I, Lahlou N, Duvillard P, Josso N, Bidart JM. Antimüllerian hormone as a serum marker of granulosa cell tumors of the ovary: comparative study with serum alpha-inhibin and estradiol. Am J Obstet Gynecol. 1996;174:958–965. doi: 10.1016/s0002-9378(96)70333-2. [DOI] [PubMed] [Google Scholar]
- 8.Lee MM, Donahoe PK, Hasegawa T, Silverman B, Crist GB, Best S, Hasegawa Y, Noto RA, Schoenfeld D, MacLaughlin DT. Müllerian inhibiting substance in humans: normal levels from infancy to adulthood. J Clin Endocrinol Metab. 1996;81:571–576. doi: 10.1210/jcem.81.2.8636269. [DOI] [PubMed] [Google Scholar]
- 9.Cook CL, Siow Y, Taylor S, Fallat ME. Serum müllerian-inhibiting substance levels during normal menstrual cycles. Fertil Steril. 2000;73:759–861. doi: 10.1016/s0015-0282(99)00639-1. [DOI] [PubMed] [Google Scholar]
- 10.Gustafson ML, Lee MM, Scully RE, Moncure AC, Hirakawa T, Goodman A, Muntz HG, Donahoe PK, MacLaughlin DT, Fuller AF. Müllerian inhibiting substance as a marker for ovarian sex-cord tumor. N Engl J Med. 1992;326:466–471. doi: 10.1056/NEJM199202133260707. [DOI] [PubMed] [Google Scholar]
- 11.Lane AH, Lee MM, Fuller AF, Kehas DJ, Donahoe PK, MacLaughlin DT. Diagnostic utility of Müllerian inhibiting substance determination in patients with primary and recurrent granulosa cell tumors. Gynecol Oncol. 1999;73:51–55. doi: 10.1006/gyno.1998.5290. [DOI] [PubMed] [Google Scholar]
- 12.Rey R, Sabourin JC, Venara M, Long WQ, Jaubert F, Zeller WP, Duvillard P, Chemes H, Bidart JM. Anti-Müllerian hormone is a specific marker of sertoli- and granulosa- cell origin in gonadal tumors. Hum Pathol. 2000;31:1202–1208. doi: 10.1053/hupa.2000.18498. [DOI] [PubMed] [Google Scholar]
- 13.Vigier B, Picard JY, Tran D, Legeai L, Josso N. Production of anti-Müllerian hormone: another homology between Sertoli and granulosa cells. Endocrinology. 1984;114:1315–1320. doi: 10.1210/endo-114-4-1315. [DOI] [PubMed] [Google Scholar]
- 14.Takahashi M, Hayashi M, Manganaro TF, Donahoe PK. The ontogeny of Müllerian inhibiting substance in granulosa cells of the bovine ovarian follicle. Biol Reprod. 1986;35:447–453. doi: 10.1095/biolreprod35.2.447. [DOI] [PubMed] [Google Scholar]
- 15.Anttonen M, Unkila-Kallio L, Leminen A, Butzow R, Heikinheimo M. High GATA-4 expression associates with aggressive behavior, whereas low anti-Müllerian hormone expression associates with growth potential of ovarian granulosa cell tumors. J Clin Endocrinol Metab. 2005;90:6529–6535. doi: 10.1210/jc.2005-0921. [DOI] [PubMed] [Google Scholar]