Abstract
Ligand binding to transport sites constitutes the initial step in the catalytic cycle of transport ATPases. Here, we consider the well characterized Ca2+ ATPase of sarcoplasmic reticulum (SERCA) and describe a series of Ca2+ binding isotherms obtained by equilibrium measurements in the presence of various H+ and Mg2+ concentrations. We subject the isotherms to statistical mechanics analysis, using a model based on a minimal number of mechanistic steps. The analysis allows satisfactory fits and yields information on occupancy of the specific Ca2+ sites under various conditions. It also provides a fundamental method for analysis of binding specificity to transport sites under equilibrium conditions that lead to tightly coupled catalytic activation.
Keywords: Ca2+ ATPase, Ca2+ binding, H+/Ca2+ exchange, Statistical analysis
Ligand binding to transport sites constitutes the initial step in the catalytic cycle of transport ATPases. The characteristics of this binding are of utmost importance, as they determine catalytic activation, specificity and stoichiometry of transport and countertransport, and efficiency of ATP utilization. They also correspond to structural features of the enzyme protein with regard to binding affinity and specificity, as well as conformational consequences of binding resulting in catalytic activation. We provide here a detailed analysis of Ca2+ binding to the Ca2+ transport ATPase of sarco-endoplasmic reticulum (SERCA) [1,2]. The SERCA isoform of skeletal muscle is a well characterized enzyme [3,4] that utilizes the free energy of ATP for Ca2+ transport against a concentration gradient. The functional unit is a protein monomer comprising 994 amino acid residues. The sequence is folded into a cluster of 10 segments forming a transmembrane region, and three relatively large domains (“N”, “P” and “A”) protruding from the cytosolic surface of the membrane [5,6]. The ATPase cycle begins with high affinity binding of Ca2+ derived from the cytosolic medium (“outside”), followed by ATP utilization to form a phosphorylated enzyme intermediate. Isomerization of the phosphoenzyme intermediate is then coupled to active transport of the bound Ca2+ across the membrane (“inside”). Hydrolytic cleavage of the phosphoenzyme is the final step that allows enzyme turnover. The high Ca2+ affinity state of the enzyme is generally referred to as E1, and the low affinity as E2.
Equilibrium isotherms, obtained in the absence of ATP, demonstrate that the initial enzyme activation is produced by binding of two calcium ions to the activation/transport sites of one ATPase molecule [7]. Binding is pH dependent [8,9] and occurs with high affinity and positive cooperativity. The two Ca2+ binding sites reside within the membrane bound region of the ATPase [10-12]. Ca2+ complexation at the first site is achieved with oxygen atoms derived from Asn768, Glu771, Thr799, Asp800, Glu908 and two water molecules. Complexation at the second site is achieved with oxygen atoms derived from Asn796, Asp800 and Glu309, resulting in an EF hand motif with specific characteristics of other calcium binding proteins.
It has been shown that Ca2+ binding occurs in exchange with H+ [13,14], and the stoichiometry of exchange is dependent on medium pH [15]. Ca2+/H+ exchange is of interest both for the involvement of carboxylic amino acid chains in Ca2+ binding at the start of the ATPase cycle, and for the subsequent release of bound Ca2+ following ATP utilization and enzyme turnover [16,17]. It has also been reported that Mg2+, which is an absolute requirement at the catalytic site for utilization of ATP, can also bind competitively to the Ca2+ sites under certain conditions [9]. We recently observed that Mg2+, at high pH and in the absence of Ca2+, confers to the ATPase conformational features (E1 state) similar to those produced by Ca2+ binding, but without catalytic activation [18]. We report here new measurements of Ca2+ binding to the ATPase activation/transport sites of the SERCA protein, and its dependence on H+ and Mg2+. These measurements were specifically tailored to allow statistical mechanics analysis of Ca2+ binding isotherms in the presence of various H+ and Mg2+ concentrations, thereby providing a fundamental method for analysis of binding specificity to transport proteins.
Methods
Ca2+ binding and ATPase measurements
Vesicular fragments of sarcoplasmic reticulum membrane were obtained from rabbit hind leg muscle as previously described [19]. SERCA accounts for 50–60% of total protein in this preparation. Total protein was determined by the Folin method, standardized with serum albumin.
Calcium binding was measured under equilibrium conditions by molecular sieve chromatography [7,20]. Columns (1.5 × 30.0 cm) filled with BioGel P-30 (50–100 mesh) were equilibrated with a medium containing 50 mM MOPS, pH 7 (or MES, pH 6, or Hepes, pH 8), 80 mM KCl, 40μM (45Ca) CaCl2, various concentrations of EGTA to yield the desired free Ca2+ concentration, and 0, 1 and 10 mM MgCl2. Estimates of free Ca2+ were obtained by computations based on Ca·EGTA binding constants [21], pH, Mg2+ and K+ concentrations. The sarcoplasmic reticulum (SR)1 sample was prepared by diluting 5 mg of SR stock in 5 ml of elution medium, centrifuging down the vesicles, and resuspending the sediment in 1 ml of elution medium. The concentrated sample was placed on top of the column, and chromatography allowed to proceed at a rate of approximately 0.4 ml per minute. Fractional samples were then collected for determination of protein and (45Ca)Ca.
ATPase activity was measured at 25 °C in a reaction mixture containing 30 μg SR protein/ml, 50 mM MOPS, pH 7 (or MES pH 6, or Hepes, pH 8), 50 mM KCl, 5μM CaCl2, 1 μM A23187 (calcium ionophore to obtain stable rates) and various concentrations of MgCl2. The reaction was started by the addition of 1 mM ATP, and serial samples collected for colorimetric determination of Pi.
Proposed statistical mechanics analysis
We base our analysis on a model for the equilibrium calcium binding to SERCA as a function of free Ca2+, Mg2+ and H+ ions in the solution and in the absence of ATP. In the absence of ATP, a SERCA molecule is assumed to competitively bind Ca2+, H+ or Mg2+ from the cytoplasmic side of the membrane, and exists as the following species at thermal equilibrium. E is the unoccupied species with no Ca2+, Mg2+ or H+ bound to the enzyme. A SERCA molecule is assumed to sequentially bind four protons and the four protonated species are EH+, EH+H+, E3H+ and E4H+. A SERCA molecule is also assumed to sequentially bind two calcium ions at the first and second sites. ECa2+ is the singly occupied species with one bound Ca2+ at the first site, and ECa2+ Ca2+ is the doubly occupied species with two bound Ca2+ at the first and second sites. The model assumes that the enzyme binds only one Mg2+ and the magnesium related species are the following. EMg2+ is the species with one bound magnesium ion. EH+Mg2+ and EMg2+H+ are the two species with one bound proton and one bound magnesium ion. To keep the parameters to a minimum, we assume these two species are energetically identical, and will refer to either of them as EH+Mg2+ in the ensuing discussion. EH+H+Mg2+, EMg2+H+H+ and EH+Mg2+H+ are the three species associated with one bound magnesium ion and two bound protons. These three species are also assumed to be energetically indistinguishable, and any of these three will be referred as EH+H+Mg2+ in the following discussion. The justification for the above proposed SERCA species is provided in the calculated results section where the proposed model is compared with experimental results.
We now discuss the energies associated with the proposed SERCA species. The energy of an unoccupied species (E) is set as the reference and the energies of all other species are measured with respect to it. εCa is the energy for converting an unoccupied E species into a singly occupied ECa2+ species with one bound calcium ion at the first site. ε2Ca is the energy for converting an unoccupied E species into a doubly occupied ECa2+Ca2+ species with two bound calcium ions at the first and second sites. εH is the energy for converting an unoccupied E species into a singly protonated EH+ species with one bound proton. To keep the fitting parameters to a minimum, we assume that for each additional bound proton, the energy increases by the same amount (εH + δ). Hence (2εH + δ), (3εH +2δ) and (4εH +3δ) are the energies for converting an unoccupied species into a doubly EH+H+, triply E3H+ and E4H+ protonated species, respectively. εMg is the energy for converting an unoccupied E species into an EMg2+ species with one bound Mg2+. εHMg is the energy for converting an unoccupied E species into an EH+Mg2+ species with one bound H+ and one bound Mg2+. εHHMg is the conversion energy for a species with two bound H+ and one bound Mg2+. Using the above discussed energies of the proposed SERCA species, the concentrations of various species can be calculated as discussed below.
The principles of statistical physics are applied to calculate the equilibrium concentrations of the proposed SERCA species as a function of free Ca2+, H+ and Mg2+ concentrations in the solution. The partition function (ZS) describing the SERCA molecule can be written as a function of temperature (T), calcium chemical potential (μ), hydrogen chemical potential (μH) and magnesium chemical potential (μMg):
| (1) |
Using Eq. (1) for the partition function describing a SERCA molecule, the concentrations of the proposed SERCA species at thermal equilibrium can be written as:
| (2) |
| (3) |
| (4) |
| (5) |
| (6) |
| (7) |
| (8) |
| (9) |
| (10) |
| (11) |
where NS is the total concentration of SERCA molecules.
In order to compare the calculated results with calcium binding isotherm measurements, we need to express the chemical potentials μ, μH and μMg as a function of free Ca2+, H+ and Mg2+ concentrations in solution. At thermal equilibrium, the Ca2+ bound to SERCA and free Ca2+ in solution have a common chemical potential μ. Since the total number of SERCA molecules in the membrane is significantly smaller than the number of free Ca2+ in solution, the Ca2+ concentration in solution is assumed to remain unchanged when the solution is brought in contact with SERCA molecules. For the case of low free Ca2+ concentration (≲10 mM), μ can be written as [22]: μ ≈ kT·ln([Ca2+]/[Nw]), where [Ca2+] is the free Ca2+ concentration in solution and [Nw] = 55.5 M is the concentration of water (solvent) molecules. Similarly, the chemical potentials μ and μMg for H+ and Mg2+ can be expressed as μH≈λkT·ln([H+]/[Nw]) and μMg≈λkT·ln([Mg+]/[Nw]), where [H+] and [Mg2+] are the free hydrogen and magnesium concentrations in solution, respectively. Substituting μ, μH and μMg into Eqs. (1)-(11), the equilibrium concentrations of various SERCA species can be calculated.
Since the measured Ca2+ binding isotherms for SERCA are normalized with respect to the maximum saturating values, for comparison the calculated results also need to be expressed as normalized Ca2+ binding curves. In the present model, the bound Ca2+ concentration would reach its maximum saturating value of 2NS when all the SERCA molecules are doubly occupied by calcium ions. Hence, the normalized bound Ca2+ concentration (θ) can be written as a function of free [Ca2+] concentration in solution:
| (12) |
where ZS is given by Eq. (2) with μ = kT·ln([Ca2+]/[Nw]), μH = kT·ln([H+]/[Nw]), μH = kT·ln([Mg2+]/[Nw]) and [Nw] = 55.5 M. In the following discussion, model Eq. (12) is used for calculating the equilibrium Ca2+ binding isotherms as a function of pH and free [Mg2+] in the solution with εCa, ε2Ca, εH, δ, εMg, εHMg and εHHMg is fitting parameters.
EC50 is an important parameter describing the calcium binding isotherm: EC50 is defined as the free [Ca2+] in solution at which the measured bound calcium concentration is half of its maximum value. An equation for EC50 can be derived by substituting θ = 0.5 and [Ca2+] = EC50 into the model Eq. (12):
| (13) |
| (13A) |
| (13B) |
The above equation for EC50 will also be used for verifying the model, in particular analyzing the measured dependence of EC50 on pH and free [Mg2+] in the solution and thereby providing justification for the proposed SERCA species.
Experimental Results
Binding and ATPase measurements
Measurement of Ca2+ binding to SERCA in the absence of ATP presents considerable difficulty, due to the high affinity of Ca2+ binding and the limited buffering capacity of chelating compounds (such as EGTA) to maintain a given concentration of free Ca2+. The difficulty is greater at alkaline pH, as the affinity of SERCA approximates or exceeds that of EGTA. Nevertheless, we found that equilibration in molecular sieve chromatography columns [7] presents unique advantages. In this method, acquisition of Ca2+ from the equilibration medium and exchange of radioactive isotopic tracer, occur as the SR vesicles move down the column into fresh medium, while the exposed medium is delayed by the molecular sieve chromatography column. Therefore, the peak of protein eluting with the void volume (Fig. 1) contains the bound calcium determined by the equilibrium constant, in the presence of medium containing the free Ca2+ concentration exactly as determined by experimental design and the buffer equilibrium constant. In fact, the consequence of the initial Ca2+ acquisition from the medium and isotope exchange is revealed by a trough and a small peak at the end of the elution volume. A flat baseline between the peak and the trough (Fig. 1) insures complete equilibration. The method then presents a twofold Ca2+ buffer: one provided by the initial equilibration with the Ca·EGTA complex, and the other derived from the progress of the Ca·SERCA through fresh medium.
Fig. 1.
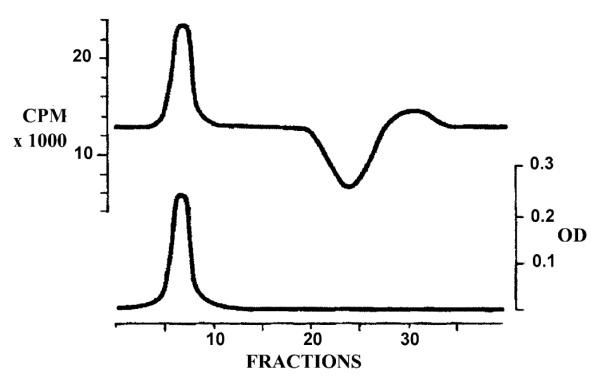
Elution of radioactive calcium (upper) and sarcoplasmic reticulum protein (lower) from a size exclusion chromatography column for determination of calcium binding.
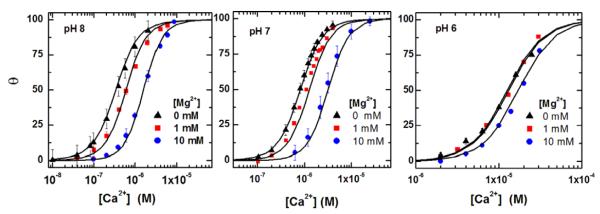
We used this method to obtain equilibrium Ca2+ binding isotherms at pH 6, 7 and 8, in the presence of 0, 1 and 10 mM Mg2+. As it was unambiguously demonstrated by previous binding measurements [7] and crystallographic analysis [11] that SERCA binds two Ca2+ per mole, we refer to this value as 100% saturation, and show in Fig. 2 the binding isotherms obtained with our present measurements. It is clear that the Ca2+ binding affinity increases as the pH is raised, and is reduced by Mg2+ especially at high pH. All isotherms present positive cooperativity, indicating that binding of the second Ca2+ is dependent on binding of the first Ca2+. Fitting the experimental data points by the Hill equation yields the values listed in Table 1.
Fig. 2.
Dependence of calcium binding isotherms on pH and free magnesium ion concentration in the solution; each isotherm curve is normalized by the maximal bound Ca2+ concentration at saturating values of free Ca2+ concentration in the solution. θ denotes normalized bound calcium concentration and [Ca2+] denotes the free calcium ion concentration in the solution. Symbols are measurements made at thermal equilibrium conditions in the absence of ATP and at room temperature. Each measured isotherm curve is also fitted to the Hill equation and corresponding fitting parameters EC50 and Hill slope are listed in Table 1. Solid lines are model fits using Eq. (12) with fitting parameters listed in Table 2.
Table 1.
EC50 and Hill slope are the two fitting parameters of the Hill equation; these values are obtained by fitting the Hill equation to each measured isotherm curve in Fig. 2
| [Mg2+] (mM) |
||||
|---|---|---|---|---|
| 0 mM | 1 mM | 10 mM | ||
| pH 8 | EC50(M) | 3.3 × 10⁻⁷ | 6.2 × 10⁻⁷ | 1.6 × 10⁻⁶ |
| Hill slope | 1.48 | 1.52 | 1.50 | |
| pH 7 | EC50(M) | 8.0 × 10⁻⁷ | 1.1 × 10⁻⁶ | 2.9 × 10⁻⁶ |
| Hill slope | 1.60 | 1.51 | 1.71 | |
| pH 6 | EC50(M) | 1.11 × 10⁻⁵ | 1.3 × 10⁻⁵ | 1.8 × 10⁻⁵ |
| Hill slope | 1.74 | 1.74 | 1.70 | |
A question raised in previous studies is whether the reduction of Ca2+ binding by Mg2+ at high pH is due simply to Ca2+ replacement by Mg2+ at the specific ATPase activation sites, and/or additional Mg2+ binding to non-specific sites. We therefore made a series of measurements of ATPase activity at alkaline pH, in the presence of 5 μM Ca2+ (saturating the calcium sites even in the presence of 10 mM Mg2+ as shown in Fig. 2) and increasing concentration of Mg2+. It is clear in Fig. 3 that 1 mM Mg2+ (a concentration equivalent to that of ATP) is an absolute requirement for ATPase activity. On the other hand, the ATPase activity is progressively reduced as the Mg2+ concentration is increased from 1 to 10 mM, indicating that Mg2+ at high concentration and high pH inhibits the ATPase by binding to low affinity sites made available by the high pH in the medium. Nevertheless, replacement of Ca2+ by Mg2+ does in fact occur under appropriate conditions, as explained by the calculated results.
Fig. 3.
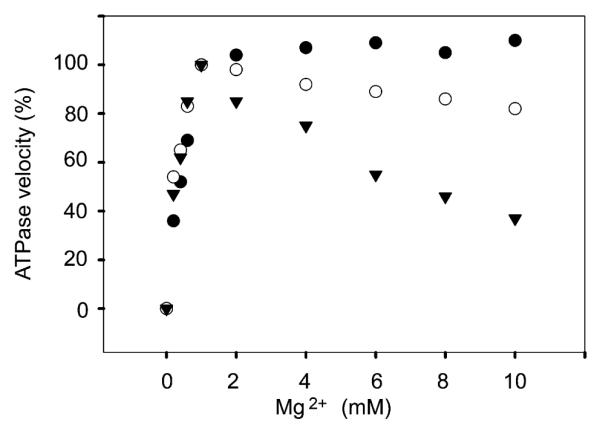
Steady state ATPase activity at various pH and Mg2+ concentrations. ATPase activity was followed by colorimetric measurement of Pi, in the presence of 5 μM Ca2+, 20 mM MES pH 6 (●), or MOPS, pH 7 (○), or Hepes pH 8 (▼), as described in Methods. The Mg2+ concentration was varied as indicated in the figure.
Calculated Results
The calculated results section has three main subsections. In the first two subsections, we compare calculated and measured EC50 and Hill slope values, thereby provide justification for the inclusion of proposed SERCA species and show that the proposed model is the simplest model with fewest fitting parameters. In the last subsection, the calculated and measured isotherms are compared. Also, the calculated concentrations of various SERCA species are discussed to provide further insights into competitive binding of Ca2+, Mg2+ and H+ to SERCA.
Comparison between calculated and measured EC50
As stated in the previous section, EC50 is defined as the free [Ca2+] in solution at which the measured bound calcium concentration is half of its maximum value. We compare the calculated dependence of EC50 on free [H+] and [Mg2+] in solution with the measurements, thus providing justification for the inclusion of the Mg2+ and H+ related proposed SERCA species.
Mg2+ dependence
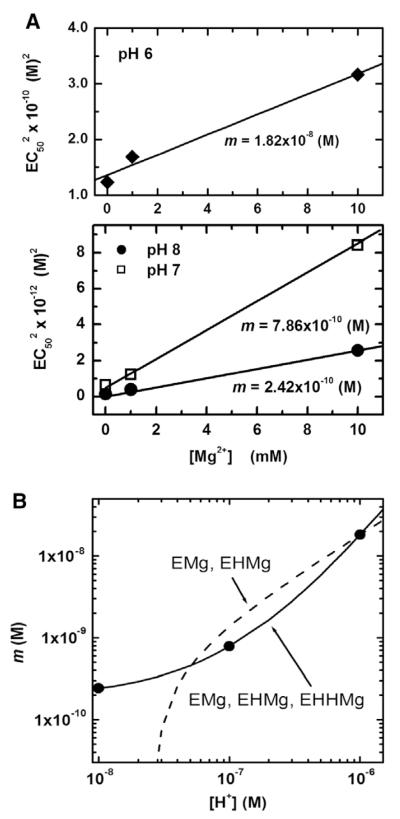
In the proposed model, a SERCA molecule is assumed to bind only one magnesium ion and the magnesium related species are EMg2+, EH+Mg2+ and E2H+Mg2+. This assumption is verified by examining the measured dependence of EC50 on free [Mg2+] at various pH values. The model Eq. (13) predicts that would have a linear dependence on free [Mg2+] with A and m as constants at a fixed pH value:
| (14) |
Fig. 4A shows the dependence of on free [Mg2+] at the pH values of 8, 7, and 6. Symbols are the measured EC50 values obtained by fitting the Hill equation to the measured isotherms shown in Fig. 2; measured EC50 values are also listed in Table 1. The solid lines are linear fits with slope m in accordance with Eq. (14); the estimated values of m are also shown in the figure. As shown in Fig. 4A, the linear fits are in good agreement with the data. This observed linear dependence implies that only one Mg2+ binds to a SERCA molecule, consistent with the model assumption.
Fig. 4.
(A) Dependence of on the free [Mg2+] in the solution at fixed pH values of 6, 7 and 8. Symbols are measured EC50 values as listed in Table 1. Solid lines are linear fits with m and A as fitting parameters, consistent with the model Eq. (14). (B) Dependence of m on the free H+ concentration in the solution. Symbols are m values obtained from Fig. 4(A). Solid line is the proposed model fit (Eq. (13B)) that assumes EMg2+, EH+Mg2+ and E2H+Mg2+ as the three magnesium related SERCA species; dashed line is an alternate model fit that is identical to the proposed model except EMg2+ and EH+Mg2+ are assumed as the two magnesium related species.
We now examine the dependence of the slope m on the pH of the solution, and thereby providing the justification for the proposed three energetically distinguishable magnesium related species: EMg2+, EH+Mg2+ and EH+H+Mg2+. In the proposed model Eq.(13B), m = ao + a1·[H+]+ a2·[H+]2, where, a0, a1 and a2 are positive valued constants associated with the energies of EMg2+, EH+Mg2+ and EH+H+Mg2+ species, respectively. Fig. 4B compares the calculated and measured values of m. The symbols are the measured m values obtained from Fig. 4A, and the solid line is the fit using Eq. (13B) with a0 = 1.95×10⁻¹⁰, a1 = 4.56×10⁻³ and a2 = 3.45×10³. The measured and calculated m values are in good agreement, thereby lending support to the assumption that the three proposed magnesium related SERCA species be included in the model.
Alternate simpler models, identical to the proposed model except involving only one or two magnesium related species are also evaluated. The simplest case is the model with EMg2+ as the only Mg2+ related SERCA species. In this case, the predicted slope m (=a0) would be independent of pH, inconsistent with the measured m values. The next simplest case is the model with EMg2+ and EH+Mg2+ as the Mg2+ related SERCA species. In this case, the model equation for m = a0 + a1·[H+] with ao and a1 positive valued as constants. As in shown Fig. 4B, this linear equation (dashed line) for m does not provide a good fit, and also the fitting parameter a0(=−4.84×10⁻¹⁰) is negatively valued, inconsistent with the model prediction of a0>0. In summary, it is necessary to include at least EMg2+, EH+Mg2+ and EH+H+Mg2+ as the Mg2+ related SERCA species in the proposed model in order to be consistent with the measured dependence of EC50 on free [Mg2+] at various pH values. Additional magnesium related species such as E3H+Mg2+ are not considered since the inclusion of such species would increase the number of fitting parameters.
pH dependence
In the present model, a SERCA molecule is assumed to sequentially bind four protons, thereby giving rise to four protonated states EH+, EH+H+, E3H+ and E4H+. We will examine if this assumption of four proton binding is essential for providing satisfactory fits to the EC50 data. We will also examine alternate models that are identical to the proposed model except they assume sequential binding of 1, 2 or 3 protons.
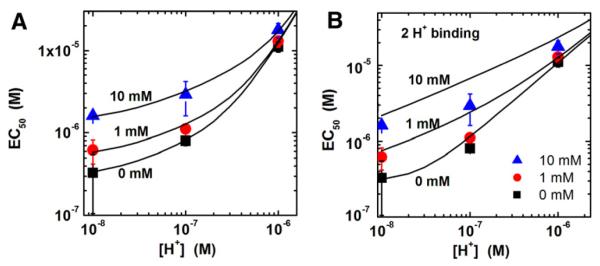
First, we evaluate the proposed model assumption involving sequential binding of four protons by analyzing measured EC50 dependence on the solution pH. Fig. 5A shows the dependence of EC50 on free [H+] in the solution at fixed [Mg2+] values of 0, 1 and 10 mM. Symbols are the measured EC50 values as listed in Table 1 and solid lines are the model fits using Eq. (13) with ε2Ca, εH, δ, εMg, εHMg and εHHMg as fitting parameters. These fitting parameters estimated from the fits are listed in Table 2. As shown in the figure, the fits are in satisfactory agreement with the measured EC50 dependence on pH at various values of free [Mg2+] in the solution. Next, the assumption of sequential binding of three protons instead of four protons is evaluated. In this case, the equation for EC50 is the same as the model Eq. (13) except the last term in Eq.(13A) is omitted. The calculated and measured EC50 values are in satisfactory agreement, similar to the case of 4 proton binding. Hence, these two possibilities involving 4 or 3 proton binding are indistinguishable.
Fig. 5.
Dependence of EC50 on the free [H+] in the solution at fixed [Mg2+] values of 0, 1 and 10 mM. Symbols are measured EC50 values as listed in Table 1. (A) Solid lines are model fits using Eq. (13) with fitting parameters as listed in Table 2. (B) Solid lines are fits using an alternate model that is identical to the proposed model except SERCA is assumed to sequentially bind two protons with EH+ and EH+H+ as the protonated species.
Table 2.
Model parameters obtained by fitting a family of calcium binding isotherm curves measured at various pH and [Mg2+] values
| εH (kcal/mol) | δ (kcal/mol) | εMg (kcal/mol) | εHMg (kcal/mol) | εHHMg (kcal/mol) | ε2Ca (kcal/mol) | εCa (kcal/mol) |
|---|---|---|---|---|---|---|
| −13.26 | 1.84 | −7.13 | −19.76 | −30.21 | −23.15 | −11.35 |
The possibility of sequential binding of two protons to SERCA is also evaluated. In this case, the equation for EC50 is the same as the proposed model Eq. (13) except the last two terms in Eq. (13A) are omitted. As shown in Fig. 5B, the calculated and measured EC50 values are not in satisfactory agreement. Similarly, the possibility of binding of one proton is evaluated and is found to be inconsistent with the pH dependent EC50 data. In summary, the above analysis shows that the binding of 4 or 3 protons provides satisfactory fits to the pH dependent EC50 measurements at various free [Mg2+] in the solution while the binding of 2 or 1 protons does not provide good fits.
Since the possibilities of maximal binding of four versus three protons cannot be distinguished from each other on the basis of the pH dependent EC50 data, experimental results other than isotherm measurements are needed to distinguish between these two possibilities. Tadini et al. [15] performed experiments that measured the net charge transferred from SERCA into the solution when saturating concentrations of free [Ca2+] are added to the solution. The charge transfer measurements were performed at various pH values and 1 mM of free [Mg2+] in the absence of ATP; the results were normalized with the net charge transferred at pH 8. We will first evaluate the possibility of sequential binding of four protons to SERCA. In the proposed model, the equation for normalized net transferred charge can be derived as follows. Before the addition of saturating free [Ca2+] concentrations to the solution, SERCA molecules exist as E, EH+, EH+H+, E3H+, E4H+, EMg2+, EH+Mg2+ and EH+H+Mg2+ species, and the charges on these species are −4q, −3q, −2q, −q, 0, −2q, −1q and 0, respectively; q = 1.6 × 10⁻¹⁹ coulombs. The equilibrium concentrations of these species are given by Eqs. (1), (2), (5)-(11). The charge contribution from each species is the product of the concentration and the respective charge. The total charge on the SERCA molecules free [Ca2+] is added to the solution is the sum of the charge contribution from each species. Once saturating free [Ca2+] is added, all the SERCA molecules convert to doubly occupied ECa2+Ca2+ species with zero net charge. Since the net transferred charge ΔQ is the difference between the total charge on SERCA before and after saturating free [Ca2+] is added, ΔQ can be written as:
| (15) |
where ZS is given by Eq. (1). Since the reported data is normalized by the net charge transferred at pH 8, the normalized net charge transferred ΔQnor can be written as:
| (16) |
where ΔQ is given by Eq. (15) and the ΔQpH 8 value is obtained by substituting [H+] = 10−8 M in Eq. (15). The Eq. (16) for normalized net transferred charge depends on εH, δ, εMg, εHMg and εHHMg parameters, whereas εCa and ε2Ca energies do not contribute because the net transferred charge depends on the total charge on SERCA before the addition of saturating concentration of free calcium to the solution. In Eq. (16), [Mg2+] = 1 mM and [Nw] = 55.5 M. Fig. 6 shows the comparison between calculated and measured dependence of ΔQnor on the solution pH. Symbols are the measured values and the solid line is the fit using the above Eq. (16) with εH, δ, εMg, εHMg and εHHMg as fitting parameters. The fitting values of the parameters are the same (within 5%) as those obtained from the isotherm measurements of Fig. 2 (listed in Table 2). Hence, the proposed model with binding of 4 protons provides good fits to both isotherm and net charge transfer measurements. The possibility of binding 3 protons instead of 4 protons is also evaluated. As shown in Fig. 6, the calculated curve (dashed line) does not provide as good a fit as the option for four proton binding. Hence, the sequential binding of 4 protons is identified as the option that provides a more accurate description of calcium binding measurements to SERCA.
Fig. 6.
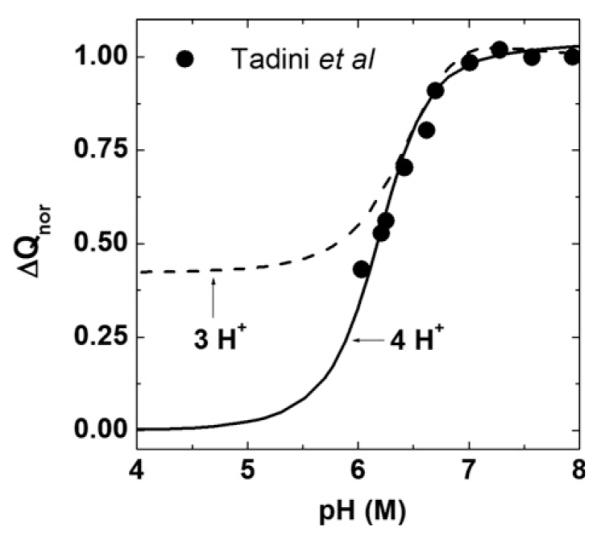
Comparison between the measured and calculated pH dependent normalized net charge transferred from SERCA following addition of saturating free Ca2+ before concentration to the solution. Symbols are measurements from Tadini et al. [15]. Solid line is the proposed model fit using Eq. (15), and dashed line is a fit using an alternate model that is identical to the proposed model except SERCA is assumed to sequentially bind three protons instead of four.
Comparison between calculated and measured Hill slope
In this section, we compare the calculated and measured Hill slope dependence on pH, and thereby provide justification for the inclusion of ECa2+ as the singly occupied calcium species in the proposed model. We also evaluate alternate models that are identical to the present model except the ECa2+ species is replaced by other singly occupied calcium species such as EH+Ca2+, ECa2+H+, and EH+H+Ca2+. The calculations for the proposed and alternate models show that the pH dependence of EC50 at a fixed [Mg2+]is the same for both models. However, the calculations show in the proposed model the Hill slope would increase with decreasing pH with the decrease most significant in the absence of free Mg2+ in the solution. In contrast, the calculated isotherms for the alternate models with one bound calcium ion and one or more bound protons predict that the Hill slope would decrease with decreasing pH values. The measured Hill slope (Table 1) increases with decreasing pH particularly at [Mg2+] = 0 M; this measured dependence is consistent with previous experimental results reported by Forge et al. [9]. Hence, ECa2+ is included in preference over other singly occupied calcium species such as EH+Ca2+, ECa2+H+, EH+H+Ca2+ in the proposed model.
Comparison between calculated and measured isotherms
In this section, the proposed model is applied to the measured Ca2+ binding isotherms shown in Fig. 2. In Fig. 2, the symbols denote measured data and solid lines are fits using Eq. (12) with εCa, ε2Ca, εH, d, εMg, εHMg and εHHMg as fitting parameters. The fitting parameters estimated from the fits are listed in Table 2; these parameter values are the same as those obtained from fits to EC50 data in Fig. 5A. As shown in the figure, the calculated curves are in good agreement with the measured isotherms at various pH and free [Mg2+] values. In summary, the model Eq. (12) provides good fits to a family of Ca2+ binding isotherms measured over a wide range of pH and [Mg2+] values, using fitting parameters that are identified with Ca2+, H+ and Mg2+ binding energies.
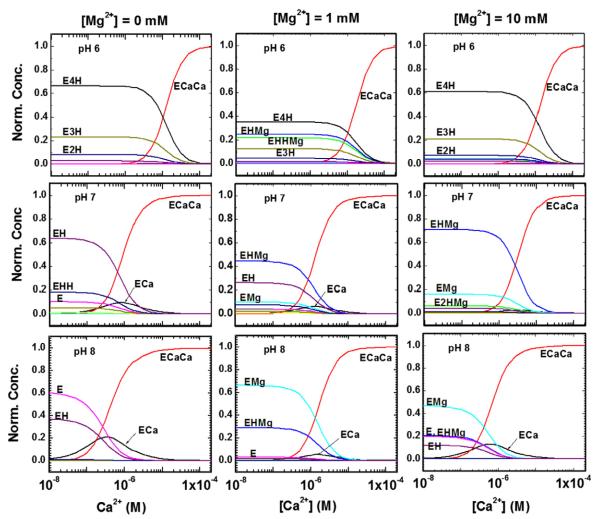
In order to gain further insights into the competitive binding of Ca2+, H+ and Mg2+ to SERCA, the equilibrium concentrations of various SERCA species are calculated using the model parameters listed in Table 2 using Eqs. (1)-(11). Fig. 7 shows the calculated curves of normalized SERCA species concentrations as a function of free [Ca2+] at fixed values of pH and free [Mg2+] in the solution; normalized concentration is defined as the concentration of a SERCA species divided by the total SERCA concentration NS. First, we discuss the calculated results at pH 6 and varying free [Mg2+] concentrations. At [Mg2+] = 0 and 1 mM and at lower free [Ca2+], the dominant SERCA species are E4H+ and E3H+. As the free calcium concentration increases in the solution, these species convert into ECa2+Ca2+ with exchange ratios of 4H2+/2Ca2+ and 3H2+/2Ca2+. When free [Mg2+] is increased to 10 mM, in addition to protonated E4H+ and E3H+ species magnesium related SERCA species (EH+Mg2+ and EH+H+Mg2+) also start to dominate at lower free calcium concentrations. These species convert into ECa2+Ca2+ at higher free calcium concentrations with an exchange process that involves release of both H+ and Mg2+ into the solution upon Ca2+ binding. It is also observed that the concentration of singly occupied ECa2+ species is negligible at all concentrations of free Mg2+ and Ca2+ in the solution at pH 6. Next, we discuss the calculated results at pH 7. In the absence of Mg2+, the dominant SERCA species are E, EH+ and EH+H+ at lower free [Ca2+]. These species converts into E1Ca2+Ca2+ with exchange ratios of 0H+/2Ca2+, H+/2Ca2+ and 2H2+/2Ca2+ at saturating free [Ca2+], respectively. At 1 and 10 mM of [Mg2+], the most dominant species is EH+Mg2+ at lower free calcium ion concentrations in the solution, and this species converts into ECa2+Ca2+ at higher free calcium concentrations with an exchange processes that involve release of both H+ and Mg2+ upon calcium ion binding. Unlike at pH 6, the ECa2+ species concentration is not negligible. The concentration peaks at ~10−6 M of free [Ca2+] and the peak height decreases as free [Mg2+] increases in the solution. Lastly, the calculations show that the trends at pH 8 are similar to those observed at pH 7, except the proton related species are further suppressed.
Fig. 7.
Calculated dependence of various SERCA species concentration on free calcium concentration [Ca2+] at fixed values of pH (6, 7, 8) and free Mg2+ (0, 0.1 and 10 mM) in the solution; the calculated curves are obtained by using Eqs. (1)-(11) and parameter values listed in Table 2.
Discussion
It should first be pointed out that although the enzyme is always referred as E in the calculations, it is expected that its conformation will undergo transitions as protons dissociate and calcium is bound. In fact, continuum electrostatic calculations predict full protonation of the four acidic residues (Glu309, Glu771, Asp800 and Glu908) within the Ca2+ binding sites [23,24] in the E2(TG + BHQ) state, with pK within or near the pH 6–8 range (see also Hauser and Barth [25] for the E2(TG) state, and Fibich et al. [26] for the ATPase in the absence of inhibitors). The presence of protons provides important stabilization of the E2 state by the establishment of hydrogen bonding. In the absence of TG and BHQ, gradual H+ dissociation and destabilization of the E2 state are expected as the pH is raised from 6 to 8 [18,27].
On the other hand, similar calculations predict that the four acid residues participating in Ca2+ binding are all unprotonated in the E1·2Ca2+ state around physiological pH [26]. However, Glu908 may dissociate its H+ only as the pH is raised to 8 [24], while Glu58, which does not participate directly in binding, retains a H+ by interacting with the Glu309 carbonyl oxygen.
The advantage of the statistical mechanics approach is that it allows analysis of Ca2+ binding isotherms obtained experimentally as functions of H+ and Mg2+ concentrations, with reference to catalytic activation that is dependent on Ca2+ occupancy of both sites [28,29]. We find that a model based on possible occupancy of the Ca2+ sites by 4 H+ (in the absence of Ca2+) yields the best fit to the experimental data. This stoichiometry corresponds in fact to the four acidic amino acids [Glu309, Glu771, Asp800, and Glu908] involved in Ca2+ binding. It is shown in Fig. 7 that at pH 6, in the absence of Ca2+ and Mg2+, 70% of the enzyme resides in the E4H state, and 20% in the E3H state. As the pH is raised to 8, dissociation of H+ from the acidic residues is nearly complete. In the presence of Ca2+, occupancy of the two sites by Ca2+ occurs with a pH dependent affinity, yielding finally the ECa-Ca state for nearly 100% of the enzyme. It is of interest that Mg2+, which is required for ATP utilization at the catalytic site, can also bind in place of Ca2+, especially at high Mg2+ (10 mM) and low H+ (pH 8) concentrations. Binding of 1 Mg2+ per enzyme (only Mg2+ bound to the Ca2+ sites is considered) yields optimal fits of the experimental data, suggesting binding to the first site, consistent with the hexahedral character of divalent cation complexation at this site. The EF hand conformation of site II, on the other hand, appears more specific for Ca2+ and is likely to exclude Mg2+. This explains how the enzyme (in the absence of Ca2+) acquires an E1 conformation at high pH and in the presence of Mg2+, without reaching catalytic activation [18].
It is noteworthy that when enzyme turnover occurs in the presence of ATP, Ca2+/H+ exchange occurs as the phosphorylated enzyme dissociates bound Ca2+ on the luminal side of the membrane in exchange for H+. However, exchange of all four H+ for the 2 Ca2+ transported per each ATPase cycle is not expected since the Glu309 side chain orientation makes unlikely its participation in net Ca2+/H+ exchange. Furthermore, it is not clear that Glu908 looses stoichiometrically its H+ upon Ca2+ binding [24]. In fact, upon addition of ATP, steady state Ca2+/H+ exchange has been found to occur with a stoichiometric ratio of two, resulting in electrogenic transport [17].
Acknowledgments
S.Z. will like to thank Kevin Conrad for useful discussions on statistical mechanics and his assistance with calculations. Part of this work was supported by National Heart, Lung, and Blood Institute Grant RO1-HL-69830, and Merit Review Award, Dept of Veterans Affairs.
Footnotes
- SR
- sarcoplasmic reticulum.
References
- [1].Ebashi S, Lipman F. J. Cell Biol. 1962;14:389–400. doi: 10.1083/jcb.14.3.389. [DOI] [PMC free article] [PubMed] [Google Scholar]
- [2].Hasselbach W, Makinose M. Biochem. Z. 1963;339:94–111. [PubMed] [Google Scholar]
- [3].de Meis L, Vianna AL. Annu. Rev. Biochem. 1979;48:275–292. doi: 10.1146/annurev.bi.48.070179.001423. [DOI] [PubMed] [Google Scholar]
- [4].Moller JV, Jull B, le Maire M. BBA. 1996;1286:1–51. doi: 10.1016/0304-4157(95)00017-8. [DOI] [PubMed] [Google Scholar]
- [5].MacLennan DH, Brandl CJ, Korczak B, Green NM. Nature. 1985;316:696–700. doi: 10.1038/316696a0. [DOI] [PubMed] [Google Scholar]
- [6].Toyoshima C, Sasabe H, Stokes DL. Nature. 1993;362:696–700. doi: 10.1038/362469a0. [DOI] [PubMed] [Google Scholar]
- [7].Inesi G, Kurzmack M, Coan C, Lewis DE. J. Biol. Chem. 1980;255(7):3025–3031. [PubMed] [Google Scholar]
- [8].Watanabe T, Lewis D, Nakamoto R, Kurzmack M, Fronticelli C, Inesi G. Biochemistry. 1981;20:6617–6625. doi: 10.1021/bi00526a015. [DOI] [PubMed] [Google Scholar]
- [9].Forge V, Mintz E, Guillain F. J. Biol. Chem. 1993;268(15):10953–10960. [PubMed] [Google Scholar]
- [10].Clarke DM, Loo TW, Inesi G, MacLennan DH. Nature. 1989;339:476–478. doi: 10.1038/339476a0. [DOI] [PubMed] [Google Scholar]
- [11].Toyoshima C, Nakasako M, Nomura H, Ogawa H. Nature. 2000;8:647–655. doi: 10.1038/35015017. [DOI] [PubMed] [Google Scholar]
- [12].Toyoshima C, Inesi G. Ann. Rev. Biochem. 2004;73:269–292. doi: 10.1146/annurev.biochem.73.011303.073700. [DOI] [PubMed] [Google Scholar]
- [13].Chiesi M, Inesi G. Biochemistry. 1980;19(13):2912–2918. doi: 10.1021/bi00554a015. [DOI] [PubMed] [Google Scholar]
- [14].Wakabayashi S, Ogurusu T, Shigekawa M. Biochemistry. 1990;29(47):10613–10620. doi: 10.1021/bi00499a006. [DOI] [PubMed] [Google Scholar]
- [15].Tadini-Buoninsegni F, Bartolommei G, Moncelli MR, Guidelli R, Inesi G. J. Biol. Chem. 2006;281:37720–37727. doi: 10.1074/jbc.M606040200. [DOI] [PubMed] [Google Scholar]
- [16].Levy D, Seigneuret M, Bluzat A, Rigaud JL. J. Biol. Chem. 1990;265(32):19524–19534. [PubMed] [Google Scholar]
- [17].Yu X, Carroll S, Rigaud JL, Inesi G. Biophys. J. 1993;64(4):1232–1242. doi: 10.1016/S0006-3495(93)81489-9. [DOI] [PMC free article] [PubMed] [Google Scholar]
- [18].Inesi G, Lewis D, Toyoshima C, Hirata A, de Meis L. J. Biol. Chem. 2008;283(2):1189–1196. doi: 10.1074/jbc.M707189200. [DOI] [PubMed] [Google Scholar]
- [19].Eletr S, Inesi G. Biochim. Biophys. Acta. 1972;290(1):178–185. doi: 10.1016/0005-2736(72)90062-4. [DOI] [PubMed] [Google Scholar]
- [20].Hummel JP, Dryer WJ. Biochem. Biophys. Acta. 1962;63:530–532. doi: 10.1016/0006-3002(62)90124-5. [DOI] [PubMed] [Google Scholar]
- [21].Schwarzenbach G, Senn H, Anderegg G. Helv. Chim. Acta. 1957;40(6):1886–1900. [Google Scholar]
- [22].Kubo R. Statistical Mechanics. N. Holland Publishing Co.; Amsterdam: 1974. [Google Scholar]
- [23].Sugita Y, Miyashita N, Ikeguchi M, Kidera A, Toyoshima C. J. Am. Chem. Soc. 2005;127:6150–6151. doi: 10.1021/ja0427505. [DOI] [PubMed] [Google Scholar]
- [24].Obara K, Miyashita N, Xu C, Toyoshima I, Sugita Y, Inesi G, Toyoshima C. Proc. Natl. Acad. Sci. USA. 2005;102:14489–14496. doi: 10.1073/pnas.0506222102. [DOI] [PMC free article] [PubMed] [Google Scholar]
- [25].Hauser K, Barth A. Biophys. J. 2007;93(9):3259–3270. doi: 10.1529/biophysj.107.109363. [DOI] [PMC free article] [PubMed] [Google Scholar]
- [26].Fibich A, Janko K, Apell HJ. Biophys. J. 2007;93(9):3092–3104. doi: 10.1529/biophysj.107.110791. [DOI] [PMC free article] [PubMed] [Google Scholar]
- [27].Pick U, Karlish SJD. J. Biol. Chem. 1982;257:6120–6126. [PubMed] [Google Scholar]
- [28].Inesi G, Zhongsen Z, Lewis D. Biophys. J. 2002;83:2327–2332. doi: 10.1016/S0006-3495(02)75247-8. [DOI] [PMC free article] [PubMed] [Google Scholar]
- [29].Strock C, Cavagna M, Peiffer WE, Sumbilla C, Lewis D, Inesi G. J. Biol. Chem. 1998;273:15104–15109. doi: 10.1074/jbc.273.24.15104. [DOI] [PubMed] [Google Scholar]


