Summary
The roles of muscles that span a single joint (monoarticular) versus those that span two (biarticular) or more joints have been suggested to differ. Monoarticular muscles are argued to perform work at a joint, whereas biarticular muscles are argued to transfer energy while resisting moments across adjacent joints. To test these predictions, in vivo patterns of muscle activation, strain, and strain rate were compared using electromyography and sonomicrometry in two major elbow extensors, the long and lateral heads of the triceps brachii of goats (Capra hircus), across a range of speed (1–5 m s–1) and gait. Muscle recordings were synchronized to limb kinematics using high-speed digital video imaging (250 Hz). Measurements obtained from four goats (25–45 kg) showed that the monoarticular lateral head exhibited a stretch-shortening pattern (6.8±0.6% stretch and –10.6±2.7% shortening; mean ± s.e.m. for all speeds and gaits) after being activated, which parallels the flexion–extension pattern of the elbow. By contrast, the biarticular long head shortened through most of stance (–16.4±3.4%), despite elbow flexion in the first half and shoulder extension in the last half of stance. The magnitude of elbow flexion and shoulder extension increased with increasing speed (ANCOVA, P<0.05 and P<0.001), as did the magnitude and rate of active stretch of fascicles in the lateral head (P<0.001 for both). In all individuals, shortening fascicle strain rates increased with speed in the long head (P<0.001), and, in three of the four individuals, strain magnitude increased. Few independent effects of gait were found. In contrast to its expected function, the biarticular long head appears to produce positive work throughout stance, whereas the monoarticular lateral head appears to absorb work at the elbow. The biarticular anatomy of the long head may mitigate increases in muscle strain with speed in this muscle, because strain magnitude in the second phase of stance (when the shoulder extends) decreased with speed (P<0.05).
Keywords: muscle function, biarticular, fascicle strain, electromyography (EMG), Capra hircus, kinematics, triceps
INTRODUCTION
Muscle–tendon units (MTUs) in animal limbs can be categorized as monoarticular if they cross one joint, biarticular if they cross two joints, and multiarticular if they cross three or more joints. Monoarticular muscle tendon units must lengthen or shorten with the flexion or extension of the joint they cross. If monoarticular MTUs contain relatively long tendons, lengthening and shortening may largely occur in series-elastic passive structures allowing muscle fascicles to contract isometrically. For muscles that lack long tendons, such as many proximal limb muscles, lengthening and shortening must be taken up by muscle fascicles. For instance, the vastus lateralis (VL) of many species appears to stretch and shorten with flexion and extension of the knee (e.g. Gillis and Biewener, 2001). For bi- or multiarticular proximal MTUs, flexion or extension at one joint may be offset by motion at adjacent joints, allowing the muscle to contract isometrically (Kaya et al., 2005), and thus more economically (Roberts et al., 1997; Biewener and Roberts, 2000). This enables the MTU to contribute simultaneous moments at both joints (van Igen Schenau, 1990), while providing transfer of energy from one joint to another (Cleland, 1867; Prilutsky and Zatsiorsky, 1994).
The prevalence of the `strut-like' function in the literature (van Igen Schenau, 1990; Jacobs et al., 1993; Gorb and Fischer, 2000; Witte et al., 2002) may overshadow a separate, though not mutually exclusive, role for biarticular muscles in work production through active fascicle shortening. In particular, there may be situations in which anatomical factors suggest an alternative function for shortening and work production. A relatively large, long-fibered condition in a multiarticular muscle may reflect a functional requirement for fascicle shortening and work production, rather than strut-like isometric force production (Payne et al., 2005a; Payne et al., 2005b). Additionally, if a multiarticular muscle is more massive than those proximal to it, it would not make sense for it to transfer energy from smaller muscles without performing work itself.
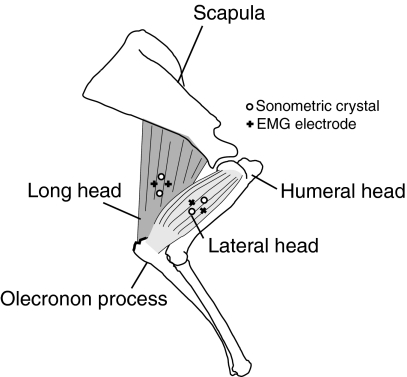
The long head of the triceps brachii (TrLONG) is a flexor at the shoulder joint (i.e. it rotates the humerus caudally in the sagittal plane; Fig. 1). Consequently, it is able to transfer energy from shoulder extension to elbow extension in the manner consistent with the strut-like function described above. However, morphological properties of the TrLONG suggest a role in work production less commonly ascribed to biarticular muscles. First, it is relatively long fibered (Payne et al., 2005b), an architecture associated with work or displacement producing muscles (Lieber, 2002). Second, it is massive relative to other intrinsic and extrinsic forelimb musculature (Payne et al., 2005b; Williams et al., 2008). Although the mechanics of force balance and transmission in the forelimb are quite complex (English, 1978), the combined mass of other muscle directly capable of extending the scapulo-humeral joint (and thus, transferring energy distally through the TrLONG), such as the biceps brachii or supraspinatus, is lower than that of the TrLONG in dogs (Williams et al., 2008) and horses (Payne et al., 2005b). Thus, the architecture and mass of this muscle suggests that it might be expected to shorten and contribute work to locomotion.
Fig. 1.
General anatomy of the long (TrLONG) and lateral (TrLAT) heads of the triceps brachii of the forelimb of goats. Also shown are the approximate locations of sonomicrometric crystals and EMG electrodes used to measure muscle function. See the text for a more detailed description of the anatomy and methods.
Published direct data on TrLONG function are inconsistent. Goslow et al. (Goslow et al., 1981) reported a continuous shortening pattern in the TrLONG throughout stance in dogs, based on limb kinematics. Direct measurements of TrLONG fascicle length change from sonomicrometry in running dogs (Gregersen et al., 1998) show an isometric pattern in the late stages of stance consistent with energy transfer but show brief shortening in early stance when energy transfer would be impossible because the shoulder and elbow are both flexing. By contrast, Witte et al. (Witte et al., 2002) (and references therein) assume an isometric role for the TrLONG in the early phase of stance in small mammals.
We measured aspects of in vivo muscle function including activation, strain, and strain rate in the TrLONG of goats (Capra hircus Linnaeus 1758) to broaden understanding of the functional repertoires of biarticular muscles. The functional role of the TrLONG was also compared with its monoarticular agonist, the lateral head of the triceps (TrLAT; Fig. 1). Based on a previous comparison of both muscles during jumping (Carroll et al., 2008), we predicted that the TrLAT would exhibit a stretch shortening pattern in parallel with the flexion and extension of the elbow, whereas the TrLONG would shorten throughout stance in a pattern similar to that predicted by Goslow et al. (Goslow et al., 1981) for running dogs.
Changes in muscle force, work, and mechanical power associated with changes in speed that are produced by the musculoskeletal system are linked to the energy cost of locomotion (or rate of oxygen uptake; V̇O2) (e.g. Marsh and Ellerby, 2006; Taylor, 1994). Morphological factors that reduce the effects of increased locomotor speed on muscle force and work output can help to reduce the energy cost of increased locomotor speed for the animal and thus may increase sustainable speeds obtainable for a given V̇O2,max. For example, increases in speed in hopping wallabies (Macropus eugenii) occur without concurrent increases in oxygen consumption, in large part, because long leg tendons store and return elastic energy, reducing the increase in muscle strain and work output that would otherwise be required at faster hopping speeds (Biewener et al., 1998). The ability to store and recover elastic energy from tendons allows the distal biarticular and multiarticular wallaby leg muscles to operate under nearly isometric conditions, favoring more economical force generation.
A second goal of the current study, therefore, was to understand how function of the long and lateral heads of the goat triceps varies with locomotor speed. We predicted that increases in locomotor speed would increase the magnitude and rate of stretch in the TrLAT due to increased loading in early stance, given that a similar pattern was found in the monoarticular vastus lateralis (VL) of goats and rats (Gillis et al., 2005; Gillis and Biewener, 2001). We also predicted that the biarticular arrangement of the TrLONG might mitigate changes in strain and strain rate associated with increases in speed, similar to the distal leg muscles of hopping wallabies described above (Biewener et al., 1998) and running turkeys (Roberts et al., 1997). In particular, increases in shoulder extension with speed may offset elbow extension to limit increases in strain and strain rate that would otherwise be required. In general, our hypothesis is that the biarticular arrangement of muscles represents a key morphological feature that contributes to a reduction in the cost of locomotion by reducing the effect of increased locomotor speed on muscle strain and strain rate.
MATERIALS AND METHODS
Animals
Methods and surgical procedures for this study were similar to those described by Carroll et al. (Carroll et al., 2008) and are briefly described here. Four goats (24, 27, 42 and 45 kg) were used in the study. An additional 15 kg goat was used in a separate x-ray cine analysis. Animals were housed outdoors in fields at the Concord Field Station, Bedford, MA, USA, and experiments conducted in accordance with Harvard IACUC guidelines and USDA regulations. Over a period of 2 to 3 weeks goats were trained to walk, trot, and gallop on a treadmill (belt: 2.5 m long and 0.75 m wide). During data collection an effort was made to record similar speeds (usually at 0.5 m s–1 increments) across animals; however, we also sought to elicit the fastest or slowest speed at which an animal would perform a certain gait. Thus, minimum and maximum speeds within a gait differed among some individuals. Values are reported as means ± s.e.m., unless otherwise noted.
Anatomy
The long head (TrLONG) and the lateral head (TrLAT) of the triceps both insert on the olecranon process of the ulna (Fig. 1). A much smaller (<5% mass of combined TrLONG and TrLAT) monoarticular medial head is also present but was not measured. The lateral head originates from the humerus, whereas the long head originates from the distal-most third of the ventro-caudal margin of the scapula. Consequently, the TrLAT is monoarticular and the TrLONG is biarticular. Architecturally, the TrLAT contains parallel fascicles that run the extent of its length (ranging from an average of 6.0±2 cm in a 25 kg goat to 8.0±3 cm, in a 45 kg goat). The TrLONG contains long fascicles of similar length (average: 6.5±3 cm in a 25 kg goat to 8.0±3 cm in a 45 kg goat), but is slightly unipinnate (15±4 deg.).
Surgery
Before surgery, animals were starved for 1 day. Goats were induced for intubation with 8 mg kg–1 ketamine and 0.5 mg kg–1 xylazine administered into the jugular vein. After intubation, goats were maintained in a surgical plane of anesthesia with 2–4% isoflurane by volume, administered via inspired oxygen. Sonomicrometric crystals (2 mm; Sonometrics Inc., London, ON, Canada) and bipolar electromyography (EMG) electrodes were fashioned from twisted strands of 0.102mm enamel-coated silver wire (California Fine Wire Inc., Grover Beach, CA, USA) with a 3–4mm dipole distance (Loeb and Gans, 1986). Care was taken to insert each pair of crystals along the fascicle axis 10–14 mm apart. In the long head, this meant implanting the distal crystal slightly deeper than the proximal because of the muscle's slight fascicle pinnation. EMG electrodes were inserted immediately lateral to those fascicles containing crystals using an 18.5 gauge hypodermic needle and were secured to the fascicles with 4-0 silk suture. The electrode connectors were then sutured to the skin of the neck with sterile 0 surgical wire. Goats were allowed to recover overnight. Data collection took place within 1 to 2 days after surgery. All animals were killed following data collection, with 120 mg kg–1 of commercial pentobarbital solution injected into the jugular vein.
Joint kinematics
The hoof and the skin overlying the metacarpophalangeal, wrist, and shoulder joints, and the scapular spine (at its most proximal palpable extent) were marked with non-toxic white paint. Kinematics were digitally recorded at 250 Hz using a Redlake PCI-500 video system (Redlake, Morgan Hill, CA, USA). Joint locations were digitized using a custom auto-tracking digitization program in MatLab (v. 6.5; The MathWorks, Natick, MA, USA) written by T. L. Hedrick, UNC, Chapel Hill, NC, USA (http://www.unc.edu/~thedrick/software1.html). Digitized data were filtered at 30 Hz with a fourth-order recursive (zero-lag) Butterworth filter, and used to determine hoof position, limb segment position, and elbow and shoulder angles for each sequence. The camera was controlled by an analog trigger, and the voltage signal from this trigger was used to synchronize camera recordings with EMG and sonomicrometry recordings. Shoulder flexion was defined with respect to the caudal (posterior) angle formed between the humerus and scapula in the sagittal plane (Fig. 1).
X-ray video kinematics were captured from a lateral X-ray video, recorded at 125 Hz, of a 15 kg goat walking and trotting on a motorized treadmill (0.7 m×1.20 m) at 0.9 and 2.5 m s–1, respectively. A smaller goat was required for X-ray recordings, in order to fit the scapula, humerus and olecranon on the 30.5 cm diameter fluoroscopic screen for a full stride. Videos were recorded at 125 Hz with a high-speed Photron Fastcam camera (Photron, San Diego, CA, USA) mounted on the fluoroscope of the X-ray C-arm (Model 9400 C-Arms International, Hamburg, PA, USA). Raw video was corrected for fluoroscope distortion using a custom MatLab script available from David Baier (Department of Ecology and Evolution, Brown University; David_Baier@Brown.edu), and digitized as described above, except that the humeral angle had to be estimated from the position of the glenoid surface of the humerus. Position data were filtered with a low-pass filter at 15 Hz. Because the foot could not be seen in the X-ray video, the relative excursion of the elbow joint was used to estimate periods of stance and swing.
EMG
EMG signals were filtered (60 Hz notch and 30–3000 Hz bandpass) and amplified at 1000× with Grass P511 amplifiers (Grass-Telefactor, West Warwick, RI, USA). Outputs from the Grass amplifiers were digitized at 2000 Hz through a 12-bit A/D converter (Digidata 1200B, Axon Instruments, Union City, CA, USA). EMG signals were later digitally filtered (in MatLab) with a custom 100–1000 Hz bandpass fourth-order zero-lag Butterworth filter, prior to analysis.
Muscle strain
Sonomicrometric crystals measure latency of ultrasound transmitted between a pair of crystals to determine instantaneous muscle length. The speed of sound in muscle was estimated to be 1550 m s–1 (Mol and Breddels, 1982). Latency of crystal response was transduced and amplified with a Triton sonomicrometrics system (Model 120-1001; Triton Technology, San Diego, CA, USA) and digitized with the EMG signals at 2000 Hz as described above. Because sound propagation through the epoxy of the Sonometrics™ crystals exceeds that through the muscle, an offset of +0.82 mm was applied to recordings made using the 2.0 mm crystals (Gillis et al., 2005). Owing to its filtering circuitry, there is also a 5 ms delay inherent in the Triton system that was accounted for in subsequent data analysis. Crystal distances were normalized to fascicle resting length measured during quiet stance to estimate fascicle strain.
Data analysis
Between three and seven steady strides were analyzed at each speed depending on the animal's running consistency at each speed. Occasionally no usable strides were available for a given individual at certain speeds (Figs 4, 5, 6 missing data at some speeds) because of unsteady locomotion at that speed or poor signal quality for some strides. Kinematics, muscle strain and strain rate were partitioned, measured and compared over defined periods of stance (as described below). EMG parameters however were not partitioned into periods of stance. EMG timing data were measured relative to foot-on at the start of stance in absolute terms and as percentages of stance time. Duty factor was also normalized to stance time. Rectified EMG intensity (mV) was normalized by the largest recorded value for each electrode over all trials of individual animals.
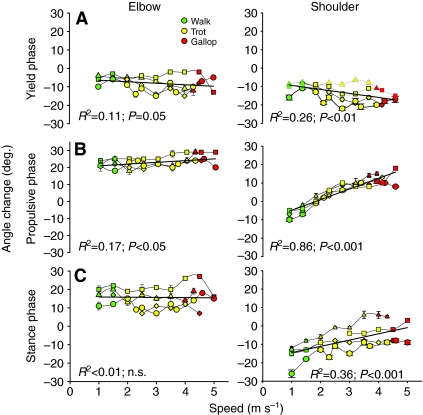
Fig. 4.
Effect of speed (m s–1) on angle change in the elbow (left) and shoulder (right), (A) in yield phase, (B) in propulsive phase and (C) over stance phase. Walks are in green, trots in yellow and gallops in red. Increases in speed caused increases in elbow flexion and extension magnitudes but net-stance angular excursion did not change with speed in the elbow. Likewise, shoulder flexion increased with speed as did extension (which was highly significant and shifted net flexion to net extension). Net-stance shoulder extension increased with speed, contributing to effective stride length.
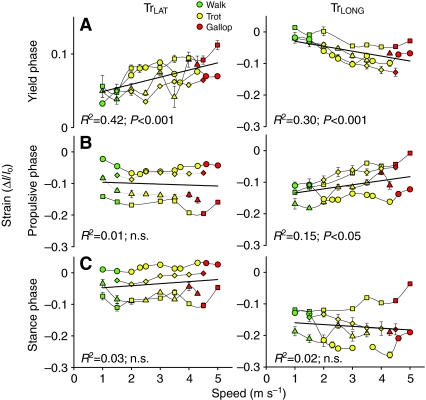
Fig. 5.
Effect of speed (m s–1) on fascicle strain (ΔI/Io) of the TrLAT (left) and TrLONG (right), (A) in yield phase, (B) in propulsive phase and (C) over stance phase. Walks are in green, trots in yellow and gallops in red. Each individual is denoted by a different symbol; values are means and s.e.m. Regression lines, r2 values and P values are fitted to the entire data set, and P values for speed as a covariate for all gaits are given in Table 2. Stretch magnitude in the TrLAT increased with speed but no other trends were found among individuals. Shortening magnitude in the TrLONG increased with speed during yield phase and decreased with speed during propulsive phase. Over stance phase three individuals showed significant (P<0.05) increases in shortening magnitude, whereas one individual showed significant (P<0.05) decreases.
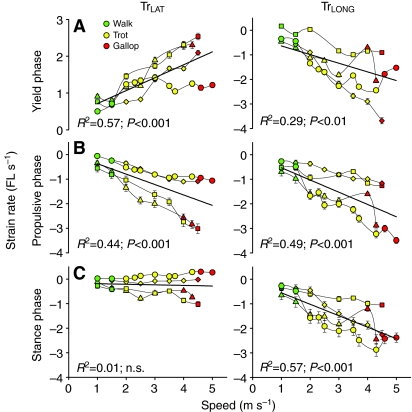
Fig. 6.
Effect of speed (m s–1) on fascicle strain rate (fascicle lengths s–1) of the TrLAT (left) and TrLONG (right) in (A) yield phase, (B) propulsive phase and (C) over stance phase. Walks are in green, trots in yellow and gallops in red. Each individual is denoted by a different symbol; values are means and s.e.m. Regression lines, r2 values, and P values are fitted to the entire data set, and P-values for speed as a covariate for all gaits are given in Table 2. Rate of stretch increased in the TrLAT for yield phase as did shortening for stance phase, but no increases in rate were detected over net stance. Strain rate increased in all phases of stance for the TrLONG.
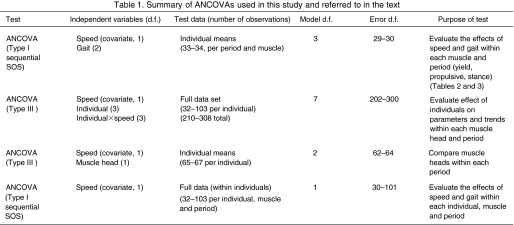
Various statistical analyses (see Table 1) were performed to compare the muscle heads and to assess the independent effects of gait and speed on limb joint kinematics and muscle function. To avoid pseudo-replication, tests were either conducted within individuals or on individual means when comparisons were made over a range of speeds. In all tests, speed was included as a covariate. Tests of speed and gait effects were compared using a sequential (Type 1) ANCOVA. Thus, if gait provided no explanatory power (i.e. non-significant P-value) after speed had been included in the analysis, it was considered to have no effect on the parameter. For comparisons between muscles or gaits, the least-squares means of each parameter were compared using post-hoc tests (Tukey's HSD) on least-squares means (mean values after the effect of speed had been removed). All tests were performed in JMP (SAS Institute, Cary, NC, USA)
Table 1.
Summary of ANCOVAs used in this study and referred to in the text
RESULTS
Kinematics
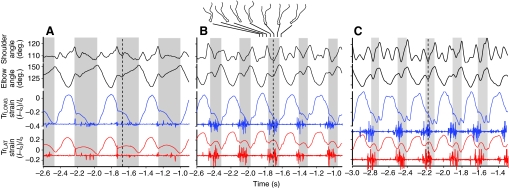
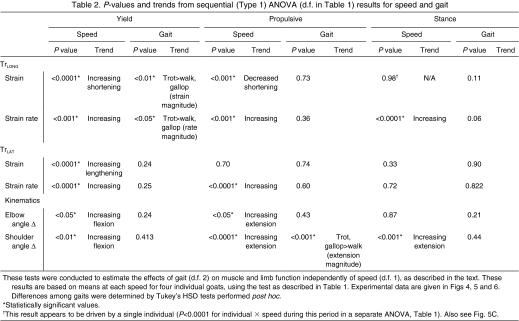
Goats showed no evidence of lameness and moved normally on the treadmill following surgery. Stance time decreased with increasing speed (P<0.001) in a pattern closely resembling that described previously for the hind limb of goats (Gillis et al., 2005). Goats of the size used in this study transitioned from walking to trotting at speeds above 1.5 m s–1 and from trotting to galloping at 4–4.5 m s–1, depending on size. Regardless of speed or gait, the elbow flexed at foot contact and re-extended before foot-off, resulting in net elbow extension (Fig. 2). Periods of elbow flexion and extension during stance were used to define the `yield' and `propulsive' phases (Phillipson, 1905) in subsequent analyses. As speed increased, there were weak trends towards increased flexion during the yield phase (P<0.05) and extension during propulsive phase (P<0.05; Fig. 4). These trends offset one another such that there was no change in net elbow angular excursion over stance phase (P>0.50; Fig. 4). Nor were there detectable independent effects of gait on elbow kinematics (Table 2).
Fig. 2.
Representative kinematic, strain and activation data from (A) a 1.5 m s–1 walk, (B) a 3 m s–1 trot and C. a 4.3 m s–1 gallop in a 24 kg goat. Elbow and shoulder joint angles are given in the top traces, fascicle strains and EMG are below (TrLONG, blue; TrLAT, red). Stance periods are indicated by grey shading. There was considerable within-individual variation even during steady running. Both the shoulder and elbow flexed at the onset of stance; in walking the shoulder remained flex, but in trotting and galloping it re-extended in the latter phase of stance. The elbow always flexed and extended; the dashed line indicates the transition from flexion to extension which was used to define `yield' and `propulsive' phases of stance. The long head shortened throughout most of stance whereas the lateral head showed a pattern of stretch and shortening that paralleled the flexion–extension pattern of the elbow.
Table 2.
P-values and trends from sequential (Type 1) ANOVA (d.f. in Table 1) results for speed and gait
During trotting and galloping, the shoulder underwent a parallel and simultaneous flexion and extension patterns to that observed in the elbow (Fig. 2). Yield phase flexion of the shoulder (P<0.01), as well as extension (P<0.001), increased with speed in a consistent pattern among individuals (Fig. 4B). Unlike the elbow, shoulder extension outpaced flexion resulting in increased net extension over stance with speed (P<0.001) and a longer effective step length (P<0.05).
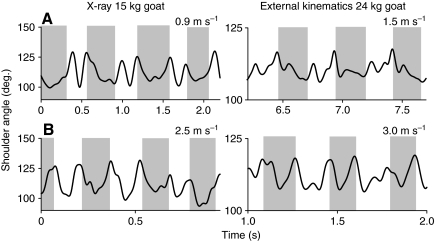
The pattern described above was based on external kinematic markers, but X-ray video recording of a single 15 kg goat showed a similar flexion–extension pattern during trotting (Fig. 3). Both techniques showed flexion at the onset of stance during walking, but a brief period of shoulder extension appears in external kinematics that was not found using X-ray video recording (Fig. 3). Overall, shoulder extension during the propulsive phase appears to be reduced relative to that predicted by speed alone (Table 2, significant effect of gait during propulsive phase).
Fig. 3.
Comparison of shoulder kinematics measured by X-ray video imaging (left) and external kinematics (right) during walk (A) and trot (B). The bold line is shoulder angle; the gray shading indicates estimated stance time as described in Materials and methods. (Sample videos are provided as supplementary material: Movies 1 and 2.) Overall, the patterns of flexion and extension were similar regardless of imaging technique, although shoulder angle magnitudes were greater in X-ray footage. This discrepancy may be due to differences in joint center estimation between external and internal kinematics.
Muscle strain
Strain patterns in the TrLAT closely followed elbow kinematics, lengthening as the elbow flexed and shortening as it extended (Fig. 2). This resulted in net shortening in most individuals over all speeds and gaits (Fig. 5). By contrast, the TrLONG shortened throughout all phases of stance in all individuals at all speeds (Fig. 2, Fig. 5C).
Significant differences in fascicle strain magnitude were found between the two muscles during the yield phase as well as over total stance regardless of speed or gait (Figs 2 and 5). During the yield phase of stance the TrLONG shortened (–6.2±1.2%) and the TrLAT stretched (6.8±0.6%; P<0.001). No differences in strain magnitude were found during the propulsive phase when both muscles shortened (TrLONG –10.2±2.0% and TrLAT –10.6±2.7%, P>0.50; when grouped for all speeds and gaits). As a result, net shortening strain of the TrLONG (–16.4±3.4%) exceeded that of the TrLAT (3.5±2.4%; P<0.001) over total stance duration.
Paralleling the increase in elbow flexion with speed described in the previous section, the magnitude of TrLAT lengthening increased with speed (P<0.001), ranging from 4.7±1.1% at a 1.5 m s–1 walk to 8.7±1.8% at a 4 m s–1 trot (pooled mean ± s.e.m. of individual means at each speed, N=4). ANCOVA revealed a significant effect of individual (P<0.001; see Table 1 for test description), indicating that individual recordings of the TrLAT varied in their amount of shortening during the propulsive phase of stance (Fig. 5B). No independent effects of gait on TrLAT strain were observed (Table 2).
In the TrLONG the magnitude of shortening strain in the yield phase increased with increasing speed (P<0.001) ranging from –2.5±0.6% at a 1.5 m s–1 walk to –6.5±2.7% at a 4 m s–1 trot. Yield phase TrLONG shortening also was influenced by gait, with greater shortening at a trot (–7.2±0.5%) than at a walk (–4.9±1%) or gallop (–2.3±0.9%; P<0.01; Table 2: values are least squares means ± s.e.m. from sequential ANCOVA as described in Table 1). The magnitude of shortening strain during the subsequent propulsive phase, however, decreased with increasing speed (P<0.05), ranging from –12.2±1.7% at a 1.5-m s–1 walk to –5.8±0.6% at a 4-m s–1 trot with no residual effect of gait (Table 2). The decreased magnitude of TrLONG shortening during the propulsive phase of stance with speed reflects the concurrent increase in shoulder extension (Fig. 4A).
No effect of speed on total stance phase TrLONG strain was observed (Table 2). However, this result appears to be driven by a single individual (Fig. 5C; speed×individual interaction P<0.001). Based on ANCOVA tests run within individual data sets (Table 1), three of the four individuals showed significant increases in shortening strain magnitude with speed (P<0.05, P<0.01, and P<0.0001, respectively), whereas one individual (squares in Fig. 5C) exhibited a significant decrease in strain magnitude with speed (P<0.05).
Strain rate
When all speeds and gates were grouped, strain rates differed between the TrLONG and TrLAT in the yield phase [–1.41±0.30 vs 1.46±0.24 fascicle lengths per second (FL s–1), respectively; P<0.001], and over stance (–1.39±0.23 vs –0.27±0.19 FL s–1, respectively; P<0.001; Fig. 5). However, strain rates did not differ during the propulsive phase (–1.39±0.29 vs –1.30±0.31, respectively; P>0.05) when both muscle shortened (Fig. 5).
Fascicle strain rate patterns in the TrLAT resembled the patterns for strain magnitude, although strain rate regressions were more strongly correlated with speed (Fig. 6). Strain rates of TrLAT fascicles during the stance yield phase ranged from 0.73±0.02 FL s–1 at 1.5 m s–1 to 2±0.8 FL s–1 at 4 m s–1, and during the propulsive phase from –0.52±0.1 FL s–1 at 1.5 m s–1 to –2.1±0.5 FL s–1 at 4 m s–1. No effect of speed on TrLAT net shortening strain rate during stance was observed (P>0.50). Fascicle strain rates of the TrLONG increased with speed during yield, propulsive, and overall stance phases (despite reduced shortening strain with speed in the propulsive phase; Fig. 5B). TrLONG strain rates ranged from –0.55±0.15 FL s–1 to –1.5±0.8 FL s–1 in the yield phase, –0.7±0.23 FL s–1 to –1.3±0.1 FL s–1 in the propulsive phase, and –0.6±0.1 FL s–1 to –1.4±03 FL s–1 over stance, when compared at a 1.5 m s–1 walk versus a 4 m s–1 trot (Fig. 6).
Muscle activation
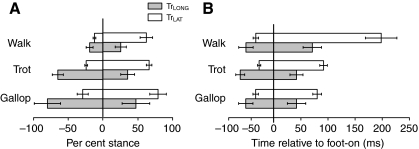
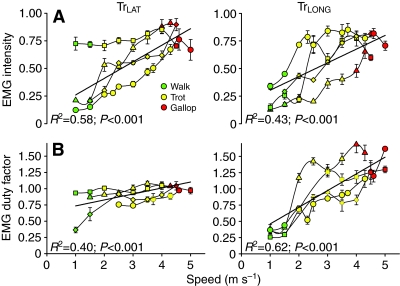
Both muscles were active for a portion of stance in all individuals and at all speeds. There was a small period of activation prior to limb reversal during the swing phase (Fig. 2), but the major period of activation in both muscles began before foot contact with the ground and ended before foot-off in both muscles (Fig. 2, Fig. 7A). EMG amplitude increased significantly with speed in both muscles (P<0.001) but showed no independent effects of gait. EMG onset occurred significantly earlier in the long head (64±5 ms before foot-on; –53±7% stance) than in the lateral head (33±5 ms before foot-on; –25±3% of stance; Fig. 7). No effect of speed on the absolute timing of EMG activation for either muscle was observed (P>0.20). As a percentage of stance, therefore, EMG onset time decreased with increasing speed (P<0.01 for both muscles, Table 3) as a result of decreased stance duration with speed. Consistent with its earlier activation onset, TrLONG activation also ended before that of the TrLAT. No effect of speed on activation offset of the TrLONG was observed in absolute (P>0.25) or relative stance time (P>0.10), with the mean offset time occurring 51±9 ms after foot-on, or 36±7% of stance. EMG offset in the TrLAT occurred significantly (P<0.001) earlier after stance onset as speed increased, maintaining a constant (i.e. no effect of speed, P>0.25) activation offset at 68±6% stance. Although both muscles showed an increased activation duty factor with increasing speed (P<0.0001), the increase was greater for the TrLONG (Fig. 8), reflecting the conserved relative activation offset of the TrLAT. A significant independent effect of gait on TrLONG was also observed, with running gaits having a longer TrLONG EMG duty factor than walking, but this was not the case for TrLAT (Table 2).
Fig. 7.
Relative (A) and absolute (B) timing of muscle activation in the TrLONG and TrLAT. Bars denote duration of activity for the TrLAT (white) and TrLONG (gray) with s.e.m. Durations are expressed as a percentage of stance (A) and in absolute terms (B). Earlier onset times in the TrLONG may indicate a role in limb reversal at the end of swing phase. Overall trends in relation to speed and gait are discussed in the text, also see Table 3.
Table 3.
P-values and trends from sequential (Type 1) ANOVA (d.f. in Table 1) results for speed and gait
|
Speed
|
Gait
|
|||
|---|---|---|---|---|
| P value | Trend | P-value | Trend | |
| TrLONG | ||||
| Onset (ms) | 0.96 | 0.68 | ||
| Onset (% of stance) | <0.01* | Increasing relative onset | 0.46 | |
| Offset (ms) | 0.28 | 0.72 | ||
| Offset (% of stance) | 0.23 | 0.98 | ||
| EMG amplitude | <0.0001* | Increasing | 0.17 | |
| EMG duty factor | <0.0001* | Increasing | 0.05* | Trot, gallop>walk |
| TrLAT | ||||
| Onset (ms) | 0.16 | 0.70 | ||
| Onset (% of stance) | <0.01* | Decreasing relative offset | 0.70 | |
| Offset (ms) | <0.0001* | Decreasing | 0.03* | Trot<gallop, walk |
| Offset (% of stance) | 0.25 | 0.56 | ||
| EMG amplitude | <0.0001* | Increasing | 0.65 | |
| EMG duty factor | <0.0001* | Increasing | 0.35 | |
Differences among gait types were determined by Tukey's HSD tests performed post hoc
Statistically significant values
Fig. 8.
Effect of speed (m s–1) on normalized EMG amplitude and duty factor (normalized to stance time) in the TrLAT (left) and TrLONG (right). Walks are in green, trots in yellow, and gallops in red. Each individual is denoted by a different symbol; values are means and s.e.m. Regression lines, r2 values, and P values are fitted to the entire data set, and P values for speed as a covariate for all gaits are given in Table 2. Both amplitude and duty factor increased with speed in both muscles; however, duty factor increased more precipitously in the TrLONG. Additional results are discussed in the text; also see Table 3.
DISCUSSION
We compared functional patterns in the long (TrLONG) and lateral (TrLAT) heads of the tricep brachii over a range of locomotor speeds and gaits in goats with the goal of understanding how differences in mono- versus biarticular anatomical organization lead to differences in functional pattern. Previously, we compared their roles during jumping take-off and landing (Carroll et al., 2008). Strain patterns differed markedly between the TrLAT and TrLONG, similar to differences observed during jumping. Whereas the TrLAT displayed a biphasic pattern of active stretch followed by active shortening during stance, the TrLONG actively shortened continuously throughout stance (Fig. 2). As hypothesized, a key difference between these patterns was the independence of the TrLONG from patterns of elbow flexion and extension made possible by of its biarticular organization. Specifically, flexion and extension patterns at the shoulder offset those at the elbow, allowing the TrLONG muscle to shorten during both the yield and propulsive phases of stance (Fig. 2). By contrast, the monoarticular TrLAT showed patterns of stretching during the yield phase of stance, and shortening during the propulsive phase that closely mirrored flexion and extension patterns of the elbow (Fig. 2).
Increases in speed were associated with increased fascicle strain magnitudes in both muscles, with increased stretch occurring during the yield phase and increased shortening during the propulsive phase in the TrLAT. Increased shortening in the TrLONG occurred during both phases (in three of the four individuals; Fig. 5, Table 2). Fascicle strain rates in both muscles also increased with increasing speed (Fig. 6), as did EMG intensity and EMG duty factor (Fig. 8). Few independent effects of gait on strain patterns were found when using a sequential (Type I) ANCOVA (Table 2). This finding supports the view that, although gait changes involve mechanically important changes in relative limb phase, limb muscle and joint patterns can largely be explained by changes in speed, rather than gait change, as previously noted by Fischer and Blickhan (Fischer and Blickhan, 2006).
Forelimb kinematics
In trots and gallops, stance began with elbow and shoulder flexion during the yield phase followed by re-extension during the propulsive phase (Fig. 2). This basic forelimb kinematic pattern has been observed in numerous small mammals (Fischer and Blickhan, 2006), cats (English, 1978) and dogs (Goslow et al., 1981). However, these studies found relatively little shoulder extension during the propulsive phase of stance. By contrast, we found that shoulder extension was of similar magnitude to flexion in goats during running gaits (Figs 2 and 4).
The magnitude of elbow flexion increased as speed increased (Fig. 4A). The increased flexion probably reflects an increased elbow moment, as contact time decreased and ground reaction forces probably increased, as has also been found in a variety of other animals (e.g. Biewener et al., 1983; Cavagna et al., 1977; Dutto et al., 2004; Kram and Taylor, 1990; Weyand et al., 2000). Elbow extension also increased with speed, compensating previous joint flexion to conserve net-stance elbow extension magnitude (Fig. 4). Likewise, both shoulder flexion and extension increased with speed. Increases in shoulder extension during the second phase of stance were, by far, the most consistent and significant relationships between speed and kinematics found in this study (Fig. 4B) and resulted in increased stride length. Increased stride length with speed has also appeared to result from increased shoulder extension and excursion in horses (Hudson-Tole, 2006), dogs (F. Jenkins, personal communication) and other mammals (Lilje et al., 2003). Thus, it appears that the elbow functions to compensate for the increased loading that results from decreased forelimb stance time as an animal's speed increases. By contrast, the shoulder functions to extend the leg, increasing stride length to help increase speed.
Muscle activation patterns
Consistent with our findings for the goat TrLAT and TrLONG, other studies examining motor activation patterns in one or both heads of the triceps [horses (Hudson-Tole, 2006; Tokuriki et al., 1989); dogs (Goslow et al., 1981); cats (English, 1978); and rats (Scholle et al., 2001)] have found these muscles to be active during stance. Increased EMG intensity at higher speeds has also been found in both heads of the horse triceps (Hoyt et al., 2005; Hudson-Tole, 2006) and is probably a response to increased joint and muscle loading. Similar increases in intensity have been found in the vastus lateralis and biceps femoris of goats (Gillis et al., 2005) and rats (Gillis and Biewener, 2001).
We also observed a brief period of TrLONG activity at the end of swing during faster trotting and galloping speeds, which fused with the stance phase activation of the muscle (Fig. 2C), as has been found in dogs (Tokuriki et al., 1989). Thus, it is possible that active TrLONG triceps force generation is required for limb reversal at the end of swing at higher speeds. The absolute delay between TrLAT activation and foot down found in this study (∼33 ms) was similar to that found in the TrLAT of horses by Hoyt et al. (Hoyt et al., 2005), who also found this to be invariant with speed. This pattern probably reflects excitation–contraction delays in muscle force development (Lieber, 2002) required to anticipate limb and elbow joint loading. The TrLONG tended to be activated and deactivated before the TrLAT in absolute terms, as well as a percentage of stance duration, perhaps reflecting a reduction in required shoulder moments near the end of stance.
Comparison of muscle strain patterns
As we hypothesized, the monoarticular TrLAT stretched and shortened in close association with the flexion–extension patterns of the elbow joint, consistent with earlier predictions from kinematics and EMG recordings of the dog lateral triceps (Goslow et al., 1981). Surprisingly, the contractile pattern differed from that found in the horse TrLAT, which showed minimal (∼2%) lengthening during trotting (Hoyt et al., 2005), despite a similar magnitude of elbow flexion (∼5 deg.). More broadly, the stretch-shortening strain pattern in the TrLAT resembled patterns observed in vivo in the monoarticular VL of goats (Gillis et al., 2005), rats (Gillis and Biewener, 2001) and humans (Ishikawa et al., 2005b), associated with knee flexion and extension during stance. The stretch-shortening strain pattern of the TrLAT was also similar to the contractile patterns of the muscle in take-off and landing during jumping (Carroll et al., 2008).
Based on X-ray ciné, the TrLONG has been predicted to shorten throughout stance in running dogs (Goslow et al., 1981), but sonomicrometric recordings from the dog TrLONG have only shown shortening during the yield phase (Gregersen et al., 1998). By contrast, we found continuous shortening in the TrLONG during the entirety of stance across both speed and gait changes, similar to its pattern during jump take-offs when overall limb and joint work must be generated (Carroll et al., 2008). The TrLONG shortened initially as a result of shoulder flexion (offsetting its tendency to stretch because of concurrent elbow flexion), then continued to shorten because of subsequent elbow extension during the latter half of stance. This pattern of continuous shortening has also been measured in the biarticular semimembranosus of trotting dogs (Gregersen et al., 1998), but generally has not been predicted for biarticular muscles (e.g. van Ingen Schenau, 1990; Fischer and Blickhan, 2006).
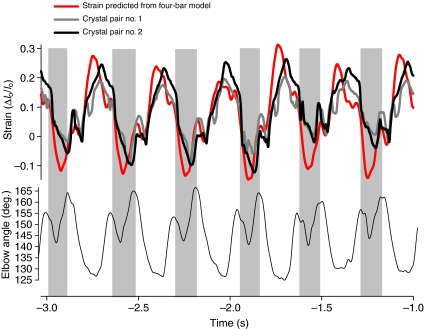
We interpret differences in strain patterns between the TrLONG and TrLAT largely in terms of differences in the anatomical organization of the muscles. However, other differences between the two muscle heads, such as TrLONG pinnation, may also contribute to these differences. To evaluate this possibility, strain patterns in the TrLONG were compared with those predicted using a four-bar linkage model (Figs 8 and 9) and found to be qualitatively similar. A similar difference based on ultrasound visualization was found between the biarticular medial gastrocnemius (MG) and monoarticular soleus of humans (Loram et al., 2006), with the soleus following ankle joint kinematics more closely than the MG. By contrast, estimation of strain patterns based on joint kinematics have shown similar patterns between the monoarticular and biarticular muscles of the triceps surae of cats (e.g. Prilutsky et al., 1996). We consider that this difference arises because of the difficulty of assessing accurately the series elastic compliance of muscle–tendon units when estimating muscle strain patterns from joint kinematics.
Fig. 9.
 |
van Ingen Schenau (van Ingen Schenau, 1990) posited that monoarticular muscles are mainly activated to produce force to contribute positive work, whereas biarticular muscles are activated to distribute net joint moments to control the direction of force applied externally by the limb. The differences in strain pattern we observed between the TrLAT and the TrLONG, however, appear inconsistent with this functional distinction. The TrLONG actively shortened throughout stance (–16.4±3.4% mean over all speeds and gaits), indicating positive work production, whereas the TrLAT underwent alternate active lengthening and shortening, suggesting energy absorption followed by production (Fig. 3). Thus, the biarticular TrLONG appears to function to produce work throughout stance, similar to its role during jump take-offs (Carroll et al., 2008). Furthermore, its size and architecture (relatively massive, long-fibered) are consistent with this function. Rather than being limited to the distribution of joint moments and energy transfer, the biarticular anatomy of the TrLONG allows it to shorten throughout stance, probably contributing significant work, in addition to any energy that it may additionally transfer across these two joints of the proximal forelimb. By comparison, the TrLAT appears to produce work only in the propulsive phase of stance, after absorbing energy at the elbow during the yield phase, tracking the flexion–extension dynamics of the elbow joint. It should be noted that these inferences are based on strain and EMG patterns alone and not direct measurements of muscle force and work production, and, thus, should be treated with some caution.
In contrast to the shortening observed in the biarticular goat TrLONG, hind limb biarticular muscles in running turkeys (Roberts et al., 1997) and guinea fowl (Daley and Biewener, 2003), hopping wallabies (Biewener et al., 1998) and walking and running humans (Ishikawa et al., 2005a; Lichtwark et al., 2007) display nearly isometric muscle function. Consequently, differences in their contractile behavior probably reflect other anatomical differences. First, whereas the TrLONG has a long moment arm at the shoulder relative to its moment arm at the elbow (Fig. 1), the proximal moment arms of the hind limb lateral and medial gastrocnemius at the knee are small relative to the muscles' moment arm at the ankle, reducing the influence of the knee joint on LG and MG length change behavior (Kaya et al., 2005). Second, fascicle length changes of the LG and MG are buffered from ankle joint kinematics by their comparatively long compliant tendon (Lichtwark and Wilson, 2006). By contrast, the tendon attachment of TrLONG at the elbow is extremely short, so that TrLONG fascicle length changes are more closely coupled to joint kinematics. Indeed, the monoarticular TrLAT stretch-shorten strain pattern is much more similar to that of the biarticular LG and MG muscles, despite the magnitudes of lengthening and shortening in the TrLAT being greater because of the absence of a compliant tendon. The similarities in strain patterns suggest that energy absorption at the elbow during the yield phases of stance is important, as is energy absorption at the ankle. The greater magnitude of fascicle strain in the TrLAT suggests that energy absorption is accomplished mainly by the muscle fascicles.
Effect of speed on muscle function
By examining the effect of speed on muscle strain patterns, it is possible to consider how speed-related changes may affect changes in the metabolic cost of locomotion (Heglund et al., 1982; Taylor, 1994; Roberts et al., 1998; Hedrick et al., 2003) and may, therefore, limit an animal's top sustainable speed. In both the goat TrLONG and TrLAT EMG intensity increased with speed, suggesting an increase in recruited muscle volume and the possibility of concurrent increases in the metabolic cost of locomotion. Such increases in recruited muscle volume are expected and have been observed in other studies as well (Daley and Biewener, 2003; Gillis and Biewener, 2001). An increase in recruited muscle volume, with little change in contractile strain behavior, is consistent with increased muscle force production being the primary determinant of an increase in rate of metabolic energy use associated with speed (Kram and Taylor, 1990). In certain muscles examined to date, the magnitude of shortening strain appears not to increase substantially with speed (Hoyt et al., 2005; Gillis et al., 2005; Roberts et al., 2007), supporting a pattern of changes in muscle recruitment and force being the major determinant of metabolic cost. In the present study, however, net contractile strains in the TrLONG increased with speed (Fig. 5), and such increases have also been observed in the TrLONG of dogs (Gregersen et al., 1998) and in the LG of guinea fowl (Daley and Biewener, 2003). Such increases in active shortening strain probably increase the work done by a muscle above that predicted by volume recruitment alone, contributing to an additional increase in the cost of locomotion. As a result, increases in muscle force and work output probably play a role in limiting the maximum sustained speed of an animal. The biarticular arrangement of the TrLONG may help mitigate the effects of speed on strain magnitude by allowing shoulder and elbow joint motions to offset their effect on the muscle's overall length change. Shoulder extension in the propulsive phase of stance increased with speed (Fig. 4), probably reducing speed-related effects on increased TrLONG shortening and work output, and thus, the muscle's contribution to increases in overall metabolic energy use rate.
Conclusions
Differences in anatomical configuration between the biarticular TrLONG and monoarticular TrLAT of goats appear to underlie significant differences in strain patterns displayed by each muscle during steady level locomotion. Whereas the monoarticular TrLAT stretched and shortened during the yield and propulsive phases of stance in a pattern that closely mirrored flexion-extension of the elbow, the biarticular TrLONG shortened throughout stance. This was mediated by shoulder flexion during the yield phase, and a combination of shoulder extension that exceeded elbow extension during the propulsive phase. The apparent functional role of the goat TrLONG for work production during steady speed locomotion is in contrast to the commonly predicted role of biarticular muscles: to distribute moments across adjacent joints and transfer energy but to contribute little or no work. This latter behavior of biarticular muscles has been observed in hind limb triceps surae leg muscles, in which the nearly isometric contractile behavior is facilitated by transmitting force via long compliant tendons. By contrast, both the biarticular TrLONG and monoarticular TrLAT lack a compliant distal tendon attachment at the elbow. As a result, length changes of both these muscles are largely accommodated by the muscle's fascicles and not by the muscle's series elastic structures. As speed increased, the TrLONG showed increases in strain (in most individuals) and strain rate (Figs 5 and 6), and the TrLAT showed increases in stretching strain and stretch and shortening strain rate (Figs 5 and 6). These changes in muscle strain pattern, along with increases in muscle recruitment suggested by increased EMG intensity with speed, probably underlie an increased metabolic cost of muscle usage, contributing to an increased cost of locomotion and limiting the maximum sustainable speed of goats.
Supplementary Material
Supplementary material available online at http://jeb.biologists.org/cgi/content/full/212/20/3349/DC1
Pedro Ramirez maintained and helped to train the goats used in this study, and was invaluable in facilitating this research. Carlos Moreno, Russell Main, Craig McGowan, Edwin Yoo, Ivo Ros, Kieth Egan, Cathy Handy, Emily Niu and Trevor Higgins assisted in data collection. Craig McGowan also donated his inverse dynamics script. This research was supported by NIH grant AR-047679 to A.A.B. Deposited in PMC for release after 12 months.
References
- Biewener, A. A., Thomason, J. J. and Lanyon, L. E. (1983). Mechanics of locomotion and jumping in the forelimb of the horse (Equus): in vivo stresses developed in the radius and metacarpus. J. Zool. Lond. 201, 67-82. [Google Scholar]
- Biewener, A. A. and Roberts, T. J. (2000). Muscle and tendon contributions to force, work, and elastic energy savings: a comparative perspective. Exerc. Sport Sci. Rev. 28, 99-107. [PubMed] [Google Scholar]
- Biewener, A. A., Konieczynski, D. D. and Baudinette, R. V. (1998). In vivo muscle force-length behavior during steady-speed hopping in tammar wallabies. J. Exp. Biol. 201, 1681-1694. [DOI] [PubMed] [Google Scholar]
- Carroll, A. M., Lee, D. V. and Biewener, A. A. (2008). Differential muscle function between muscle synergists: long and lateral heads of the triceps in jumping and landing goats (Capra hircus). J. Appl. Physiol. 105, 1262-1273. [DOI] [PMC free article] [PubMed] [Google Scholar]
- Cavagna, G. A., Heglund, N. C. and Taylor, C. R. (1977). Mechanical work in terrestrial locomotion: two basic mechanisms for minimizing energy expenditure. Am. J. Physiol. 233, R243-R261. [DOI] [PubMed] [Google Scholar]
- Cleland, J. (1867). On the actions of muscles passing over more than one joint. J. Anat. Physiol. 1, 85-93. [PMC free article] [PubMed] [Google Scholar]
- Daley, M. A. and Biewener, A. A. (2003). Muscle force-length dynamics during level versus incline locomotion: a comparison of in vivo performance of two guinea fowl ankle extensors. J. Exp. Biol. 206, 2941-2958. [DOI] [PubMed] [Google Scholar]
- Dutto, D. J., Hoyt, D. F., Cogger, E. A. and Wickler, S. J. (2004). Ground reaction forces in horses trotting up an incline and on the level over a range of speeds. J. Exp. Biol. 207, 3507-3514. [DOI] [PubMed] [Google Scholar]
- English, A. W. (1978). An electromyographic analysis of forelimb muscles during overground stepping in the cat. J. Exp. Biol. 76, 105-122. [DOI] [PubMed] [Google Scholar]
- Fischer, M. S. and Blickhan, R. (2006). The tri-segmented limbs of therian mammals: kinematics, dynamics, and self-stabilization: a review. J. Exp. Zool. A Comp. Exp. Biol. 305, 935-952. [DOI] [PubMed] [Google Scholar]
- Gillis, G. B. and Biewener, A. A. (2001). Hindlimb muscle function in relation to speed and gait: in vivo patterns of strain and activation in a hip and knee extensor of the rat (Rattus norvegicus). J. Exp. Biol. 204, 2717-2731. [DOI] [PubMed] [Google Scholar]
- Gillis, G. B., Flynn, J. P., McGuigan, P. and Biewener, A. A. (2005). Patterns of strain and activation in the thigh muscles of goats across gaits during level locomotion. J. Exp. Biol. 208, 4599-4611. [DOI] [PubMed] [Google Scholar]
- Gorb, S. V. and Fischer, M. S. (2000). Three-dimensional analysis of the arrangement and length distribution of fascicles in the triceps muscle of Galea musteloides (Rodentia, Cavimorpha). Zoomorphology 120, 91-97. [Google Scholar]
- Goslow, G. E., Jr, Seeherman, H. J., Taylor, C. R., McCutchin, M. N. and Heglund, N. C. (1981). Electrical activity and relative length changes of dog limb muscles as a function of speed and gait. J. Exp. Biol. 94, 15-42. [DOI] [PubMed] [Google Scholar]
- Gregersen, C. S., Silverton, N. A. and Carrier, D. R. (1998). External work and potential for elastic storage at the limb joints of running dogs. J. Exp. Biol. 201, 3197-3210. [DOI] [PubMed] [Google Scholar]
- Hedrick, T. L., Tobalske, B. W. and Biewener, A. A. (2003). How cockatiels (Nymphicus hollandicus) modulate pectoralis power output across flight speeds. J. Exp. Biol. 206, 1363-1378. [DOI] [PubMed] [Google Scholar]
- Heglund, N. C., Fedak, M. A., Taylor, C. R. and Cavagna, G. A. (1982). Energetics and mechanics of terrestrial locomotion. IV. Total mechanical energy changes as a function of speed and body size in birds and mammals. J. Exp. Biol. 97, 57-66. [DOI] [PubMed] [Google Scholar]
- Hoyt, D. F., Wickler, S. J., Biewener, A. A., Cogger, E. A. and De La Paz, K. L. (2005). In vivo muscle function vs speed. I. Muscle strain in relation to length change of the muscle-tendon unit. J. Exp. Biol. 208, 1175-1190. [DOI] [PubMed] [Google Scholar]
- Hudson-Tole, E. (2006). Effects of treadmill inclination and speed on forelimb muscle activity and kinematics of the horse. Equine Comp. Ex. Phys. 3, 61-72. [Google Scholar]
- Ishikawa, M., Komi, P. V., Grey, M. J., Lepola, V. and Bruggemann, G. P. (2005a). Muscle-tendon interaction and elastic energy usage in human walking. J. Appl. Physiol. 99, 603-608. [DOI] [PubMed] [Google Scholar]
- Ishikawa, M., Niemela, E. and Komi, P. V. (2005b). Interaction between fascicle and tendinous tissues in short-contact stretch-shortening cycle exercise with varying eccentric intensities. J. Appl. Physiol. 99, 217-223. [DOI] [PubMed] [Google Scholar]
- Jacobs, R., Bobbert, M. F. and van Ingen Schenau, G. J. (1993). Function of mono- and biarticular muscles in running. Med. Sci. Sports Exerc. 25, 1163-1173. [PubMed] [Google Scholar]
- Kaya, M., Jinha, A., Leonard, T. R. and Herzog, W. (2005). Multi-functionality of the cat medical gastrocnemius during locomotion. J. Biomech. 38, 1291-1301. [DOI] [PubMed] [Google Scholar]
- Kram, R. and Taylor, C. R. (1990). Energetics of running: a new perspective. Nature 346, 265-267. [DOI] [PubMed] [Google Scholar]
- Lichtwark, G. A. and Wilson, A. M. (2006). Interactions between the human gastrocnemius muscle and the Achilles tendon during incline, level and decline locomotion. J. Exp. Biol. 209, 4379-4388. [DOI] [PubMed] [Google Scholar]
- Lichtwark, G. A., Bougoulias, K. and Wilson, A. M. (2007). Muscle fascicle and series elastic element length changes along the length of the human gastrocnemius during walking and running. J. Biomech. 40, 157-164. [DOI] [PubMed] [Google Scholar]
- Lieber, R. L. (2002). Skeletal Muscle Structure, Function and Plasticity: The Physiological Basis of Rehabilitation. Philadelphia, PA: Lippincott Williams and Wilkins.
- Lilje, K., Tardieu, C. and Fischer, M. S. (2003). Scaling of long bones in ruminants with respect to the scapula. J. Zoolog. Syst. Evol. Res. 41, 118-126. [Google Scholar]
- Loeb, G. E. and Gans, C. (1986). Electromyography for Experimentalists. Chicago, IL: University of Chicago Press.
- Loram, I. D., Maganaris, C. N. and Lakie, M. (2006). Use of ultrasound to make noninvasive in vivo measurement of continuous changes in human muscle contractile length. J. Appl. Physiol. 100, 1311-1323. [DOI] [PubMed] [Google Scholar]
- Marsh, R. L. and Ellerby, D. J. (2006). Partitioning locomotor energy use among and within muscles: muscle blood flow as a measure of muscle oxygen consumption. J. Exp. Biol. 209, 2385-2394. [DOI] [PubMed] [Google Scholar]
- Mol, C. R. and Breddels, P. A. (1982). Ultrasound velocity in muscle. J. Acoust. Soc. Am. 71, 455-461. [DOI] [PubMed] [Google Scholar]
- Payne, R. C., Hutchinson, J. R., Robilliard, J. J., Smith, N. C. and Wilson, A. M. (2005a). Functional specialisation of pelvic limb anatomy in horses (Equus caballus). J. Anat. 206, 557-574. [DOI] [PMC free article] [PubMed] [Google Scholar]
- Payne, R. C., Veenman, P. and Wilson, A. M. (2005b). The role of the extrinsic thoracic limb muscles in equine locomotion. J. Anat. 206, 193-204. [DOI] [PMC free article] [PubMed] [Google Scholar]
- Phillipson, M. (1905). L'autonomie et la centralization dans le systeme nerveux des animaux. Travails du Laboratoire de la Physiologie, Institut Solvey 7, 1-208. [Google Scholar]
- Prilutsky, B. I. and Zatsiorsky, V. M. (1994). Tendon action of two-joint muscles: transfer of mechanical energy between joints during jumping, landing, and running. J. Biomech. 27, 25-34. [DOI] [PubMed] [Google Scholar]
- Prilutsky, B. I., Herzog, W. and Allinger, T. L. (1996). Mechanical power and work of cat soleus, gastrocnemius and plantaris muscles during locomotion: possible functional significance of muscle design and force patterns. J. Exp. Biol. 199, 801-814. [DOI] [PubMed] [Google Scholar]
- Roberts, T. J., Marsh, R. L., Weyand, P. G. and Taylor, C. R. (1997). Muscular force in running turkeys: the economy of minimizing work. Science 275, 1113-1115. [DOI] [PubMed] [Google Scholar]
- Roberts, T. J., Kram, R., Weyand, P. G. and Taylor, C. R. (1998). Energetics of bipedal running. I. Metabolic cost of generating force. J. Exp. Biol. 201, 2745-2751. [DOI] [PubMed] [Google Scholar]
- Roberts, T. J., Higginson, B. K., Nelson, F. E. and Gabaldon, A. M. (2007). Muscle strain is modulated more with running slope than speed in wild turkey knee and hip extensors. J. Exp. Biol. 210, 2510-2517. [DOI] [PubMed] [Google Scholar]
- Scholle, H. C., Schumann, N. P., Biedermann, F., Stegeman, D. F., Grassme, R., Roeleveld, K., Schilling, N. and Fischer, M. S. (2001). Spatiotemporal surface EMG characteristics from rat triceps brachii muscle during treadmill locomotion indicate selective recruitment of functionally distinct muscle regions. Exp. Brain Res. 138, 26-36. [DOI] [PubMed] [Google Scholar]
- Taylor, C. R. (1994). Relating mechanics and energetics during exercise. In Comparative Vertebrate Exercise Physiology (ed. J. H. Jones), pp. 181-215. San Diego, CA: Academic Press. [PubMed]
- Tokuriki, M., Aoki, O., Niki, Y., Kurakawa, Y., Hataya, M. and Kita, T. (1989). Electromyographic activity of cubital joint muscles in horses during locomotion. Am. J. Vet. Res. 50, 950-957. [PubMed] [Google Scholar]
- van Ingen Schenau, G. J. (1990). On the action of bi-articular muscles, a review. Neth. J. Zool. 40, 521-540. [Google Scholar]
- Weyand, P. G., Sternlight, D. B., Bellizzi, M. J. and Wright, S. (2000). Faster top running speeds are achieved with greater ground forces not more rapid leg movements. J. Appl. Physiol. 89, 1991-1999. [DOI] [PubMed] [Google Scholar]
- Williams, S. B., Wilson, A. M., Rhodes, L., Andrews, J. and Payne, R. C. (2008). Functional anatomy and muscle moment arms of the pelvic limb of an elite sprinting athlete: the racing greyhound (Canis familiaris). J. Anat. 213, 361-372. [DOI] [PMC free article] [PubMed] [Google Scholar]
- Witte, H., Biltzinger, J., Hackert, R., Schilling, N., Schmidt, M., Reich, C. and Fischer, M. S. (2002). Torque patterns of the limbs of small therian mammals during locomotion on flat ground. J. Exp. Biol. 205, 1339-1353. [DOI] [PubMed] [Google Scholar]
Associated Data
This section collects any data citations, data availability statements, or supplementary materials included in this article.


