

Abstract
Temporal changes in the T1 and T2 relaxation rates (ΔR1 and ΔR2) in rat olfactory bulb and cortex were compared with the absolute manganese (Mn) concentrations from the corresponding excised tissue samples. In-vivo T1 and T2 relaxation times were measured before, and at 1, 7, 28, and 35 days after intravenous infusion of 176 mg/kg MnCl2. The values of ΔR1, ΔR2 and absolute Mn concentration peaked at Day 1 and then declined to near control levels after 28-35 days. The Mn bioelimination rate from the rat brain was significantly faster than that reported using radioisotope techniques. The R1 and R2 relaxation rates were linearly proportional to the underlying tissue Mn concentration and reflect the total absolute amount of Mn present in the tissue. The in-vivo Mn r1 and r2 tissue relaxivities were comparable to the in-vitro values for aqueous Mn2+. These results demonstrate that loss of MEMRI contrast after systemic Mn2+ administration is due to elimination of Mn2+ from the brain.
Keywords: T1, T2, r1 and r2 relaxivities; manganese; bioelimination; rat brain; quantification
Introduction
Manganese (Mn) is an essential biometal that plays important roles in metabolism and synaptic function as an enzymatic cofactor in the brain (1). However, excess Mn can damage the central nervous system by a number of mechanisms (2), including inhibiting mitochondrial oxidative phosphorylation (3). Manganese can be sequestered by various factors in tissues and efflux from the brain can be extremely slow. For example, the half-life of Mn in the rat brain has been estimated to range from 52-74 days depending on the brain regions; significantly longer than many other rodent tissues (4). By contrast, the apparent cerebral Mn bioelimination rate — based on the temporal reduction of Manganese-Enhanced MRI (MEMRI) signal intensity — may be faster, with little residual evidence of T1 signal enhancement 2-3 weeks after systemic or intrathecal injection of Mn2+ (5,6). This possible discrepancy suggests that the temporal reduction of MEMRI signal in the brain may result from more than bioelimination alone. For example, if a significant fraction of cerebral Mn is sequestered in a form that is not accessible by water, it would not contribute to T1 relaxation. It is known that Mn2+ can be sequestered in brain mitochondria (7) and in ferritin (8). In this case, an apparent reduction in MEMRI signal enhancement would be indistinguishable from the normal bioelimination process. Such a scenario may be partially responsible for the lengthy cerebral retention of Mn observed in earlier studies (4,7).
In this study, the temporal decline in T1 and T2 relaxation rates (ΔR1 and ΔR2) in the rat brain following a single systemic dose of MnCl2 was investigated to establish whether the reduction is due to: (1) bioelimination of Mn from the cerebral tissue; (2) sequestration of Mn in a macromolecular environment that is inaccessible by water; or (3) some combination of the two. The in-vivo T1 and T2 relaxation times of rat olfactory bulb and cortex were measured at various time points following intravenous administration of MnCl2. The corresponding ΔR1 and ΔR2 values were then compared to the absolute Mn tissue concentrations of excised tissue samples from the same regions to determine if ΔR1 and ΔR2 truly reflect the underlying Mn concentration. Furthermore, the quantitative relationship between R1, R2 and absolute cerebral Mn concentration were used to estimate in vivo tissue relaxivities, r1 and r2, for the rat olfactory bulb and cortex.
Methods
All animal studies were approved by the Animal Care and Use Committee of National Institute of Neurological Disorders and Stroke, National Institutes of Heath (Bethesda, MD). Adult male Sprague-Dawley rats (weighing from 140-190 g) were anesthetized with 2% isoflurane. An aqueous solution of 120 mM MnCl2 (Sigma-Aldrich, St. Louis, MO) was infused via the tail vein at a rate of 2.25 ml/h using a syringe pump (Cole-Parmer Instrument, Vernon Hills, IL) until a dose of 176 mg/kg was achieved. The body temperature was monitored and maintained by a heated water bath. Following the infusion, rats were returned to their cage and allowed normal access to food and water. No adverse reactions to the infusion were observed in any of the animals. In-vivo T1 and T2 relaxation times were measured before, and then at 1, 7, 28, and 35 days after MnCl2 infusion.
Images were acquired on an 11.7 T/31 cm horizontal magnet (Magnex Scientific Ltd., Abingdon, UK) interfaced to a Bruker Avance console (Bruker BioSpin, Billerica, MA). During MRI, animals were anesthetized with 2% isoflurane and the body temperature was maintained by a temperature-controlled water bath. A homebuilt 9-cm birdcage coil was used for RF transmission and a 3-cm surface coil was used for signal reception. Twenty-one, 1-mm-thick, axial MRI slices were acquired across the brain with an in-plane resolution of 0.2 mm × 0.2 mm. The T1 relaxation times were measured using a Look-Locker sequence (TR = 12 s, TE = 2.5 ms, flip angle = 25°, relaxation interval = 400 ms, sample points = 25) and brain T1 maps were calculated for each slice using a nonlinear least-squares 3-parameter fitting algorithm and subsequent post-processing to compensate the effect of flip angle (9). The T2 relaxation times were measured using a CPMG spin-echo sequence (TR = 10 s; TE = 6.5 ms; and 20 echoes) and brain T2 maps calculated for each slice using a nonlinear least-squares 3-parameter fitting algorithm.
Following the imaging session for a given time point, the rat was euthanized and the brain removed. The olfactory bulb (OB) was excised as well as a small sample in the cortical region above the striatum. Brain tissue samples were analyzed for absolute Mn using inductively coupled plasma-mass spectrometry (ICP-MS) (West Coast Analytical Service, Santa Fe Springs, CA). The weight of manganese per gram-wet-weight of brain tissue was converted to molar concentration by assuming 80% water content (10). For a given animal, anatomical regions of interest in the calculated T1 and T2 maps were selected that best corresponded to the size and spatial location of the excised tissue samples. Changes in the R1 (1/T1) and R2 (1/T2) relaxation rates relative to the pre-infusion controls (i.e., ΔR1 and ΔR2) were compared to the corresponding Mn concentrations in each tissue sample. Statistical analysis was performed using a one-tailed, Student’s t-test with unequal variance; a value of p < 0.05 was considered significant. The data at each time point were compared to the same pre-infusion control group.
The bioelimination rate of cerebral Mn was estimated by a single exponential fit to the averaged Mn concentrations or ΔR1 values at the four post-injection time points. The half-life was calculated by multiplying the time constant of the exponential fit by 0.693 (4). The apparent in-vivo tissue relaxivities, r1 and r2, were estimated from the slopes of the linear fits of R1 and R2 versus the Mn concentration, respectively.
Results
Large reductions in T1 and T2 relaxation times were observed in the OB, cortex, and thalamus of the rat brain at 1 day and 7 days after Mn infusion (Fig. 1). The reduction in T1 values was consistently higher in the OB — as compared to the cortex — at all time points. For example, the T1 values in OB and cortex were reduced by approximately 55% and 30%, respectively, at Day 1. In the ensuing days, the T1 values gradually returned to the pre-injection baseline. At Days 28 and 35, the T1 reductions were only 15% and 8% in the OB and cortex, respectively. The reduction in T2 values followed trends similar to those observed for T1 but was much less pronounced. In the OB, T2 values were reduced by an average of ∼25% at Day 1 and by 6% at Day 28. The T2 reductions in the cortex were even smaller — from ∼10% at Day 1 to ∼3% at Day 28. The reduction in T2 values was consistently higher in the OB — as compared to the cortex — at all time points.
Fig. 1.
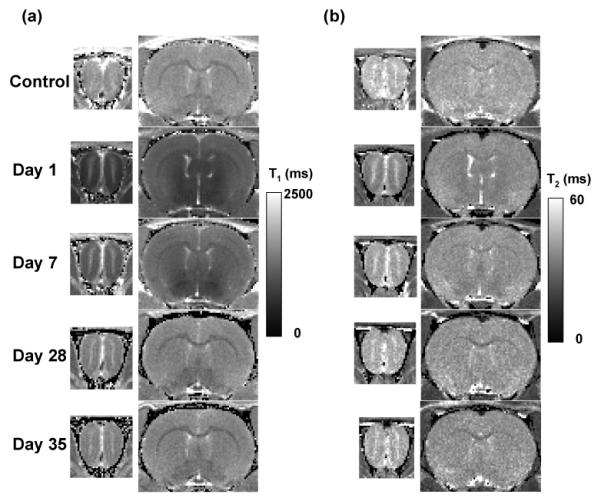
Time series calculated (a) T1 and (b) T2 maps intersecting the OB and cortex in the same rat acquired before (control) and at 1, 7, 28, and 35 days after intravenous infusion of 176 mg/kg MnCl2.
The variations in ΔR1, ΔR2 and Mn concentration in the OB and cortex as a function of time following MnCl2 administration are shown in Fig. 2. Consistent with the calculated T1 and T2 maps shown in Fig. 1, the ΔR1 and ΔR2 values for both OB and cortex peaked at Day 1 and then declined to near baseline (i.e., zero in the case of ΔR1 and ΔR2) at 4 – 5 weeks post-injection. For both OB and cortex, ΔR1 and ΔR2 was significantly higher than zero baseline at all time points; except for ΔR2 in the OB at Day 35.
Fig. 2.

Temporal changes in (a, b) ΔR1 (open square), (c, d) ΔR2 as a function of Mn concentration (gray diamond) in the OB and cortex. The star symbols (gray for Mn concentration; black for ΔR1 or ΔR2) represent statistical significance compared to day 0: * p < 0.05; ** p < 0.01; error bar = 1 standard deviation.
The temporal evolution of tissue Mn concentration followed the same trend observed for the ΔR1 and ΔR2 values. In the OB, the Mn concentration increased from baseline (∼0.01 mM) to ∼0.11 mM at Day 1 and then gradually declined to about 0.02 mM at Day 28; a level that was statistically different from the baseline value. In the cortex, the Mn concentration increased from ∼0.02 mM (at baseline) to ∼0.06 mM at Day 1 and then declined to a level at Days 28 and 35 that was statistically equal to the baseline value.
The half-life of Mn in both OB and cortex was estimated by fitting the temporal evolution of the corresponding ΔR1 values and Mn concentrations to a single exponential. The half-life estimated from the ΔR1 versus time curves was 11 days in the OB (R2 = 0.91) and 12 days in the cortex (R2 = 0.96). The half-life estimated from the Mn concentration versus time curves was 15 days in the OB (R2 = 0.89) and 24 days in the cortex (R2 = 0.998).
Fig. 3 shows the relationship between R1 and R2 values — as a function of tissue Mn concentration — in the OB and the cortex. For the OB, both R1 and R2 varied linearly with tissue Mn concentration over this range of values. The apparent tissue relaxivities r1 and r2 for the OB were calculated from the respective slopes of these plots and were estimated to be 6.5 s-1mM-1 (R2 = 0.98) and 65.5 s-1mM-1 (R2 = 0.94), respectively. For the cortex, the smaller dynamic range of the R1 and R2 changes with Mn concentration — coupled with more variation in the data — made estimates the apparent tissue relaxivities r1 and r2 more unreliable. The r1 value for the cortex was estimated to be 4.7 s-1mM-1 (R2 = 0.85). The r2 value for the cortex was not calculated because of the poor correlation between the data.
Fig. 3.

(a) R1 and (b) R2 versus Mn concentration in the OB and cortex for the various time points shown in Fig. 2.
Discussion
Consistent with earlier MEMRI studies (5,6), the T1 and T2 relaxation times of cerebral tissue water are maximal during the first few days following intravenous infusion of MnCl2 and then decline to near control levels in the ensuing weeks. The temporal decline in tissue Mn concentration follows a similar trend. In the case of the OB, the Mn concentration at 28 and 35 days post-infusion is approximately twice that — and statistically different from — the control. However, relative to the high initial tissue Mn concentration at Day 1, these results indicate that only a small fraction of the total Mn dose is retained in the brain at these longer time points.
The temporal changes in T1 and T2 are mainly due to Mn transport in and out of brain as opposed to partial sequestration of Mn in subcellular pools. For example, glutamine synthetase and mitochondrial superoxide dismutase are the two major metalloproteins requiring Mn in the brain (1). In addition to mitochondria, Mn2+ binds tightly to phosphate, nitrate, and carboxylate groups which are abundant in the cellular milieu (3). Mn2+ can also bind strongly to ferritin (8). In all of these cases, Mn2+ sequestration would reduce water accessibility to the paramagnetic metal and thus T1 contrast. However, these mechanisms do not appear to contribute significantly to the apparent rate of Mn bioelimination as assessed by MEMRI.
The results of this MEMRI study suggest that the efflux of cerebral Mn is significantly faster than that reported in earlier investigations using other methods. For example, Mn bioelimination studies using 54Mn estimated biological half-lives of 52 – 74 days in the rat brain (4). By contrast — in this study — the half-lives of Mn in the OB and cortex were much less; 15 and 24 days, respectively, based on the Mn concentration data and 11 and 12 days, respectively, calculated from the ΔR1 data. This discrepancy may in part be due to the large difference in dose employed by the two studies; the infused dose in the 54Mn study was about three orders of magnitude less than that in the current study. The relatively lower Mn concentration used in the 54Mn study may be comparable to that needed to saturate the binding sites in the subcellular pools. In this case, sequestered or transiently sequestered Mn may explain the reduced Mn bioelimination rate for those studies.
Another study has shown that the half-life of Mn in the body decreased from 32 days to 10 days when the dose of intramuscularly-injected 54Mn was increased from 2.8 mg/kg to 82.4 mg/kg (11). Based on these results, the significantly higher dose used in the current study may itself be responsible for the increased Mn bioelimination rate observed in the brain. Given the relatively low sensitivity of R1 with respect to Mn concentration, it is not possible to conduct a comparable MEMRI experiment — at the dose levels employed in the 54Mn studies — to investigate this possibility.
As shown in Fig. 3, the R1 and R2 relaxation rates as a function of Mn concentration in the OB and cortex generally exhibit a linear correlation over the given concentration range. Since the R1 and R2 values truly reflect the underlying tissue Mn concentration, then the slope of the best-fit line through the data should provide a reasonable estimate of the corresponding Mn tissue relaxativities — r1 and r2. The OB r1 value (6.5 s-1 mM-1) calculated from the data in Fig. 3 is in excellent agreement other in-vivo estimates of r1 for tissue Mn. For example, in the marmoset and rat brain, the r1 values are 6.2 s-1mM-1 (0.141 s−1μg−1g) and 6.8 s-1mM-1 (0.155 s−1μg−1g), respectively, at 7.0T (12). The OB r1 value also compares well with the r1 value of 7.7 s-1mM-1 measured at 7.0T for Mn sequestered in murine hepatocytes (13). The OB r2 value of 65.5 s-1mM-1 is consistent with the observation that Mn r2 values generally tend to be approximately one order of magnitude larger than the corresponding r1 values.
For the cortex, the r1 value (4.7 s-1mM-1) was ∼28% lower than that measured in the OB. However, two experimental issues may account for much of this difference. First, the concentration of Mn in the cortical tissue was only about half that in the OB. Consequently, the dynamic range of the R1 change with concentration was only about half that observed for the OB. This factor, coupled with a larger variance in the data — as compared to the OB data — make the slope of the best-fit line for the cortical r1 data more susceptible to error. Second, the cortical data are more prone to tissue-sampling errors. For example, the spatial co-registration between the region of dissected tissue and the corresponding region on the calculated T1 and T2 maps is much less accurate in the cortex as compared to the OB. In the case of the cortical r2 relaxivity, the large variance in the data did not yield a reliable estimate for the value. Finally, it is known that there are laminar variations in MRI contrast across the cortex and olfactory bulb that may also have affected the quantitative comparison of relaxivities and Mn content (5).
The in-vivo r1 and r2 values for tissue Mn in this study are comparable to those reported for aqueous Mn2+. The in-vitro r1 relaxivity values for Mn2+ are on the order of 7 – 8 s-1mM-1 for magnetic field strengths above 1.5T, while the r2 relaxivity values are in the range of 30 – 125 s- 1mM-1 (14). Furthermore, the OB r1 value in this study is close to that of MnCl2 in water at the same field (6.9 s-1mM-1) (9). In-vivo relaxivity constants for Mn have been reported to be up to one order of magnitude higher at low magnetic fields than those in vitro, due to the binding of Mn2+ to macromolecules (15,16). Binding of Mn to macromolecules slows correlation times to increase relaxivity which can have a large effect at low fields. At high fields — as used in the present study — this correlation time effect is expected to be minimal and hence it is difficult to judge the binding state of Mn2+ from the relaxivities measured.
The similarity between the in-vivo and in-vitro r1 values might suggest that Mn in the OB and the cortex exists primarily in the free ionic form. However, the very large number of intracellular binding sites for Mn2+ and the relatively low concentrations of Mn2+ that accumulated with respect to these binding sites — less than ∼0.13 mM in these studies — make it unlikely that Mn2+ is in its free form. For example, ATP concentrations are on the order of millimolar in the brain and ATP has a high affinity for Mn2+ (binding constant about 104 M-1) (17). Therefore, binding of Mn2+ to ATP alone would lead to only nanomolar levels of free Mn2+.
It is possible that a fast-relaxing component of bound Mn is present in brain tissue, but not observable under the experimental conditions used for these studies. For example, in the Mn2+-perfused rat heart, biexponential T1 and T2 behavior has been observed, with the fast-relaxing component attributed to water interacting with Mn2+ in the intracellular space (18). In the current study, differences between the single- and bi-exponential fitting to the T1 and T2 data were not observed. However, this could be due to insufficient sampling in the fast-relaxing regime of the signal intensity curves. Irrespective of the amount of Mn2+ that may be bound in brain tissue, the essentially complete bioelimination of the entire Mn dose — with little bound Mn retained in subcellular pools — argues that the Mn2+ is present in a form that can be effectively transported out of the brain.
In summary, the temporal changes in T1 and T2 relaxation times observed using MEMRI are due mainly to Mn transport in and out of brain as opposed to partial sequestration of Mn in subcellular pools. The Mn bioelimination rate from the rat brain — as assessed by MEMRI — was significantly faster than that reported in earlier studies using radioisotope techniques. This difference many be attributed to the much higher doses typically used in MEMRI studies; concentrations that greatly exceed the saturation threshold of binding sites that could potentially sequester Mn over the long term. The R1 and R2 relaxation rates are linearly proportional to the underlying tissue Mn concentration and reflect the total absolute amount of Mn present in the tissue. Finally, the results of these studies provide additional confidence that MEMRI can be used as a useful tool for quantitatively estimating cerebral Mn concentration following intravenous administration of large doses of MnCl2.
Acknowledgements
The authors thank Nadia Bouraoud for assisting animal procedures and Steve Dodd for MRI hardware support. This research was supported (in part) by the Intramural Research Program of the National Institutes of Health (NIH) and the National Institute of Neurological Disorders and Stroke (NINDS). Sabbatical leave support from Worcester Polytechnic Institute to C. Sotak while on leave to NINDS, NIH is gratefully acknowledged.
Footnotes
Presented at the 16th Annual Meeting of the ISMRM, Toronto, Ontario, Canada, 2008.
References
- 1.Takeda A. Manganese action in brain function. Brain Res Brain Res Rev. 2003;41(1):79–87. doi: 10.1016/s0165-0173(02)00234-5. [DOI] [PubMed] [Google Scholar]
- 2.Normandin L, Hazell AS. Manganese neurotoxicity: an update of pathophysiologic mechanisms. Metab Brain Dis. 2002;17(4):375–387. doi: 10.1023/a:1021970120965. [DOI] [PubMed] [Google Scholar]
- 3.Gavin CE, Gunter KK, Gunter TE. Mn2+ sequestration by mitochondria and inhibition of oxidative phosphorylation. Toxicol Appl Pharmacol. 1992;115(1):1–5. doi: 10.1016/0041-008x(92)90360-5. [DOI] [PubMed] [Google Scholar]
- 4.Takeda A, Sawashita J, Okada S. Biological half-lives of zinc and manganese in rat brain. Brain Res. 1995;695(1):53–58. doi: 10.1016/0006-8993(95)00916-e. [DOI] [PubMed] [Google Scholar]
- 5.Aoki I, Wu YJ, Silva AC, Lynch RM, Koretsky AP. In vivo detection of neuroarchitecture in the rodent brain using manganese-enhanced MRI. Neuroimage. 2004;22(3):1046–1059. doi: 10.1016/j.neuroimage.2004.03.031. [DOI] [PubMed] [Google Scholar]
- 6.Liu CH, D’Arceuil HE, de Crespigny AJ. Direct CSF injection of MnCl2 for dynamic manganese-enhanced MRI. Magn Reson Med. 2004;51(5):978–987. doi: 10.1002/mrm.20047. [DOI] [PubMed] [Google Scholar]
- 7.Gavin CE, Gunter KK, Gunter TE. Manganese and calcium efflux kinetics in brain mitochondria. Relevance to manganese toxicity. Biochem J. 1990;266(2):329–334. doi: 10.1042/bj2660329. [DOI] [PMC free article] [PubMed] [Google Scholar]
- 8.Wardeska JG, Viglione B, Chasteen ND. Metal ion complexes of apoferritin. Evidence for initial binding in the hydrophilic channels. J Biol Chem. 1986;261(15):6677–6683. [PubMed] [Google Scholar]
- 9.Chuang KH, Koretsky A. Improved neuronal tract tracing using manganese enhanced magnetic resonance imaging with fast T(1) mapping. Magn Reson Med. 2006;55(3):604–611. doi: 10.1002/mrm.20797. [DOI] [PubMed] [Google Scholar]
- 10.Venkatesan R, Lin W, Gurleyik K, He YY, Paczynski RP, Powers WJ, Hsu CY. Absolute measurements of water content using magnetic resonance imaging: preliminary findings in an in vivo focal ischemic rat model. Magn Reson Med. 2000;43(1):146–150. doi: 10.1002/(sici)1522-2594(200001)43:1<146::aid-mrm18>3.0.co;2-l. [DOI] [PubMed] [Google Scholar]
- 11.Lee DY, Johnson PE. Factors affecting absorption and excretion of 54Mn in rats. J Nutr. 1988;118(12):1509–1516. doi: 10.1093/jn/118.12.1509. [DOI] [PubMed] [Google Scholar]
- 12.Bock NA, Paiva FF, Nascimento GC, Newman JD, Silva AC. Cerebrospinal fluid to brain transport of manganese in a non-human primate revealed by MRI. Brain Res. 2008;1198:160–170. doi: 10.1016/j.brainres.2007.12.065. [DOI] [PMC free article] [PubMed] [Google Scholar]
- 13.Sotak CH, Sharer K, Koretsky AP. Manganese cell labeling of murine hepatocytes using manganese(III)-transferrin. Contrast Media Mol Imaging. 2008 Jun 10; doi: 10.1002/cmmi.235. DOI: 10.1002/cmmi.235. [DOI] [PMC free article] [PubMed] [Google Scholar]
- 14.Silva AC, Lee JH, Aoki I, Koretsky AP. Manganese-enhanced magnetic resonance imaging (MEMRI): methodological and practical considerations. NMR Biomed. 2004;17(8):532–543. doi: 10.1002/nbm.945. [DOI] [PubMed] [Google Scholar]
- 15.Kang YS, Gore JC. Studies of tissue NMR relaxation enhancement by manganese. Dose and time dependences. Invest Radiol. 1984;19(5):399–407. doi: 10.1097/00004424-198409000-00012. [DOI] [PubMed] [Google Scholar]
- 16.Nordhøy W, Anthonsen HW, Bruvold M, Brurok H, Skarra S, Krane J, Jynge P. Intracellular manganese ions provide strong T1 relaxation in rat myocardium. Magn Reson Med. 2004;52(3):506–514. doi: 10.1002/mrm.20199. [DOI] [PubMed] [Google Scholar]
- 17.Jallon JM, Cohn M. Temperature dependence of binding constants of Mn(II) to ADP and ATP. Biochim Biophys Acta. 1970;222(2):542–545. doi: 10.1016/0304-4165(70)90151-0. [DOI] [PubMed] [Google Scholar]
- 18.Nordhøy W, Anthonsen HW, Bruvold M, Jynge P, Krane J, Brurok H. Manganese ions as intracellular contrast agents: proton relaxation and calcium interactions in rat myocardium. NMR Biomed. 2003;16:82–95. doi: 10.1002/nbm.817. [DOI] [PubMed] [Google Scholar]