

Abstract
Hemispheric lateralization of early event-related potentials (ERPs; e.g. N1) is largely based on anatomy of the afferent pathway; lateralization of later auditory ERPs (P2/N2, P250, P3b) is less clear. Using 257-channel EEG, the present study examined hemispheric laterality of auditory ERPs by comparing binaural and monaural versions of an auditory oddball task. N1 showed a contralateral bias over auditory cortex in both hemispheres as a function of ear of stimulation, although right hemisphere sources were activated regardless of which ear received input. Beginning around N1 and continuing through the time of P3b, right hemisphere temporal-parietal and frontal areas were more activated than their left hemisphere counterparts for stimulus evaluation/comparison and target detection. P250 and P3b component amplitudes, topographies, and source estimations were significantly influenced by ear of stimulation, with right hemisphere activity being stronger. This was particularly true for anterior temporal and inferior frontal sources which were more strongly associated with the later, more cognitive components (P250, P3b). Results are consistent with theories of a right hemisphere network that is prominently involved in sustained attention, stimulus evaluation, target detection, and working memory/context updating.
Keywords: ERP, N1, P2, N2, P250, P300, laterality, attention
Introduction
Cerebral hemispheric asymmetries in cognitive function have been the subject of numerous neuroscience investigations. Auditory event-related potential (ERP) studies have provided important information about the stages at which lateralization occurs. Early in auditory processing, laterality of function is related to laterality of the afferent pathway from the periphery to the cortex (Näätänen & Picton, 1987; Pantev, Lutkenhoner, Hoke, & Lehnertz, 1986; Reite, Zimmerman, & Zimmerman, 1981). Lateralization of later stages of neural processing, however, is less clear. For instance, it is uncertain whether the P2/N2 and/or P3 components, all of which are associated with higher-level cognitive functions, are prominently lateralized. Addressing this issue could aid understanding of neural mechanisms supporting cognition and highlight the importance of interhemispheric communication on ERPs, especially within clinical populations (Bruder et al., 2002; Ford, 1999; Frodl et al., 2001; Jerger & Lew, 2004; Polich & Corey-Bloom, 2005).
N1, an early ERP component occurring around 100 ms post-stimulus is significantly determined by characteristics of the incoming stimulus (Clementz, Barber, & Dzau, 2002; Huotilainen et al., 1998; Näätänen & Picton, 1987; Teder, Alho, Reinikainen, & Näätänen, 1993; Woldorff et al., 1993). The neural sources of N1 are heavily dependent on the anatomical structure of the auditory pathway (Näätänen, 1992; Pantev et al., 1986). While auditory input travels to both contra- and ipsi-lateral auditory cortices, the contralateral projections are far stronger and more preponderant (Demanez & Demanez, 2003; Reser, Fishman, Arezzo, & Steinschneider, 2000; Tervaniemi & Hugdahl, 2003). N1, therefore, occurs earlier and with greater amplitude in auditory cortex contralateral to the ear of stimulation (Näätänen & Picton, 1987; Pantev et al., 1986; Reite et al., 1981; Virtanen, Ahveninen, Ilmoniemi, Näätänen, & Pekkonen, 1998).
Following early auditory registration, task-specific processing begins, with components P2, N2, and P250 indexing stimulus evaluation and classification processes. P2 and P250 are theorized to represent attention-modulated stimulus classification processes (Crowley & Colrain, 2004; Garcia-Larrea, Lukaszewicz, & Mauguiere, 1992; Reinvang, Nordby, & Nielsen, 2000). N2 also indexes stimulus classification and identification processes; however, N2 is evoked primarily by a deviation from the ongoing context (Näätänen & Gaillard, 1983; Patel & Azzam, 2005). These components have distributed neural sources in anterior and superior temporal cortex (Godey, Schwartz, de Graaf, Chauvel, & Liegeois-Chauvel, 2001; Potts, Dien, Hartry-Speiser, McDougal, & Tucker, 1998). There are few reports, however, addressing laterality effects for these components. Intracranial recordings suggest that both P2 (Di & Barth, 1993) and N2 (Clarke, Halgren, & Chauvel, 1999) have neural sources in both hemispheres. Scalp-recorded ERP studies, however, suggest that P2 sources may be more prominent in right hemisphere and N2 sources may be more prominent in left hemisphere (Alexander et al., 1996). Thus, the neural circuitry supporting the cognitive functions associated with P2, N2, and P250 generation is unclear.
Subsequent to stimulus evaluation/classification, detection of stimuli that deviate from the ongoing context elicits a P3 (see Linden, 2005; Soltani & Knight, 2000 for reviews). The auditory P3 is most commonly elicited during an oddball task, which requires detection of a low probability tone embedded within a series of high-probability “standard” tones. Successful detection of the low-probability (target) events requires context-dependent processing. Amplitude of the P3b component of the P3 complex, elicited by detection of a task-relevant target, is theorized to reflect context updating in working memory and the generation of subjective expectancies related to the probability of target occurrence (Donchin & Coles, 1988; Duncan-Johnson & Donchin, 1977). P3 latency indexes the speed with which the brain accurately classifies a task-relevant target (Dien, Spencer, & Donchin, 2004; Kutas, McCarthy, & Donchin, 1977). Cortical generators of the P3 ostensibly reside in temporo-parietal junction, anterior cingulate and prefrontal cortices, while secondary auditory cortices may contribute specifically to auditory P3 generation (Halgren, Marinkovic, & Chauvel, 1998; Linden, 2005; Soltani & Knight, 2000).
Reports vary on the degree of P3’s hemispheric lateralization: greater in right hemisphere (Alexander et al., 1996; Cohen, Ji, Chorlian, Begleiter, & Porjesz, 2002; Kok & Rooyakkers, 1986; Oades, Zerbin, & Dittmann-Balcar, 1995; Stevens, Calhoun, & Kiehl, 2005; Yoshiura et al., 1999), greater in left hemisphere (Morstyn, Duffy, & McCarley, 1983), or bilaterally symmetric (Bolsche, MacCrimmon, & Kropf, 1996; Clarke et al., 1999; DeFrance et al., 1993; Downs, Hymel, & Cranford, 2001; Kiehl, Laurens, Duty, Forster, & Liddle, 2001). Important findings regarding P3’s hemispheric lateralization come from unilateral stimulation studies. If P3 sources are more prominent in one hemisphere, unilateral stimulation should differentially affect P3 generation as a function of stimulated ear. Bilaterally symmetric P3s, however, should result in a source structure that is independent of stimulated ear. Studies using unilateral stimuli have reported bilaterally symmetric P3’s (Bolsche et al., 1996; Clarke et al., 1999; DeFrance et al., 1993; Downs et al., 2001), suggesting that interhemispheric communication may determine P3 generation.
Some theories indicate that as cognitive functions become more complex, neural sources in both cerebral hemispheres may be engaged more equally to generate the component of interest. Functional lateralization has also been found, however, for some higher-level cognitive operations (e.g., Corbetta & Shulman, 2002). The present study sought to systematically examine the laterality of ERP generation as a function of component latency during an oddball task using both bilateral and unilateral auditory stimulation. Dense array (257-channel) EEG was used to measure evoked brain activity; source distributions associated with primary auditory cortex (N1) and distributed cortical responses characteristic of more complex cognitive components (e.g., P2/N2, P250, P3) were estimated using minimum norm analyses. Early processing of unilateral stimulation should occur initially and predominantly in contralateral auditory cortex, and should manifest as differences in laterality for the N1 response. To the extent that both hemispheres are equally required for generation of later components (P2, N2, P250, P3), ear of stimulation effects should be absent, and strengths of neural activities supporting these responses should be roughly equivalent in the two hemispheres.
Materials and Methods
Participants
Twelve healthy, normal-hearing University of Georgia students (Mean age = 25 years, SD = 4; 7 females; 11 right-handed) participated in this study. Participants provided informed consent and received partial class credit for their participation. This study was approved by the Institutional Review Board at the University of Georgia.
Stimuli and procedure
Stimuli were sine wave tones of 1 kHz and 2 kHz (100 ms duration, 5 ms rise/fall) created using NCH tone generator software (Version 2.0; NCH Swift Sound, Bruce, Australia) and Sound Forge audio editing software (Version 6.0; Sony Media Software, Madison, WI). Tones were delivered through Etymotic insert earphones (Etymotic Research, Elk Grove Village, IL) at 76 dB SPL.
Binaural, left monaural and right monaural versions of an auditory oddball task were used. In all three tasks, the standard (1 kHz) tones and target (2 kHz) tones were presented with 0.80 and 0.20 probabilities, respectively. Tones were quasi-randomly presented, with a 1 s ISI, such that no fewer than two and no more than six standard tones occurred between targets. In each of the three versions of the task, there were 604 total trials presented in six blocks: two blocks of 100 trials (20 targets), two blocks of 82 trials (16 targets), and two blocks of 120 trials (24 targets). The binaural and monaural versions of the task were each presented separately, i.e. they were not interleaved. Task order and version was randomized and counterbalanced between subjects. Participants were instructed to focus on a fixation cross presented on a computer screen 80 cm in front of them, and to silently count the number of target tones, restarting their count after each break between blocks. Participants’ counts were recorded after each block.
EEG data recording and screening
EEG data were recorded vertex-referenced using a 256-sensor Geodesic Sensor Net and NetAmps 200 amplifiers (Electrical Geodesics; EGI, Eugene, OR). The sensor net was adjusted until all pedestals were properly seated on the scalp (i.e., not sitting on thick mats of hair that could result in bridging between sensors, e.g., Greischar et al., 2004). Individual sensor impedances were adjusted until they were below 50 kΩ (Ferree, Luu, Russell, & Tucker, 2001). In addition, an electrolyte bridge test was conducted between all pairs of sensors prior to recording (Tenke & Kayser, 2001), and, if there was evidence of bridging, sensors were adjusted until bridging was no longer evident (this was rarely required). Data were sampled at 500 Hz with an analog filter bandpass of 0.1–200 Hz.
Data were pre-processed following recommendations (with minimal modification) made by Junghofer, Elbert, Tucker, and Rockstroh (2000). Raw data were visually inspected offline for bad sensor recordings and individual trials containing eye blink, horizontal eye movement, or cardiac artifacts. Bad sensors were interpolated (no more than 5% of sensors for any subject) using a spherical spline interpolation method as implemented in BESA 5.1 (MEGIS Software, Gräfelfing, Germany). Blinks, horizontal eye movements, and cardiac artifacts were automatically corrected using a spatial filtering algorithm in BESA (Berg & Scherg, 1994; Ille, Berg, & Scherg, 2002). Data were then transformed to an average reference and filtered from 0.1–30 Hz (6 dB/octave rolloff).
After these adjustments, trials with activity greater than 100 μV were automatically eliminated from further processing. The overall number of usable trials (90% of targets, 87% of standards) remaining after these steps did not differ between conditions. Trials consisted of 1000 ms epochs, beginning 250 ms prior to stimulus presentation, averaged within each of the binaural, left monaural and right monaural conditions according to whether the stimulus was a standard or a target. The data were baseline-adjusted using the prestimulus period. Figure 1 shows the data for standards and targets, averaged over ear of stimulation conditions, at midline electrodes Fz, Cz, and Pz.
Figure 1.

Grand-averaged ERP data for targets (solid lines) and standards (dashed lines), averaged over ear of stimulation conditions, for midline channels Fz, Cz, and Pz. Negative is up.
Analyses of ERP voltage data
Component latency identification and statistical analyses of voltage data were performed using programs written in Matlab (Version 7.0, MathWorks, Natick, MA); source estimation was performed using BESA. First, to identify components above baseline noise level, global field power (GFP) plots were derived for every subject and condition. Grand averaged GFP plots were generated by averaging over all subjects within a condition. There were identifiable peaks for each condition around 100 (N1), 180 (P2/N2), 250 (P250), and 330 (P3b) ms post-stimulus (see Figure 1). To score the latency of these components for each condition, the individual subject GFP plots were compared to the grand averaged GFP plots by condition. For each component, the peak in the individual plot that was closest in time to the grand averaged peak was identified, and its time of occurrence was used to quantify the component latency.
Statistical comparisons of scalp potential amplitudes were conducted for each of the components. Scalp potentials were averaged within a time window centered on the mean latency of each component (for N1 a 20 ms window, for all later components a 40 ms window). For each component, a repeated measures ANOVA with factors Stimulus (target, standard) and Ear of stimulation (binaural, left monaural, right monaural) was conducted separately for each sensor (257 total sensors, including the reference). To compensate for any violations of the sphericity assumption, Huynh-Feldt epsilon (ε) degrees of freedom adjustment was used.
Because multi-sensor EEG data result in significant activations of multiple sensors that are in close spatial proximity, a cluster threshold technique (see Gilmore, Clementz, & Buckley, 2005; Krusemark, Keith Campbell, & Clementz, 2008, for examples) was used to control for possible increases in Type I error as a result of performing multiple comparisons (e.g., Forman et al., 1995). Traditional Bonferroni correction is inappropriately conservative with brain activity data, so alternative methods have been developed to manage the multiple comparison problem (e.g., Kilner, Kiebel, & Friston, 2005; Worsley, 2003). One such method, cluster thresholding (e.g., Forman et al., 1995), integrates the probability of significance for an individual source or sensor location with that for a cluster of such locations. Cluster thresholding is done because real brain activations are likely to result in correlated changes in clusters of sources and/or sensors. The following statistical significance rules were determined based on the noise level of the data (estimated from the prestimulus baseline) and Monte Carlo simulations calculated using AlphaSim (Cox, 1996). To maintain the familywise alpha lower than .01 within a comparison, the following conditions needed to be met: (1) an individual test at a single time point for a given sensor was significant at p < .035; (2) at least six other neighboring sensors were statistically significant at p < .035.
Simple effects were then evaluated within those areas that showed significant differences. For clusters in which there was a significant main effect of Ear of stimulation, scalp potentials were averaged over sensors within that cluster then collapsed across standards and targets, separately for each Ear of stimulation condition. Simple effects between binaural, left ear, and right ear stimulation were evaluated using pairwise t-tests with Bonferroni corrected alpha levels (p ≤ .0167; familywise alpha of 0.05, 3 comparisons). Likewise, for clusters in which there was a significant interaction, scalp potentials were averaged for sensors within that cluster, separately for standards and targets within each ear of stimulation condition. Simple main effects were evaluated with one-way repeated measures ANOVA, separately for standards and targets, followed by pairwise t-tests if the simple main effect analysis was significant.
Source analysis
Source analyses were performed in order to estimate the source activity associated with the voltage differences observed at the sensors. ERP responses were modeled using L2 minimum norm estimation (MNE, Hämäläinen & Ilmoniemi, 1984). For the minimum norm approach, the source configuration is fixed a priori (fixed source locations are specified on the surface from which EEG signals emanated; e.g., the cerebral cortex). Given the measured data, source strength values are estimated for each location at each time point. In BESA 5.1, 713 locations are evenly distributed on the surface of a smoothed standard MRI of the brain. At each location, sources are located 10% and 30% below the cortical surface (for a total of 1426 sources). The source used at each location in the final analyses is the one with the largest magnitude.
In order to further illustrate the effects observed in the potential amplitudes recorded at the sensors, MNE analyses were performed in three ways: 1) for main effects of stimulus (i.e. a difference between the scalp potential amplitudes in response to targets and standards), MNE was performed on the difference wave created by subtracting the ERP waveform in response to standards (averaged across ear of stimulation conditions) from the ERP in response to targets, 2) for main effects of ear of stimulation, MNE was performed on ERP data averaged across targets and standards, separately for left ear, right ear, and binaural stimuli, and 3) for any interaction effects, MNE was performed on ERP data for each individual condition (i.e. left ear targets, left ear standards, binaural targets, binaural standards, right ear targets, and right ear standards).
Results
Percentage of correct target identification
There were no significant differences in the percentage of targets correctly identified as a function of ear of stimulation, as revealed by a one-way ANOVA (binaural M=99.3%, SD=1.1; left M=99.4%, SD=1.0; right M=99.3%, SD=1.1; F(2,33)=0.10, p=0.91).
ERP latencies
Differences in latencies were evaluated (see Table 1), separately for each component, using repeated measures ANOVA with factors Stimulus (target, standard) and Ear of stimulation (binaural, left monaural, right monaural). There was a main effect of Stimulus for N1, F(1,11)=5.55, p=0.04 (targets occurred later than standards). There was a main effect of Ear for P250, F(2,22)=8.219, p < .01, ε = 0.70, with shorter latencies to left ear stimulation. There were no significant interactions on component latencies.
Table 1. Mean (with SD) ERP component latencies (in ms) of Standards and Targets for each Ear of Stimulation condition.
| Standards |
Targets |
|||||
|---|---|---|---|---|---|---|
| Component | Left | Binaural | Right | Left | Binaural | Right |
| N1 | 105.1 (7.3) | 102.5 (6.4) | 103.0 (8.6) | 107.8 (9.9) | 107.8 (9.4) | 108.0 (7.2) |
| P2/N2 | 177.9 (15.3) | 176.7 (24.1) | 183.4 (18.2) | 177.2 (25.8) | 185.9 (27.0) | 176.0 (16.8) |
| P250 | 241.7 (16.4) | 267.3 (24.6) | 261.7 (15.4) | 254.1 (18.4) | 265.2 (31.9) | 253.9 (10.3) |
| P3b | 332.7 (19.3) | 339.2 (21.2) | 330.0 (15.9) | 346.5 (24.1) | 337.6 (22.9) | 336.4 (26.5) |
ERP amplitudes and source analyses
Table 2 summarizes the significant results found for each ERP component and includes the mean potential amplitudes averaged over sensors within each cluster for which significant effects were found. For each component, results of analyses on scalp potentials will be presented first, followed by the source analysis results for that component.
Table 2. Summary of significant results for ERP component amplitudes.
Values are mean potential amplitudes (with standard errors; values in μV) averaged over sensors within each cluster for which significant effects were found.
| Main Effect of Stimulus |
Main Effect of Ear |
Interaction |
|||||||||||
|---|---|---|---|---|---|---|---|---|---|---|---|---|---|
| Component | Area | T | St | Area | L | Bi | R | Sig. Effects | Area | L-T | Bi-T | R-T | Sig. Effects |
| N1 | Sup | −1.38 (.17) | 0.78 (.11) | LH Temp | −0.45 (.10) | −0.63 (.14) | −0.78 (.16) | R > L | LH Temp | −0.44 (.16) | −0.76 (.22) | −0.92 (.20) | Bi-T > L-T; R-T > L-T |
| Inf | 0.93 (.24) | 0.49 (.13) | RH Temp | −0.38 (.09) | −0.44 (.09) | −0.20 (.08) | Bi > R; L > R | RH Temp | 0.35 (.16) | 0.56 (.20) | 0.69 (.20) | R-T > L-T | |
| P2/N2 | Sup | 0.27 (.16) | 0.37 (.09) | ||||||||||
| Inf | 0.28 (.13) | 0.19 (.09) | |||||||||||
| P250 | Sup | 1.76 (.10) | 0.25 (.03) | LH Temp-Par | 0.28 (.08) | 0.63 (.10) | 0.62 (.08) | Bi > L; R > L | |||||
| Inf | −1.69 (.14) | 0.02 (.03) | |||||||||||
| P3b | Sup | 1.59 (.07) | −0.05 (.03) | LH Temp-Par | 0.26 (.14) | 0.56 (.11) | 0.70 (.15) | Bi > L; R > L | |||||
| Inf | −1.91 (.17) | −0.02 (.04) | RH Temp-Par | 0.78 (.17) | 0.71 (.14) | 0.44 (.19) | L > R | ||||||
T=Targets, St=Standards
L=Left Ear, Bi=Binaural, R=Right Ear
RH=Right Hemisphere, LH=Left Hemisphere
Sup=Superior, Inf-Inferior, Temp=Temporal, Par=Parietal
Effects of stimulus
For each component, there was a main effect of Stimulus. Figure 2 illustrates that, for all components, there were two groups of sensors within which this effect occurred: one group on the superior aspect of the scalp and one on the inferior aspect. The main effects of Stimulus resulted from more extreme amplitude (whether positive or negative) in response to the targets (see Table 2 for mean potential amplitudes in these groups of sensors).
Figure 2.
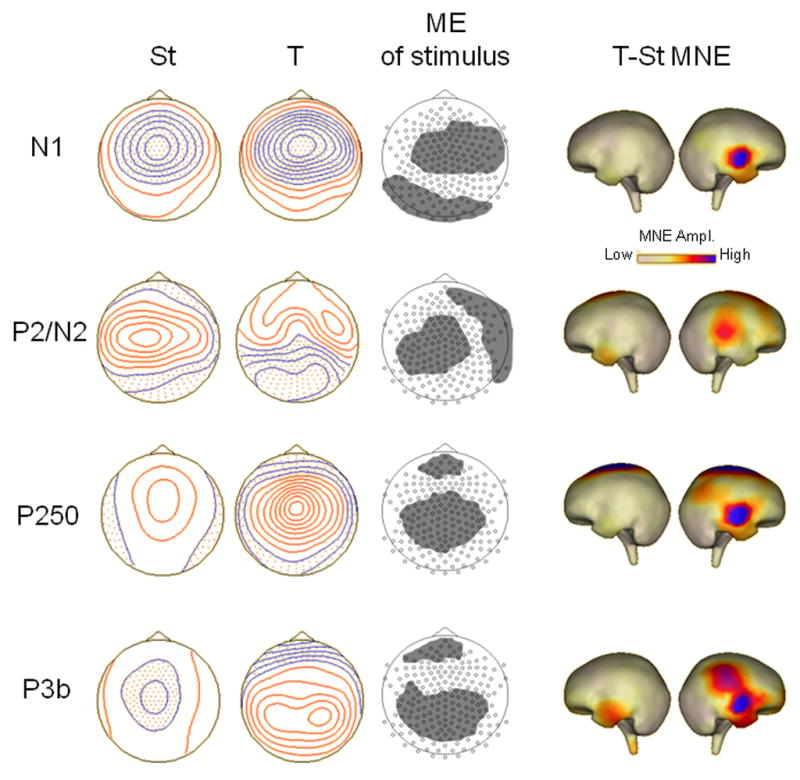
ERP components for which a main effect of stimulus was found. First two columns show top-down meridian maps of scalp potentials for each ERP component separately for standards (St) and targets (T), averaged over Ear of stimulation conditions. Positive isopotential lines are in red, negative isopotential lines are in blue; isopotential line scales are: .32 μV/step for N1 and P250, .16 μV/step for P2/N2, and .20 μV/step for P3b. Third column shows clusters of sensors, indicated by gray areas, within which significant ANOVA/cluster thresholding effects of stimulus were found (see Table 2 for the mean potential amplitudes averaged over sensors within each cluster). Last two columns show cortical maps (for left and right hemispheres) of minimum norm estimation (MNE) source analysis performed on the target minus standard difference ERP waveform. MNE maps are all on the same scale (in nA/m2 units).
MNE performed on the target-standard difference wave indicated that target-specific brain activity was stronger in right hemisphere for all ERP components (see Figure 2). For N1, this activity occurs over auditory cortex. For P2/N2, the stronger right hemisphere activity to targets was largely from temporal-parietal areas. P250 and P3b had similar areas of activity in anterior temporal lobe, stronger in right hemisphere, to targets. Additionally, P250 source analyses showed activity in superior fronto-central cortex, while P3b showed activity in right hemisphere supramarginal/angular gyrus.
Effects of Ear
Effects of Ear of Stimulation are illustrated in Figure 3. N1 showed a main effect of Ear in sensors over auditory cortex bilaterally. In left hemisphere, right ear stimuli elicited more extreme negative potential amplitudes than left ear stimuli, t(11)=4.15, p < 0.01 (see Table 2 for mean potential amplitudes in groups of sensors within which significant effects of Ear were found). Binaural condition amplitudes did not differ from those for the monaural conditions in left hemisphere. In right hemisphere, binaural and left ear conditions did not differ, but both had more extreme negative potential amplitudes than right ear stimuli: binaural, t(11)=3.40, p < 0.01; left ear, t(11)=2.70, p=0.01. There were also Stimulus by Ear of stimulation interactions in similar left and right hemisphere sensor groups. For the left hemisphere group, there was a significant simple main effect for responses to targets, F(2,22)=14.32, p < 0.01, in which binaural and right ear conditions had more extreme negative potentials than did the left ear condition: binaural, t(11)=3.39, p < 0.01; right ear, t(11)=4.65, p < 0.01. For right hemisphere, there was also a significant simple main effect of targets, F(2,22)= 5.125, p=0.02: right ear stimuli had more extreme positive potential amplitudes than left ear stimuli, t(11)=2.75, p < 0.01, but the binaural condition did not differ significantly from the monaural conditions. For both the main effect of ear and the interaction, MNE source analyses illustrated bilateral auditory cortex activity that was stronger in right hemisphere, regardless of which ear(s) received stimulation (see Figure 3 for the source locations).
Figure 3.
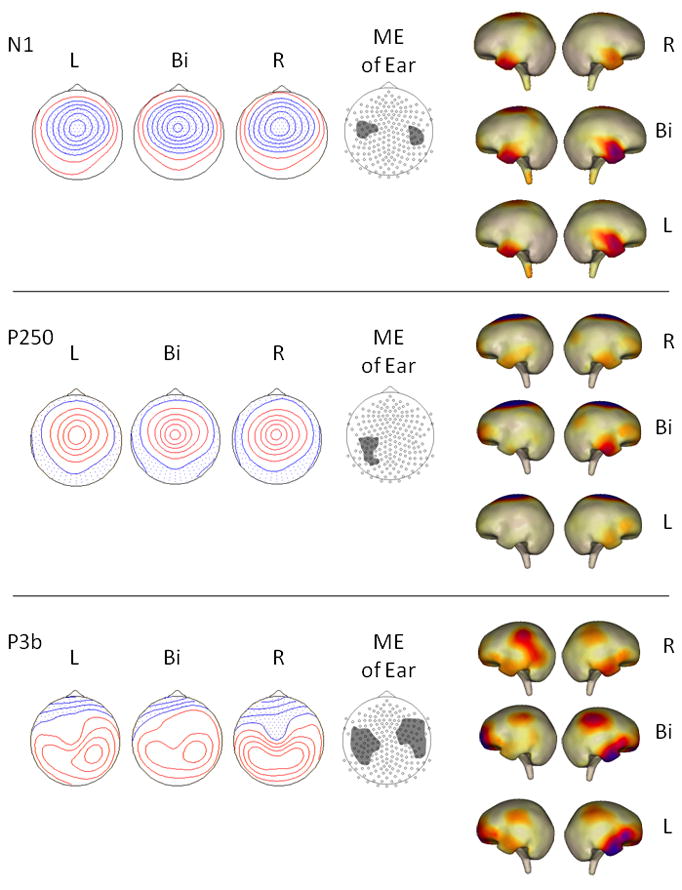
ERP components for which a main effect of Ear of stimulation was found. First three columns show top-down meridian maps of scalp potentials for each ERP component separately for left ear (L), binaural (Bi), and right ear (R) stimulus presentation, averaged over standards and targets. Isopotential line scales are: .40 μV/step for N1 and P250, .13 μV/step for P3b. Third column shows clusters of sensors within which significant ANOVA/cluster thresholding effects of Ear of stimulation were found (see Table 2 for the mean potential amplitudes averaged over sensors within each cluster). Last two columns show cortical maps of MNE source analysis performed on ERPs for each Ear condition, averaged over standards and targets.
For the P2/N2, there were neither significant effects involving Ear of stimulation nor an interaction. Following the P2/N2, a centrally maximum P250 was evident in response to both standards and, more strongly, to targets (see e.g. Figures 1 and 2). For P250, there was a main effect of Ear in a sensor group over the left hemisphere temporo-parietal region (see Figure 3). Binaural and right ear conditions did not differ; however, both had stronger positive potentials than did the left ear condition: binaural, t(11)=3.71, p < 0.01; right ear, t(11)=3.19, p < 0.01. Following P250, target stimuli elicited the classic P3b response. For P3b, there was an effect of Ear for sensor groups over both left and right hemisphere temporo-parietal regions (see Figure 3). Over left hemisphere, potentials elicited by binaural and right ear conditions did not differ, while both differed from the left ear condition: binaural, t(11)=3.16, p < 0.01; right ear, t(11)=3.49, p < 0.01. Over right hemisphere, potentials elicited by binaural stimulation did not differ from either left ear or right ear conditions, while left and right ear conditions did significantly differ from each other, t(11)=3.37, p < 0.01. Right ear stimuli elicited a more bilaterally symmetric topography than did the other two conditions.
MNE source analyses at the time of P250 showed areas of activity over superior central cortex and anterior temporal/inferior frontal lobes for all three Ear of stimulation conditions (Figure 3). This anterior temporal/inferior frontal activity in left hemisphere was evident in response to binaural and, more strongly, right ear input. There was right hemisphere activity, however, regardless of the ear of stimulation. P3b showed bilateral activity in temporal-parietal junction, as well as activity in anterior temporal/inferior frontal cortex that was stronger in right hemisphere for all three Ear of stimulation conditions (Figure 3).
Discussion
This study examined the hemispheric laterality of ERPs elicited in an auditory oddball task. Throughout stimulus processing, ERP components were sensitive both to task-relevant instructions, as evidenced by consistently larger potentials and cortical source activity estimates to targets, and to ear of stimulation. Apparently, during the auditory oddball task, both bottom-up and top-down processes are affected by how information is initially registered in the auditory sensory apparatus.
The present study demonstrated that both early and late stage auditory processing were sensitive to which ear(s) received direct stimulation. Around the time of N1, ERPs recorded at the scalp corresponded to the amount of direct input, such that bilateral and contralateral responses were stronger than ipsilateral responses in both hemispheres. MNE source analyses demonstrated, however, that right hemisphere tended to be more equally engaged regardless of ear of stimulation, while left hemisphere activity depended more on the afferent path from ear to cortex (see also Clementz, Dzau, Blumenfeld, Matthews, & Kissler, 2003 for a similar effect with MEG data).
Beginning around the time of N1 and continuing through the time of P3b, right hemisphere was prominently involved in stimulus processing. The present study found: 1) consistently stronger target-specific cortical activity in right temporal and parietal areas, 2) significant differences as a function of ear of stimulation over temporo-parietal cortices for N1 (cf. Clementz et al., 2003), 3) consistently stronger cortical activity in right hemisphere temporal, parietal, and frontal areas beginning around the time of P2/N2, and 4) right lateralized scalp potentials at the time of P3b regardless of which ear received stimulation. This pattern may be related to recent descriptions of a right hemisphere temporal-parietal/prefrontal cortex network associated with sustained attention, working memory, and the abilities to identify salient features of incoming stimuli and determine their task-relevance (Corbetta & Shulman, 2002; Downar, Crawley, Mikulis, & Davis, 2001; Pardo, Fox, & Raichle, 1991; Stevens et al., 2005). Prominent right hemisphere involvement in deviance detection also has been theorized for the mismatch negativity ERP component which occurs around the time of the N2 (Giard, Perrin, Pernier, & Bouchet, 1990; Paavilainen, Alho, Reinikainen, Sams, & Näätänen, 1991).
Following the P2 and N2 components, a centrally maximal positive deflection occurred around 250 ms poststimulus in response to both standards and, more prominently, to targets. This component, as observed in the present study, resembles the P250 proposed by Garcia-Larrea et al. (1992) in latency, morphology, and, perhaps, functional correlates. While some researchers have interpreted P250 as analogous to the P3a (e.g. Brown, Clarke, & Barry, 2007), there are subtle differences which leave open its interpretation. Unlike the frontally maximal P3a, which is primarily an index of attention-orienting processes (Linden, 2005; Soltani & Knight, 2000), P250 has a central-parietal maximum and is theorized to index a top-down stimulus classification process (Garcia-Larrea et al., 1992), whereby incoming stimuli are evaluated and identified as a target or standard. Upon identification of a target, cognitive processing continues and a P3b is evoked; otherwise, identification of a standard ends the evaluation process (Garcia-Larrea et al., 1992). P250 amplitude was shown to be greater during easy discrimination tasks, when more attention could be allocated to both non-targets and targets for stimulus classification. The presence of a central-parietal P250 to both standards and targets in the present study is in accordance with this hypothesis: due to the relative ease with which stimuli could be discriminated, all stimuli were attended and classified. When the stimulus was classified a target, a large amplitude P250 was evoked, followed by, and partially overlapping, a P3b. Right hemisphere also appeared to play an important role in P250 generation: right temporal and frontal sources were active regardless of the laterality of auditory input, while left hemisphere sources were apparent only when receiving direct input from right ear or via binaural stimulation.
Right hemisphere also seems to be more prominently engaged during the working memory context updating processes indexed by P3b. Scalp topographies were more similar over right than over left hemisphere, driven by the right lateralized potentials to left ear stimulation and more bilateral distribution of right ear stimulation. MNE source analyses revealed that, while anterior temporal and inferior frontal sources were indeed more strongly lateralized to right hemisphere regardless of ear of stimulation, superior temporal-parietal sources were more bilaterally symmetric. Task-relevant stimuli, therefore, may engage a network responsible for target detection and working memory updating, with right temporal/frontal sources persisting throughout (P250 and P3b) and bilateral temporal-parietal sources also contributing to the later P3b.
ERPs elicited during an auditory oddball task were shown to be sensitive to the laterality of stimulus presentation. The N1 component depended upon both the architecture of the auditory pathway, as well as echoic memory comparison processes. Upon detection of stimulus deviance, a right hemisphere attention/working memory network seemed to be prominently involved in stimulus processing (Corbetta & Shulman, 2002). Generation of especially the later, more cognitive components appeared to be significantly determined by the need for engagement of right hemisphere. Implications of these findings are particularly important for investigations using clinical populations which have characteristic hemispheric asymmetries, interhemispheric communication dysfunction, and/or ERP abnormalities (Bruder et al., 2002; Ford, Mathalon, Kalba, Marsh, & Pfefferbaum, 2001; Frodl et al., 2001; Jerger & Lew, 2004). For instance, the problem may not be in either right or left hemisphere specifically, but in getting the correct information to the right hemisphere attention/working memory network. Impaired transfer of information to right hemisphere, either as a result of left hemisphere processing dysfunctions or interhemispheric communication problems, may underlie some ERP abnormalities observed among clinical populations.
Footnotes
Publisher's Disclaimer: This is a PDF file of an unedited manuscript that has been accepted for publication. As a service to our customers we are providing this early version of the manuscript. The manuscript will undergo copyediting, typesetting, and review of the resulting proof before it is published in its final citable form. Please note that during the production process errorsmaybe discovered which could affect the content, and all legal disclaimers that apply to the journal pertain.
Contributor Information
Casey S. Gilmore, Department of Psychology, University of Minnesota.
Brett A. Clementz, Departments of Psychology and Neuroscience, BioImaging Research Center, University of Georgia
Patrick Berg, Department of Psychology, Universität Konstanz.
References
- Alexander JE, Bauer LO, Kuperman S, Morzorati S, O’Connor SJ, Rohrbaugh J, et al. Hemispheric differences for P300 amplitude from an auditory oddball task. Int J Psychophysiol. 1996;21(2–3):189–196. doi: 10.1016/0167-8760(95)00047-x. [DOI] [PubMed] [Google Scholar]
- Berg P, Scherg M. A multiple source approach to the correction of eye artifacts. Electroencephalogr Clin Neurophysiol. 1994;90(3):229–241. doi: 10.1016/0013-4694(94)90094-9. [DOI] [PubMed] [Google Scholar]
- Bolsche F, MacCrimmon DJ, Kropf S. The effect of laterality of stimulus presentation on auditory P300 topography in schizophrenia. J Psychiatry Neurosci. 1996;21(2):83–88. [PMC free article] [PubMed] [Google Scholar]
- Brown CR, Clarke AR, Barry RJ. Auditory processing in an inter-modal oddball task: effects of a combined auditory/visual standard on auditory target ERPs. Int J Psychophysiol. 2007;65(2):122–131. doi: 10.1016/j.ijpsycho.2007.04.002. [DOI] [PubMed] [Google Scholar]
- Bruder GE, Kayser J, Tenke CE, Leite P, Schneier FR, Stewart JW, et al. Cognitive ERPs in depressive and anxiety disorders during tonal and phonetic oddball tasks. Clin Electroencephalogr. 2002;33(3):119–124. doi: 10.1177/155005940203300308. [DOI] [PubMed] [Google Scholar]
- Clarke JM, Halgren E, Chauvel P. Intracranial ERPs in humans during a lateralized visual oddball task: II. Temporal, parietal, and frontal recordings. Clin Neurophysiol. 1999;110(7):1226–1244. doi: 10.1016/s1388-2457(99)00064-4. [DOI] [PubMed] [Google Scholar]
- Clementz BA, Barber SK, Dzau JR. Knowledge of stimulus repetition affects the magnitude and spatial distribution of low-frequency event-related brain potentials. Audiol Neurootol. 2002;7(5):303–314. doi: 10.1159/000064444. [DOI] [PubMed] [Google Scholar]
- Clementz BA, Dzau JR, Blumenfeld LD, Matthews S, Kissler J. Ear of stimulation determines schizophrenia-normal brain activity differences in an auditory paired-stimuli paradigm. Eur J Neurosci. 2003;18(10):2853–2858. doi: 10.1111/j.1460-9568.2003.03027.x. [DOI] [PubMed] [Google Scholar]
- Cohen HL, Ji J, Chorlian DB, Begleiter H, Porjesz B. Alcohol-related ERP changes recorded from different modalities: a topographic analysis. Alcohol Clin Exp Res. 2002;26(3):303–317. [PubMed] [Google Scholar]
- Corbetta M, Shulman GL. Control of goal-directed and stimulus-driven attention in the brain. Nat Rev Neurosci. 2002;3(3):201–215. doi: 10.1038/nrn755. [DOI] [PubMed] [Google Scholar]
- Cox RW. AFNI: software for analysis and visualization of functional magnetic resonance neuroimages. Comput Biomed Res. 1996;29(3):162–173. doi: 10.1006/cbmr.1996.0014. [DOI] [PubMed] [Google Scholar]
- Crowley KE, Colrain IM. A review of the evidence for P2 being an independent component process: age, sleep and modality. Clin Neurophysiol. 2004;115(4):732–744. doi: 10.1016/j.clinph.2003.11.021. [DOI] [PubMed] [Google Scholar]
- DeFrance JF, Hymel C, Degionanni J, Kutyna F, Calkins DS, Estes S, et al. Evidence of temporal lobe activation by discriminative spatial orientation. Brain Topogr. 1993;6(2):137–142. doi: 10.1007/BF01191079. [DOI] [PubMed] [Google Scholar]
- Demanez JP, Demanez L. Anatomophysiology of the central auditory nervous system: basic concepts. Acta Otorhinolaryngol Belg. 2003;57(4):227–236. [PubMed] [Google Scholar]
- Di S, Barth DS. Binaural vs. monaural auditory evoked potentials in rat neocortex. Brain Res. 1993;630(1–2):303–314. doi: 10.1016/0006-8993(93)90670-i. [DOI] [PubMed] [Google Scholar]
- Dien J, Spencer KM, Donchin E. Parsing the late positive complex: mental chronometry and the ERP components that inhabit the neighborhood of the P300. Psychophysiology. 2004;41(5):665–678. doi: 10.1111/j.1469-8986.2004.00193.x. [DOI] [PubMed] [Google Scholar]
- Donchin E, Coles MG. Is the P300 component a manifestation of context updating? Behav Brain Sci. 1988;11:357–374. [Google Scholar]
- Downar J, Crawley AP, Mikulis DJ, Davis KD. The effect of task relevance on the cortical response to changes in visual and auditory stimuli: an event-related fMRI study. Neuroimage. 2001;14(6):1256–1267. doi: 10.1006/nimg.2001.0946. [DOI] [PubMed] [Google Scholar]
- Downs CR, Hymel MR, Cranford JL. Effects of monaural versus binaural stimulation on P300 scalp topography in elderly listeners. J Am Acad Audiol. 2001;12(1):1–6. [PubMed] [Google Scholar]
- Duncan-Johnson CC, Donchin E. On quantifying surprise: the variation of event-related potentials with subjective probability. Psychophysiology. 1977;14(5):456–467. doi: 10.1111/j.1469-8986.1977.tb01312.x. [DOI] [PubMed] [Google Scholar]
- Ferree TC, Luu P, Russell GS, Tucker DM. Scalp electrode impedance, infection risk, and EEG data quality. Clin Neurophysiol. 2001;112(3):536–544. doi: 10.1016/s1388-2457(00)00533-2. [DOI] [PubMed] [Google Scholar]
- Ford JM. Schizophrenia: the broken P300 and beyond. Psychophysiology. 1999;36(6):667–682. [PubMed] [Google Scholar]
- Ford JM, Mathalon DH, Kalba S, Marsh L, Pfefferbaum A. N1 and P300 abnormalities in patients with schizophrenia, epilepsy, and epilepsy with schizophrenialike features. Biol Psychiatry. 2001;49(10):848–860. doi: 10.1016/s0006-3223(00)01051-9. [DOI] [PubMed] [Google Scholar]
- Forman SD, Cohen JD, Fitzgerald M, Eddy WF, Mintun MA, Noll DC. Improved assessment of significant activation in functional magnetic resonance imaging (fMRI): use of a cluster-size threshold. Magn Reson Med. 1995;33(5):636–647. doi: 10.1002/mrm.1910330508. [DOI] [PubMed] [Google Scholar]
- Frodl T, Meisenzahl EM, Muller D, Greiner J, Juckel G, Leinsinger G, et al. Corpus callosum and P300 in schizophrenia. Schizophr Res. 2001;49(1–2):107–119. doi: 10.1016/s0920-9964(00)00123-7. [DOI] [PubMed] [Google Scholar]
- Garcia-Larrea L, Lukaszewicz AC, Mauguiere F. Revisiting the oddball paradigm. Non-target vs neutral stimuli and the evaluation of ERP attentional effects. Neuropsychologia. 1992;30(8):723–741. doi: 10.1016/0028-3932(92)90042-k. [DOI] [PubMed] [Google Scholar]
- Giard MH, Perrin F, Pernier J, Bouchet P. Brain generators implicated in the processing of auditory stimulus deviance: a topographic event-related potential study. Psychophysiology. 1990;27(6):627–640. doi: 10.1111/j.1469-8986.1990.tb03184.x. [DOI] [PubMed] [Google Scholar]
- Gilmore CS, Clementz BA, Buckley PF. Stimulus sequence affects schizophrenia-normal differences in event processing during an auditory oddball task. Brain Res Cogn Brain Res. 2005;24(2):215–227. doi: 10.1016/j.cogbrainres.2005.01.020. [DOI] [PubMed] [Google Scholar]
- Godey B, Schwartz D, de Graaf JB, Chauvel P, Liegeois-Chauvel C. Neuromagnetic source localization of auditory evoked fields and intracerebral evoked potentials: a comparison of data in the same patients. Clin Neurophysiol. 2001;112(10):1850–1859. doi: 10.1016/s1388-2457(01)00636-8. [DOI] [PubMed] [Google Scholar]
- Greischar LL, Burghy CA, van Reekum CM, Jackson DC, Pizzagalli DA, Mueller C, et al. Effects of electrode density and electrolyte spreading in dense array electroencephalographic recording. Clin Neurophysiol. 2004;115(3):710–720. doi: 10.1016/j.clinph.2003.10.028. [DOI] [PubMed] [Google Scholar]
- Guido W, Lu SM, Vaughan JW, Godwin DW, Sherman SM. Receiver operating characteristic (ROC) analysis of neurons in the cat’s lateral geniculate nucleus during tonic and burst response mode. Vis Neurosci. 1995;12(4):723–741. doi: 10.1017/s0952523800008993. [DOI] [PubMed] [Google Scholar]
- Halgren E, Marinkovic K, Chauvel P. Generators of the late cognitive potentials in auditory and visual oddball tasks. Electroencephalogr Clin Neurophysiol. 1998;106(2):156–164. doi: 10.1016/s0013-4694(97)00119-3. [DOI] [PubMed] [Google Scholar]
- Hämäläinen MS, Ilmoniemi RS. Report TKK-F-A559. Espoo, Finland: Helsinki University of Technology; 1984. Interpreting measured magnetic fields of the brain: Estimates of current distributions. [Google Scholar]
- Huotilainen M, Winkler I, Alho K, Escera C, Virtanen J, Ilmoniemi RJ, et al. Combined mapping of human auditory EEG and MEG responses. Electroencephalogr Clin Neurophysiol. 1998;108(4):370–379. doi: 10.1016/s0168-5597(98)00017-3. [DOI] [PubMed] [Google Scholar]
- Ille N, Berg P, Scherg M. Artifact correction of the ongoing EEG using spatial filters based on artifact and brain signal topographies. J Clin Neurophysiol. 2002;19(2):113–124. doi: 10.1097/00004691-200203000-00002. [DOI] [PubMed] [Google Scholar]
- Jerger J, Lew HL. Principles and clinical applications of auditory evoked potentials in the geriatric population. Phys Med Rehabil Clin N Am. 2004;15(1):235–250. viii–ix. doi: 10.1016/s1047-9651(03)00099-8. [DOI] [PubMed] [Google Scholar]
- Junghofer M, Elbert T, Tucker DM, Rockstroh B. Statistical control of artifacts in dense array EEG/MEG studies. Psychophysiology. 2000;37(4):523–532. [PubMed] [Google Scholar]
- Kiehl KA, Laurens KR, Duty TL, Forster BB, Liddle PF. Neural sources involved in auditory target detection and novelty processing: an event-related fMRI study. Psychophysiology. 2001;38(1):133–142. [PubMed] [Google Scholar]
- Kilner JM, Kiebel SJ, Friston KJ. Applications of random field theory to electrophysiology. Neurosci Lett. 2005;374(3):174–178. doi: 10.1016/j.neulet.2004.10.052. [DOI] [PubMed] [Google Scholar]
- Kok A, Rooyakkers JA. ERPs to laterally presented pictures and words in a semantic categorization task. Psychophysiology. 1986;23(6):672–683. doi: 10.1111/j.1469-8986.1986.tb00692.x. [DOI] [PubMed] [Google Scholar]
- Krusemark EA, Keith Campbell W, Clementz BA. Attributions, deception, and event related potentials: an investigation of the self-serving bias. Psychophysiology. 2008;45(4):511–515. doi: 10.1111/j.1469-8986.2008.00659.x. [DOI] [PubMed] [Google Scholar]
- Kutas M, McCarthy G, Donchin E. Augmenting mental chronometry: the P300 as a measure of stimulus evaluation time. Science. 1977;197(4305):792–795. doi: 10.1126/science.887923. [DOI] [PubMed] [Google Scholar]
- Lavikainen J, Tiitinen H, May P, Näätänen R. Binaural interaction in the human brain can be non-invasively accessed with long-latency event-related potentials. Neurosci Lett. 1997;222(1):37–40. doi: 10.1016/s0304-3940(97)13336-5. [DOI] [PubMed] [Google Scholar]
- Linden DE. The p300: where in the brain is it produced and what does it tell us? Neuroscientist. 2005;11(6):563–576. doi: 10.1177/1073858405280524. [DOI] [PubMed] [Google Scholar]
- Malone BJ, Semple MN. Effects of auditory stimulus context on the representation of frequency in the gerbil inferior colliculus. J Neurophysiol. 2001;86(3):1113–1130. doi: 10.1152/jn.2001.86.3.1113. [DOI] [PubMed] [Google Scholar]
- Morstyn R, Duffy FH, McCarley RW. Altered P300 topography in schizophrenia. Arch Gen Psychiatry. 1983;40(7):729–734. doi: 10.1001/archpsyc.1983.01790060027003. [DOI] [PubMed] [Google Scholar]
- Näätänen R. Attention and Brain Function. Hillsdale, NJ: Erlbaum; 1992. [Google Scholar]
- Näätänen R, Gaillard A. The orienting reflex and the N2 deflection of the event-related potential. In: Gaillard A, Ritter W, editors. Tutorials in ERP Research: Endogenous Components. Amsterdam: North Holland; 1983. [Google Scholar]
- Näätänen R, Picton T. The N1 wave of the human electric and magnetic response to sound: a review and an analysis of the component structure. Psychophysiology. 1987;24(4):375–425. doi: 10.1111/j.1469-8986.1987.tb00311.x. [DOI] [PubMed] [Google Scholar]
- Oades RD, Zerbin D, Dittmann-Balcar A. The topography of event-related potentials in passive and active conditions of a 3-tone auditory oddball test. Int J Neurosci. 1995;81(3–4):249–264. doi: 10.3109/00207459509004890. [DOI] [PubMed] [Google Scholar]
- Paavilainen P, Alho K, Reinikainen K, Sams M, Näätänen R. Right hemisphere dominance of different mismatch negativities. Electroencephalogr Clin Neurophysiol. 1991;78(6):466–479. doi: 10.1016/0013-4694(91)90064-b. [DOI] [PubMed] [Google Scholar]
- Pantev C, Lutkenhoner B, Hoke M, Lehnertz K. Comparison between simultaneously recorded auditory-evoked magnetic fields and potentials elicited by ipsilateral, contralateral and binaural tone burst stimulation. Audiology. 1986;25(1):54–61. doi: 10.3109/00206098609078369. [DOI] [PubMed] [Google Scholar]
- Pardo JV, Fox PT, Raichle ME. Localization of a human system for sustained attention by positron emission tomography. Nature. 1991;349(6304):61–64. doi: 10.1038/349061a0. [DOI] [PubMed] [Google Scholar]
- Patel SH, Azzam PN. Characterization of N200 and P300: selected studies of the Event-Related Potential. Int J Med Sci. 2005;2(4):147–154. doi: 10.7150/ijms.2.147. [DOI] [PMC free article] [PubMed] [Google Scholar]
- Polich J, Corey-Bloom J. Alzheimer’s disease and P300: review and evaluation of task and modality. Curr Alzheimer Res. 2005;2(5):515–525. doi: 10.2174/156720505774932214. [DOI] [PubMed] [Google Scholar]
- Potts GF, Dien J, Hartry-Speiser AL, McDougal LM, Tucker DM. Dense sensor array topography of the event-related potential to task-relevant auditory stimuli. Electroencephalogr Clin Neurophysiol. 1998;106(5):444–456. doi: 10.1016/s0013-4694(97)00160-0. [DOI] [PubMed] [Google Scholar]
- Reinvang I, Nordby H, Nielsen CS. Information processing deficits in head injury assessed with ERPs reflecting early and late processing stages. Neuropsychologia. 2000;38(7):995–1005. doi: 10.1016/s0028-3932(99)00153-0. [DOI] [PubMed] [Google Scholar]
- Reite M, Zimmerman JT, Zimmerman JE. Magnetic auditory evoked fields: interhemispheric asymmetry. Electroencephalogr Clin Neurophysiol. 1981;51(4):388–392. doi: 10.1016/0013-4694(81)90102-4. [DOI] [PubMed] [Google Scholar]
- Reser DH, Fishman YI, Arezzo JC, Steinschneider M. Binaural interactions in primary auditory cortex of the awake macaque. Cereb Cortex. 2000;10(6):574–584. doi: 10.1093/cercor/10.6.574. [DOI] [PubMed] [Google Scholar]
- Scherg M, Berg P. New concepts of brain source imaging and localization. In: Barber C, Celesia G, Comi GC, Maugière F, editors. Functional Neuroscience (EEG Suppl 46) Amsterdam: Elsevier; 1996. [PubMed] [Google Scholar]
- Scherg M, Ille N, Bornfleth H, Berg P. Advanced tools for digital EEG review: virtual source montages, whole-head mapping, correlation, and phase analysis. J Clin Neurophysiol. 2002;19(2):91–112. doi: 10.1097/00004691-200203000-00001. [DOI] [PubMed] [Google Scholar]
- Sherman SM. Thalamic relays and cortical functioning. Prog Brain Res. 2005;149:107–126. doi: 10.1016/S0079-6123(05)49009-3. [DOI] [PubMed] [Google Scholar]
- Sherman SM, Guillery RW. The role of the thalamus in the flow of information to the cortex. Philos Trans R Soc Lond B Biol Sci. 2002;357(1428):1695–1708. doi: 10.1098/rstb.2002.1161. [DOI] [PMC free article] [PubMed] [Google Scholar]
- Soltani M, Knight RT. Neural origins of the P300. Crit Rev Neurobiol. 2000;14(3–4):199–224. [PubMed] [Google Scholar]
- Stevens MC, Calhoun VD, Kiehl KA. Hemispheric differences in hemodynamics elicited by auditory oddball stimuli. Neuroimage. 2005;26(3):782–792. doi: 10.1016/j.neuroimage.2005.02.044. [DOI] [PMC free article] [PubMed] [Google Scholar]
- Teder W, Alho K, Reinikainen K, Näätänen R. Interstimulus interval and the selective-attention effect on auditory ERPs: “N1 enhancement” versus processing negativity. Psychophysiology. 1993;30(1):71–81. doi: 10.1111/j.1469-8986.1993.tb03206.x. [DOI] [PubMed] [Google Scholar]
- Tenke CE, Kayser J. A convenient method for detecting electrolyte bridges in multichannel electroencephalogram and event-related potential recordings. Clin Neurophysiol. 2001;112(3):545–550. doi: 10.1016/s1388-2457(00)00553-8. [DOI] [PubMed] [Google Scholar]
- Tervaniemi M, Hugdahl K. Lateralization of auditory-cortex functions. Brain Res Brain Res Rev. 2003;43(3):231–246. doi: 10.1016/j.brainresrev.2003.08.004. [DOI] [PubMed] [Google Scholar]
- Ulanovsky N, Las L, Farkas D, Nelken I. Multiple time scales of adaptation in auditory cortex neurons. J Neurosci. 2004;24(46):10440–10453. doi: 10.1523/JNEUROSCI.1905-04.2004. [DOI] [PMC free article] [PubMed] [Google Scholar]
- Ulanovsky N, Las L, Nelken I. Processing of low-probability sounds by cortical neurons. Nat Neurosci. 2003;6(4):391–398. doi: 10.1038/nn1032. [DOI] [PubMed] [Google Scholar]
- Virtanen J, Ahveninen J, Ilmoniemi RJ, Näätänen R, Pekkonen E. Replicability of MEG and EEG measures of the auditory N1/N1m-response. Electroencephalogr Clin Neurophysiol. 1998;108(3):291–298. doi: 10.1016/s0168-5597(98)00006-9. [DOI] [PubMed] [Google Scholar]
- Woldorff MG, Gallen CC, Hampson SA, Hillyard SA, Pantev C, Sobel D, et al. Modulation of early sensory processing in human auditory cortex during auditory selective attention. Proc Natl Acad Sci U S A. 1993;90(18):8722–8726. doi: 10.1073/pnas.90.18.8722. [DOI] [PMC free article] [PubMed] [Google Scholar]
- Worsley KJ. Detecting activation in fMRI data. Stat Methods Med Res. 2003;12(5):401–418. doi: 10.1191/0962280203sm340ra. [DOI] [PubMed] [Google Scholar]
- Yoshiura T, Zhong J, Shibata DK, Kwok WE, Shrier DA, Numaguchi Y. Functional MRI study of auditory and visual oddball tasks. Neuroreport. 1999;10(8):1683–1688. doi: 10.1097/00001756-199906030-00011. [DOI] [PubMed] [Google Scholar]