

Abstract
We present atomistic molecular dynamics results for fully hydrated bilayers composed of ceramide NS-24:0, free fatty acid 24:0 and cholesterol, to address the effect of the different components in the stratum corneum (the outermost layer of skin) lipid matrix on its structural properties. Bilayers containing ceramide molecules show higher in-plane density and hence lower rate of passive transport compared to phospholipid bilayers. At physiological temperatures, for all composition ratios explored, the lipids are in a gel phase with ordered lipid tails. However, the large asymmetry in the lengths of the two tails of the ceramide molecule leads to a fluidlike environment at the bilayer midplane. The lateral pressure profiles show large local variations across the bilayer for pure ceramide or any of the two-component mixtures. Close to the skin composition ratio, the lateral pressure fluctuations are greatly suppressed, the ceramide tails from the two leaflets interdigitate significantly, the depression in local density at the interleaflet region is lowered, and the bilayers have lowered elastic moduli. This indicates that the observed composition ratio in the stratum corneum lipid layer is responsible for both the good barrier properties and the stability of the lipid structure against mechanical stresses.
Introduction
Stratum corneum (SC), the outer layer of the skin (1), provides the main barrier against water loss (2) and invasion by foreign pathogens. During their lifecycle, cells formed in the basal layer of the epidermis change their shape and composition. They progressively occupy outer layers of the epidermis, until they are peeled off from the outer layer. SC is often viewed as a bricks-and-mortar structure (3) with corneocytes, the keratin-filled nonviable disklike cells, arranged like bricks in a lipid mixture forming the mortar phase (4). The three main components of the SC lipid matrix are a family of ceramide sphingolipids (CER), cholesterol (CHOL), and free fatty acid (FFA) (5,6). Selective inhibition of any one of the ceramide (7), cholesterol (8), or FFA (9) is known to compromise the barrier function of the skin. However, how the three components affect the lipid matrix properties at the molecular level is not known. To our knowledge, there have been only a few previous attempts at atomistic modeling of the SC lipid layer. Most notably, Höltje et al. (10) simulated a two-component mixture of fatty acid and cholesterol, Pandit and Scott (11) simulated a bilayer composed of symmetric CER NS 16:0 molecules, and Notman et al. (12) used atomistic simulation to investigate the effect of DMSO molecules on a hydrated bilayer composed of CER NS 24:0. However, a systematic study of the effects of the three components is lacking, and this study is specifically concerned with understanding the interplay of the three components that endow the skin with an almost contradictory combination of pliability and an extremely high penetration barrier.
There are at least nine different classes of ceramide found in human SC, with minor modifications in the headgroup region and the addition of an esterified fatty acid in the case of Ceramide 1. All the ceramides are conspicuous by having a large asymmetry in the length of the two tails and a large polydispersity in the fatty acid tail lengths (13). Similar polydispersity is also found in the length of the free fatty acids (14). Realistic representation of such a complex collection of molecules with atomic details is beyond current computational capabilities. Instead, we choose just one representative ceramide, ceramide NS (also referred to as ceramide 2), with an asymmetric but monodisperse tail length. Ceramide NS is the most abundant species among the ceramide family. Its fatty acid tail is chosen to be 24:0, guided by the relative abundance of the different tail lengths in human SC (13). Its sphingosine motif is chosen to have 18 carbons. Similarly, we choose only FFA 24:0 because it is the most abundant free fatty acid found in SC lipid layer (14). Fig. 1 shows a skeletal representation of the molecules.
Figure 1.
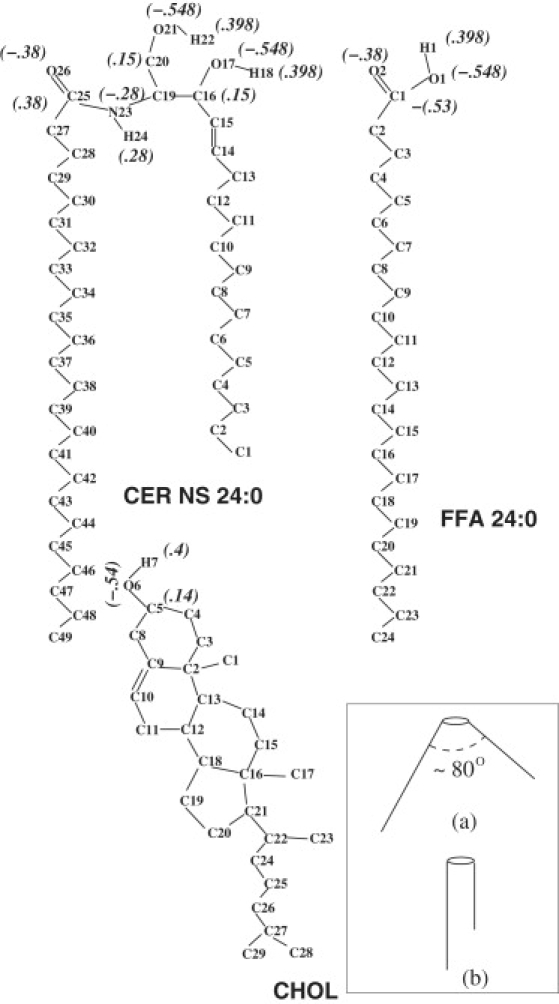
Skeletal representation of the atomic arrangements of the ceramide (CER NS 24:0), the free fatty acid (FFA 24:0), and cholesterol (CHOL). Partial charges used in the simulation are shown in brackets. (Inset) (a) V-shaped and (b) hairpin arrangements of the two tails of a CER molecule (35).
Between the corneocytes, the lipid matrix shows regular electron density variations, similar to lipid multilayers. This is not necessarily the only possible arrangement in the SC lipid matrix. In vitro experiments show the possibility of asymmetric leaflets (15) and multiple layer thicknesses, with indications that ceramide 1 connects different bilayers (16). The lipids are predominantly in a gel phase, possibly a single continuous gel phase (17) or with fluid regions (18). In the skin, the corneocytes are arranged in clusters with the lipid matrix extending through the full depth of the SC at intervals (19). These regions show a much lower permeation barrier than the layers between corneocytes (19) and it is not known whether or not the lipids there are arranged in a multilayer structure. There is a hydration gradient across the SC, with the average water content ∼30% by weight (20,21). How the water molecules are arranged in the SC is not completely known.
With this uncertainty about the arrangement of the lipids in SC, and with the computational limitations imposed by detailed atomistic simulations, we study lipid mixtures arranged in symmetric bilayer structures in excess water. An atomistic potential is chosen in this study to have a faithful representation of the lipids involved. In the absence of prior atomistic simulations, or, experimental results on hydrated SC lipid bilayers, a coarse-grained description is not appropriate for this system. The water is required to stabilize the bilayer structure, and can be viewed as a replacement for the layering field imposed by the flat corneocytes. The lateral arrangement of the components and the properties of such a hydrated bilayer will probably be representative of the lipid matrix confined between the corneocytes.
The rest of the article is organized as follows: In Simulation Details, we outline the force field and protocols used for the simulations, and define the various properties measured. Next we provide the results for a wide range of compositions, concentrating mainly at temperature T = 340 K, which is much higher than the skin temperature. However, much of the results were found to remain qualitatively the same even at the skin temperature ≃ 300 K. We present the results for the higher temperature because we are more confident of the equilibration at 340 K than at skin temperature T ≃ 300 K. Finally, we summarize the main findings and present an outlook for further studies on SC lipid structures. Some details about the simulation are provided as Supporting Material.
Simulation Details
Force field
The interaction parameters used in the simulation are based on the united-atom OPLS force field (22) with modifications for the nonpolar CH2/CH3 groups (23) that accurately reproduce experimental quantities for lipid molecules (24). The polar hydrogens were included explicitly and the partial charges for the headgroup atoms were selected to conform to molecules having similar structures and simulated using the same force field in the literature. The dihedral potentials in the hydrocarbon tails were described by the Ryckaert-Bellemans term (25).
The force field used for the ceramide molecules has been used previously (12). The topologies of the polar part of the fatty acid and the cholesterol are the same as used in Höltje et al. (10). The water is modeled with the SPC potential (26).
Simulations
We used extended ensemble molecular dynamics simulation at constant temperature and pressure (NPT) ensemble with the GROMACS molecular dynamics package (27–29). Temperature was controlled by Nosé-Hoover thermostats coupled separately to the lipid and water molecules with a time constant of 5 ps. Pressure was controlled by an anisotropic Parrrinello-Rahman barostat with a time constant of 5 ps and compressibility of 4.5 × 10⁻⁵/bar. The off-diagonal terms of the compressibility matrix were set to zero to preserve the orthogonal shape of the simulation box. Standard periodic boundary conditions were applied in all three directions. A simple group-based cutoff was used for calculating electrostatic interaction. The cutoff length was chosen to be 1.2 nm for both the van der Waals and electrostatic potentials. Because the lipid molecules considered in this study do not fully ionize, the dominant electrostatic interaction is the dipole-dipole interaction, with the dipoles made up of the partial changes separated by fixed bond lengths. This is quite different from the case of phospholipids, where a fully ionized phosphate group introduces a large dipole moment from well-separated N− and P+ charges. As a specific example, the C25 = O26 atoms on the CER molecule (see Fig. 1) form a dipole from equal charges of magnitude 0.28 e separated by a fixed distance of 0.123 nm. This creates a dipole moment of 1.65 D, which is roughly 15 times smaller than the dipole moment at the headgroups in DPPC bilayer (30). Noting that the dipolar interaction falls of as 1/r3 and that for the DPPC bilayer, the effect of electrostatic interaction with the periodic images become negligible for system sizes ∼1024 lipid molecules (30), we estimate that for the dipole moments involved in our system, the electrostatic interaction with the periodic images become negligible for systems containing ∼168 lipids. We have carried out simulations with pure CER molecules and 2:2:1 composition system both with group-based cutoff and particle-mesh Ewald summation for several system sizes. The results are presented in the Supporting Material accompanying this article, and these validate the independence of the results presented on long-range electrostatic interaction and system size. Because the use of particle-mesh Ewald requires more than twice the computational cost as compared to using a cutoff, and it has no effect on the validity of our results, we restrict ourselves to a group-based cutoff for handling electrostatic interaction in the simulations presented in the main article. All bond lengths were constrained using the SHAKE algorithm (29). The analytic SETTLE algorithm was used to handle the rigid SPC water molecules (29). We used a timestep of 2 fs for T ≤ 340 K and 1 fs for high temperature simulations. During the production run, configurations at intervals of 0.5 ps were stored for further analysis.
The SC lipid matrix (in mice) shows a pH of ∼6 (31). The ionization state of FFA is known to modify the structure of CHOL-FFA (C16:0) mixtures (32). For ceramide-cholesterol mixtures containing palmitic acid (C16:0) and oleic acid (C18:1), reported values of the pKa lie in the range of 6.2–7.3 (33). Typically longer-tailed FFA are expected to have higher pKa; e.g., for hexacosanoic acid (C26:0) in an egg-phosphatidylcholine bilayer, pKa ∼7.4. This suggests that a fraction of the FFA should ionize at skin pH. However, the experimental evidence for the effect of pH on SC lipid mixture is not clear. Surface force and atomic force microscopy measurements on SC lipid mixtures containing free fatty acid seem to show no detectable effect in a wide range of pH (between 3.0 and 7.0) (34). The apparent insensitivity of the SC lipid mixture to pH may be because the bilayers containing long-tail ceramides remain in a dense gel phase and do not allow much structural freedom to the FFA molecules. With this background, we chose to simulate only un-ionized FFA—not having free charges allow fast calculation of the forces with cutoff as alluded before.
Initial structures
In all but one of the six different crystal structures formed under varying conditions, the sphingosine and the fatty acid tails of CER NS 24:0 arrange themselves with a large opening angle V-shaped structure (35). Only low temperature crystallization from solution leads to a hairpin arrangement of the tails (inset of Fig. 1). To ensure a hairpin arrangement of the ceramides, we start with a multilayer anhydride system with the ceramides placed in a slightly expanded hexagonal lattice with a hairpin structure at 300 K, and relax the configuration with a 20-ns NPT MD run. A bilayer from the multilayer was then placed in a larger box and the box was filled with water. We ran the system for 5 ns with the ceramide molecules fixed (to hydrate the bilayer properly), and then for 2 ns with only the terminal methyl group on all the lipid tails frozen, so that the rest of the molecules reorient themselves to accommodate the water environment. This configuration was used as the initial configuration for the pure CER system. A further 10-ns NPT MD run was used at each temperature before the production runs.
For mixtures containing CER molecules, we transform the required number of CER molecules, chosen at random but maintaining the same composition in the two leaflets, to either CHOL or FFA. To convert to FFA molecules, we simply separate the two tails of CER as two separate molecules and slowly grow the shorter chain derived from the sphingosine motif to the required length. FFA molecules are significantly more mobile as compared to CER molecules. Thus, although in the initial configuration the two FFA molecules generated from the same CER molecule are next to each other, they do not introduce any artificial correlation after the equilibration step. To convert to CHOL, we map certain atoms of the CER to CHOL. Repeated short NVT MD runs were performed while keeping the CHOL molecules frozen, and after each such short run, the atoms of the CHOL were displaced by a small amount until they reached the equilibrium positions on the molecule. The mixtures were adequately equilibrated, typically by energy minimization followed by a series of short NVT simulations and finally with at least 10 ns of an NPT MD run. To find a typical relaxation time, we quenched a CER bilayer from 360 K to 300 K and found that the area/lipid and the bilayer thickness reequilibrate to 300 K values in ∼1-ns timescale. For pure FFA or CHOL bilayers, we simulated multilayers and placed one bilayer in water in the same way as in the case of CER. Table 1 shows the number of molecules used, as well as the corresponding molar ratios, rounded to closest integer ratios. Some of the composition ratios explored in this study may not be achievable in experiments as hydrated bilayers. However, once prepared, the bilayers are kinetically stable and allow us to isolate the effects of the different components by studying the extreme compositions. In the rest of the article the different compositions are referred to by the corresponding molar ratios.
Table 1.
Compositions (as molar ratios) and number of particles simulated in this study
| Number of molecules | |||
|---|---|---|---|
| CER/CHOL/FFA (molar ratio) | nCER | nCHOL | nFFA |
| 1:0:0 | 128 | 0 | 0 |
| 0:1:0 | 0 | 128 | 0 |
| 0:0:1 | 0 | 0 | 512 |
| 7:1:0 | 112 | 16 | 0 |
| 3:1:0 | 96 | 32 | 0 |
| 2:1:0 | 86 | 42 | 0 |
| 1:1:0 | 64 | 64 | 0 |
| 7:0:1 | 120 | 0 | 16 |
| 3:0:1 | 110 | 0 | 36 |
| 2:0:1 | 102 | 0 | 52 |
| 1:0:1 | 86 | 0 | 84 |
| 1:1:1 | 52 | 50 | 52 |
| 1:2:1 | 32 | 64 | 32 |
| 2:1:1 | 64 | 32 | 32 |
| 5:5:1 | 60 | 60 | 12 |
| 2:2:1 | 56 | 56 | 32 |
The pure FFA system had 9020 water molecules. For all other compositions, there were 5250 water molecules.
Measured quantities
In this section we define the different quantities measured from the simulations. For all composition ratios and temperatures, we use averages over 10-ns runs. We estimate the error bars for the measured quantities from the variance of intermediate averages over 2-ns windows.
We define the bilayer-normal direction to be the z direction. The orthogonal box shape along with the small system size ensures that this direction remains the same as the z direction of the simulation box. All z-dependent quantities reported are averaged over the lateral direction (x-y plane) in the entire simulation box.
Structural properties
At the molecular length scale, the water-lipid interface has a finite width. To assign an unique value to the bilayer thickness 2d, we calculate the density of the water molecules as a function of z and define the position of the interface between the lipid and water as the z at which the water density decays to of the bulk water density. We use this criteria, as opposed to the more usual criteria of the Gibbs dividing surface, because we consider multicomponent lipids in this study and the different components have significantly different densities at the boundary. Concentrating on the approximately exponentially decaying water density gives a simple and unique method to assign a value to the bilayer thickness. The average lipid layer density is computed by assuming that all the lipid mass is homogeneously distributed between the two lipid-water interfaces. The local density of the lipid molecules depends on z with a minimum ρLmin between the two leaflets.
The asymmetry in the lengths of the two hydrocarbon tails of CER can lead to significant interdigitation. We define the following dimensionless overlap parameter as a quantitative measure of interdigitation,
| (1) |
where ρt(z) and ρb(z) are the densities at z for the CER from the top and bottom layers, respectively. Hence ρov(z) = 1 if half of the density at z is from the top layer and the other half is from the bottom layer CER molecules. If only the top or bottom layer of CER is at z, ρov(z) = 0. Integrating over z, we define a single length scale to compare the amount of interdigitation for different compositions. The integration is carried over the whole box, since if no CER is present, then ρov(z) = 0 and there is no contribution to λov.
The area compressibility κA of the bilayer is related to the area fluctuation in the NPT ensemble by (36)
| (2) |
where kB is the Boltzmann's constant and T is the temperature. The angular brackets refer to averages over time.
Tail-order parameter
The orientational (nematic) order of the tails is probed through an order parameter P2, defined by the largest eigenvalue of the second rank tensor
| (3) |
where is the Cartesian component α of some specific orientation vector on the lipid molecule i, and the 〈…〉 denotes average over time and the lipid molecules. For fluid bilayers, P2 is related to the nuclear magnetic resonance deuterium-order parameter SCD through the relation P2 = −SCD (37). The eigenvector corresponding to the largest eigenvalue of Q defines the average orientation. Different carbon atoms along the tail are expected to have a different amount of ordering. To probe the local ordering, we define a local orientation P2(n) at carbon atom n on the lipid molecule i by the vector direction between carbon atoms n − 1 and n + 1.
Local pressure
The anisotropic arrangement of lipid molecules in a bilayer leads to an anisotropic local pressure profile, and hence local stress variations. Although macroscopic pressure is a well-defined quantity in molecular simulations, its microscopic description is not unique (38). We use the formalism of (39) to define the local pressure tensor at a given height z as
| (4) |
Here, vi is the velocity of particle i, Fij is the force on particle i due to particle j, and rij is the relative position vector of particle i from particle j. Vslice is the volume of a thin slice with thickness Δz and 〈…〉 denotes an average over time. The first sum runs over the particles in the slice centered at z. The function f determines the contribution from the virial (the second sum) to the current slice. When both particles are in the current slice, f is unity. If one or both of the particles are outside the slice (but the shortest distance between the two particles goes through the slice), f is, respectively, chosen to be Δz/|zi − zj| and . Because constraints in the simulation (SHAKE algorithm) transfer some of the kinetic contributions to the constraint potential, we need to consider both the sums in Eq. 4 explicitly. We calculate the local pressure profiles by starting with stored configurations separated by 2 ns and reevolving the configurations for 200 ps.
Of particular interest for lipid bilayers is the difference between the lateral and the normal pressure δP(z) = PLAT(z) − Pzz(z), where . The surface tension γ of the bilayer is related to δP(z) through (39). Anisotropic box fluctuations ensure that the bulk water is isotropic, i.e., the pressure tensor has equal diagonal components and zero off-diagonal components. This in turn leads to a zero average surface tension for the lipid bilayer. However, locally δP(z) goes through a number of maxima and minima. We define a microscopic stress by
| (5) |
Here, the integration is over the bilayer thickness and the angular brackets reflect time averages.
Results and Discussion
Pure ceramide bilayers
Fig. 2 shows snapshots of the CER bilayer at (a) 300 K and at (b) 360 K. The tails of the CER align along the z direction with strong nematic ordering. The terminal methyl groups at the bilayer midplane show a liquidlike disordered arrangement. With increasing temperature, the disordered region at the bilayer midplane gradually thickens. The tail order parameters at 300 K and 360 K are shown later in Fig. 4 a. The terminal groups (smallest and largest atom indices) have small ordering. P2 also decreases close to the headgroup (atom indices 16 and 25). The C-C bonds close to the headgroup orient at an angle to the vertical direction. Fig. 3 a shows a top view of one leaflet. The figure shows that the molecules arrange in a zigzag fashion with rows of molecules having the headgroup arrangement in alternate (orthogonal) directions. Thus the tail carbon bonds close to the headgroup point in one of these two orthogonal directions, reducing the overall average of P2.
Figure 2.
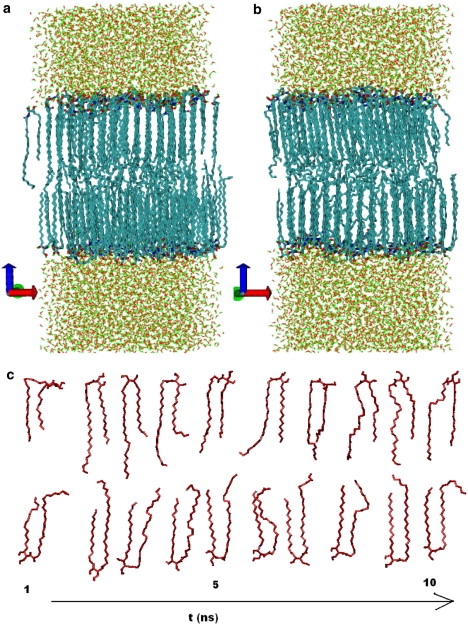
Snapshots of a CER2 bilayer at (a) 300 K and (b) 360 K. Although both the leaflets have similar tail ordering, projection in two dimensions artificially accentuates order in one leaflet at the cost of showing less order in the other leaflet. (c) Time trace of two CER molecules. The perspective for the two molecules is chosen independently and each time frame has been shifted arbitrarily.
Figure 4.
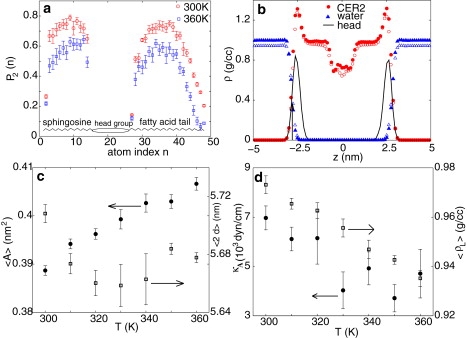
(a) Tail order parameter of CER atoms as a function of atom index n (see Fig. 1). (b) Density of CER atoms (circles), water molecules (triangles) for CER bilayer at 300 K (solid symbols), and 360 K (open symbols). The density of headgroup atoms at 300 K is shown with a solid line. (c) Area/lipid (circles, left y axis) and bilayer thickness (squares, right y axis) of CER molecules as a function of temperature. (d) Area compressibility (circles, left y axis) and average density (squares, right y axis) of CER bilayers as a function of temperature.
Figure 3.
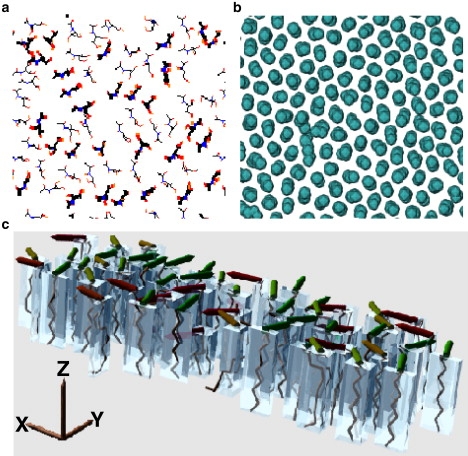
(a) Top view of CER molecule headgroup arrangement on one leaflet at T = 340 K. The molecules are drawn in thick or thin lines, respectively, depending on whether the tangent of the angle between the line joining the end-atoms of the headgroup and the x axis is positive or negative. (b) Cross section of CER tail groups a few atoms below the headgroups, showing local hexatic order. (c) Side view of part of the lipid tails with (orthogonal distance regression) planes containing the tail atoms indicated by transparent boxes. The normals to these planes are indicated by solid rods on top of the boxes. In a crystalline configuration, the alignment of these planes is regular throughout the sample, while in the rotator phase, there are no correlations between the planes. In this case, local correlation between the hydrocarbon planes persists but allows slow rearrangement because the correlation is not perfect.
In the well-ordered layer immediately beneath the headgroups, the tails have fairly well-defined hexatic order with very few defects (Fig. 3 b). Moreover, the orientations of the planes containing the lipid tails (Fig. 3 c) suggests that the phase of this ordered layer is intermediate between crystal and rotator phases (familiar from studies of alkanes of different lengths (40)). Although the two-dimensional slices show strong sixfold order, the molecules undergo relatively fast slithering motion of the tails (Fig. 2 c). The coupling between the two leaflets is weak, allowing the two leaflets to oscillate about each other by more than the interlipid distance in roughly 10 ns. Diffusion of the center of masses of the molecules in the x-y plane is much slower because they can only diffuse at the defect sites.
Fig. 4 b shows the density of the CER and water molecules across the bilayer at 300 K (open symbols) and 360 K (solid symbols). The CER density shows a peak at water-lipid interface from the close packing of headgroup atoms. There is an almost constant density shoulder from the dense packing of the hydrocarbon tail atoms, followed by a dip at the bilayer midplane, which corresponds to the amorphous inner layer due to the asymmetric ceramide tails. The arrow indicates where the water density falls below 1/e of the bulk water density at 300 K, which is considered to be the lipid-water interface used to calculate the bilayer thickness.
Fig. 4 c shows the area per lipid and bilayer thickness as a function of temperature. The area/lipid at 300 K is 0.389 nm2, which is close to the x-ray result ∼0.4 nm2 for CER bilayers with molecules in a hairpin arrangement (35). With increasing temperature, the area/lipid gradually increases, while the increasingly disordered terminal tail atoms make the thickness decrease. The average density and area compressibility (Fig. 4 d) both decrease with temperature. Even at 360 K, the area compressibility is an order-of-magnitude larger (∼4000 dyne/cm) than in most phospholipid fluid bilayers. The results do not show a sharp transition. Instead, the disordered interleaflet region expands smoothly with temperature. The long chains involved in CER probably will lead to a broad gradual softening like a waxy material, instead of a sharp transition. Experimentally, main transition temperatures in ceramide systems have been found, for multilayer systems, to be of ∼394–420 K (35). One expects a lower temperature for a single hydrated membrane in solution.
Mixed stratum corneum (SC) lipid bilayers
For all the composition ratios investigated, the temperature behavior in the simulated range of temperatures is gradual and similar to that of CER system. For presentation of the results in this section, we concentrate on 340 K.
Fig. 5 shows snapshots (a) for pure CER, (b) equimolar CER-FFA, (c) equimolar CER-CHOL, and (d) 2:2:1 mixture of CER, CHOL, and FFA. The tails of CER molecules (Fig. 5 a) retain substantial ordering. Long-chain FFA molecules (Fig. 5 b) fall in registry with the CER molecules. The slightly longer length of the FFA molecules is accommodated by partially increasing the tail order in the CER molecules. The tails in the leaflets arrange in a slightly tilted orientation with respect to the layer normal. Thus, even though the amount of ordering is the same on both leaflets, the particular orientation of Fig. 5 highlights the ordering in the lower leaflets at the cost of obscuring the order in the upper leaflets.
Figure 5.
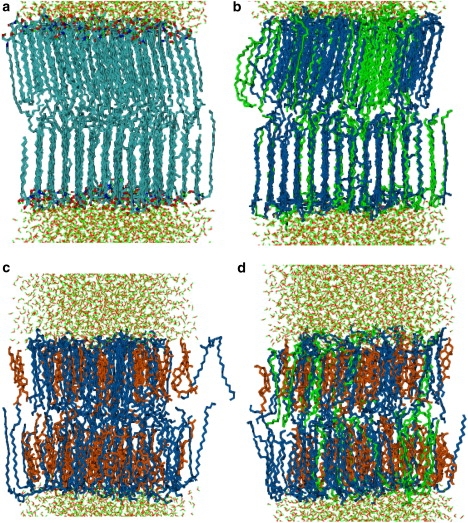
Snapshots of (a) pure CER, (b) equimolar CER-FFA mixture (1:0:1), (c) equimolar CER-CHOL mixture (1:1:0), and (d) 2:2:1 mixture of CER, CHOL, and FFA at 340 K. Only part of the water box is shown. CER, CHOL, and FFA are thick lines, and colored as blue, orange, and green, respectively. Water molecules are drawn with thin lines.
The headgroups of the CHOL (Fig. 5 c) mostly stay at the water-lipid boundary. The shorter length of the CHOL molecules squashes the bilayer, with the central region comprising primarily CER tails. The ordering in the CER tails is decreased compared to pure CER bilayers, and the tails from the two leaflets overlap strongly.
The molecular arrangements in the ternary systems (Fig. 5 d) are somewhat intermediate to the binary CR2-FA and CR2-CHOL mixtures. Single chain FFA molecules are more flexible than CER molecules, which induces more FFA atoms in the midplane disordered phase and thus increases the tail order of CER molecules to some degree compared to CER-CHOL mixtures.
To investigate the arrangement of the different components further, in Fig. 6 we plot the density of the lipid components along the z direction for different compositions. Fig. 6 a shows the density profile of the CER atoms. Both pure CER and CER-FFA systems have a high density near the headgroups, followed by a constant density region due to the ordered tail atoms and then a region of lower density at the midplane, which covers almost 2 nm. For CER-CHOL and three-component mixtures, the density from the tail atoms of the CER molecules remains almost constant throughout the bilayer. In fact, for CER-CHOL mixtures, there is an increase in the local CER density at the bilayer midplane due to increased interdigitation of the molecules from the two leaflets. The plateau densities in Fig. 6 are fixed by the relative abundance of the different molecules in the mixtures. Fig. 6 b shows the density profile of the FFA atoms. For pure FFA and CER-FFA mixtures, the density profiles are qualitatively similar to those of pure CER bilayers, except the region of low density interleaflet space is narrower. In the three-component mixtures, the density minimum is replaced by a local density maximum because of interleaflet overlaps. The density profile of the CHOL molecules (Fig. 6 c) does not have the constant density hydrocarbon regions present for the FFA and CER molecules. The profile for the pure CHOL bilayer is not symmetric and the interleaflet density is quite high, signifying significant transfer between the two leaflets. Fig. 6 d shows the total lipid densities. The effect of fatty acid is to increase the bilayer thickness and reduce the density by a small amount. CHOL, when present, reduces the bilayer thickness and increases the density at the tail region.
Figure 6.
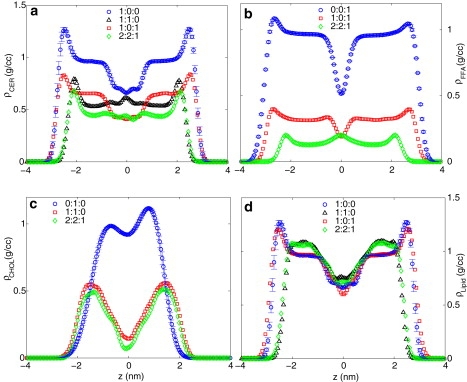
Lipid densities along the bilayer-normal directions at 340 K for (a) CER, (b) FFA, (c) CHOL, and (d) all lipid molecules considered together. Legends show molar ratio of CER/CHOL/FFA.
The overlap of the lipids from the two leaflets (partial interdigitation) is expected to increase the interleaflet friction and couple the dynamics of the two leaflets. Fig. 7 a shows a surface plot of λov, a measure of interdigitation, as a function of composition. The three-component mixture is characterized by large λov. One of the SC lipids that was not considered in this study, ceramide 1 (ceramide EOS), contains an additional long-chain ω-hydroxy acid (with number of carbon atoms >30) linked to the fatty acid tail. This effectively makes the length of the long tail of ceramide 1 nearly double to that of the other members of the ceramide family. The presence of ceramide 1 will probably introduce significantly more interdigitation and interleaflet coupling.
Figure 7.
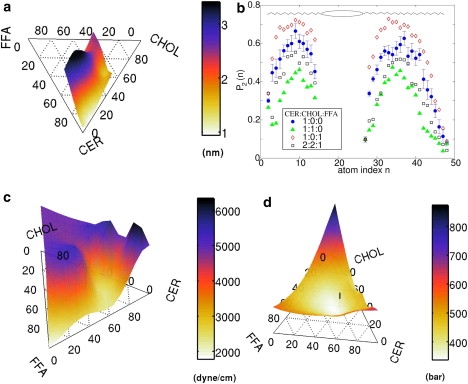
(a) Estimate of overlap λov of the CER tails from the two leaflets (Eq. 1) at 340 K. (b) Local tail order parameter P2(n) as a function of atom index n on a CER molecule (Fig. 1) for various compositions at 340 K. Error bars are shown for the pure CER data (circles). (c) Area compressibility modulus κA of the bilayers at 340 K. (d) Local stress (Eq. 5) in the bilayers associated with the difference in the lateral and the perpendicular components of the pressure tensor. The 2:2:1 composition is indicated with a vertical line.
Fig. 7 b shows the tail order parameter of CER atoms at 340 K for different composition ratios. The presence of CHOL reduces the nematic order, whereas FFA increases the order. This differs from phospholipid membranes, where the planar shape of cholesterol typically increases the nematic order of the phospholipid tails. When mixed with the long ceramides, the shorter cholesterol molecules tend to encourage a thinner membrane by disordering the longer ceramide tails so that they can fill the space around the cholesterol. This also accounts for the increased overlap of the CER tails upon adding cholesterol, as depicted in Fig. 7 a.
Fig. 7 c shows a surface plot of the area compressibility κA on a ternary diagram of the three components. The bending modulus κ, calculated from the polymer brush theory (41) using κA and the bilayer thickness, behaves in a similar fashion. Close to the skin composition CER/FFA/CHOL = 2:2:1, the bilayer becomes softer, with comparatively smaller κA and κ. The absolute magnitude of the elastic constants remains much higher than in the fluid phase of phospholipid bilayers.
Fig. 8 shows the difference between the lateral and the normal pressure δP(z) along the bilayer-normal direction. Inside the bilayers, pure CER (Fig. 8 a) shows large variations in δP(z) as a function of z. Similar but less pronounced variations in δP(z) are observed in phospholipid membranes. For example, Lindahl and Olle (42) found a maximum variation of |δP(z)| < 500 bar for a DPPC bilayer at 323 K, which is five times smaller than in our case. The addition of CHOL (Fig. 8 b) introduces additional peaks in δP(z). FFA reduces the peak height marginally (Fig. 8 c). The three-component mixtures (Fig. 8 d) show much less pronounced variations in δP(z) than the pure ceramide or any of the two-component mixtures. A large δP can be interpreted as a local moment acting on the molecules, making a deviation from the flat interface of bilayer more likely. The magnitude of δP also can be viewed as a local stress . Fig. 7 d shows a ternary plot of defined through Eq. 5. The vertical line shows the position of composition 2:2:1, where shows a minimum. To gain some insight into the energy scale, we note that 103 bar ∼0.7 kBT per methyl group, while the trans-gauche energy difference is ∼2 kBT per dihedral bond. Thus, in the absence of prohibitive energy barriers, the system can introduce gauche defects to reduce the local variation of δP.
Figure 8.
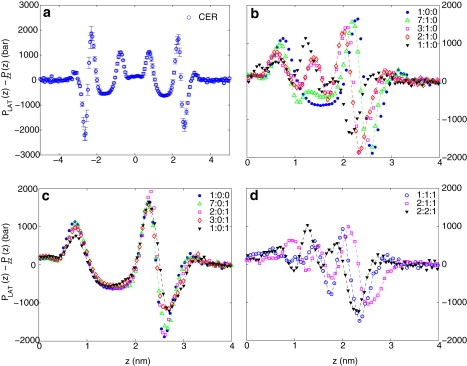
Difference between the lateral and perpendicular components of the local pressure (δP = PLAT − Pzz) as a function of distance from the bilayer midplane at 340 K. (a) δP(z) for pure CER. Panels b and c, respectively, show the effect of adding CHOL and FFA to CER bilayers. Because the local pressure profile is symmetric about the bilayer midplane, only one side of the data is reproduced for clarity. (d) δP for selected three-component mixtures. For some data sets, smooth lines joining the points are drawn as a guide to eye. Legends show the ratio of CER/CHOL/FFA.
There has been great interest in the local correlations between cholesterol and sphingomyelin molecules in the last several years, which has led to suggestions of condensed lipid-cholesterol complexes (43) or superlattice structures (44). Although our simulations are not large enough to reliably study such correlations in mixed SC membranes, preliminary results suggest that local correlations are present.
Conclusions
We have presented molecular dynamics simulation results for various composition ratios of the three main constituent components of stratum corneum lipid layers, namely, CER NS 24:0, FFA 24:0 and CHOL. The long asymmetric tails of the CER molecules form a dense bilayer phase in water, with considerable interdigitation of the tails from the two leaflets and strong nematic order. CHOL, being rigid and smaller in length compared to CER, acts as a molecular clamp, squashing the bilayer and increasing the in-plane density. The resulting structure shows large lateral stress variations, which is relieved by the presence of FFA. The three-component mixtures are characterized by a higher density and comparatively smaller area compressibilities and bending moduli.
The lipids in real skin stratum corneum have large polydispersity in tail length and have different headgroups. This work does not address the effect of polydispersity. We also study bilayers in excess water, which is quite different from the limited water environment in the skin. The strong local pressure fluctuations in the bilayer suggest that the bilayer may not be the most stable structure and it will be interesting to simulate the lipids in limited water conditions. The hydrocarbon densities in the bilayers were found to be quite large compared to phospholipids. This is probably responsible for the three orders-of-magnitude smaller permeability of water through stratum corneum as compared to plasma membranes.
Supporting Material
More details about the simulations, together with seven figures and four tables are available at http://www.biophysj.org/biophysj/supplemental/S0006-3495(09)01279-X.
Supporting Material
Acknowledgments
The authors thank Jamshed Anwar, Simon Connell, Brett Donovan, Andrea Ferrante, Robert Marriott, Rebecca Notman, Khizar Sheikh, Sathish Sukumaran, and Barry Stidder for useful discussions.
This work was supported by Yorkshire Forward through the YFRID Award, grant No. B/302. C.D. acknowledges SoftComp European Union Network of Excellence for financial support and computational resources.
References
- 1.Freinkel, R.K., and Woodley, D.T., editors. 2001. The Biology of the Skin. Parthenon Publishing, London, UK.
- 2.Scheuplein R.J., Blank I.H. Permeability of the skin. Physiol. Rev. 1971;51:702–747. doi: 10.1152/physrev.1971.51.4.702. [DOI] [PubMed] [Google Scholar]
- 3.Michaels A.S., Chandrasekaran S.K., Shaw J.E. Drug permeation through human skin: Theory and in vitro experimental measurement. AIChE J. 1975;21:985–996. [Google Scholar]
- 4.Elias P.M., Goerke J., Friend D.S. Mammalian epidermal barrier layer lipids: composition and influence on structure. J. Invest. Dermatol. 1977;69:535–546. doi: 10.1111/1523-1747.ep12687968. [DOI] [PubMed] [Google Scholar]
- 5.Norlén L., Nicander I., Rozell B.L., Ollmar S., Forslind B. Inter- and intra-individual differences in human stratum corneum lipid content related to physical parameters of skin barrier function in vivo. J. Invest. Dermatol. 1999;112:72–77. doi: 10.1046/j.1523-1747.1999.00481.x. [DOI] [PubMed] [Google Scholar]
- 6.Weerheim A., Ponec M. Determination of stratum corneum lipid profile by tape stripping in combination with high-performance thin-layer chromatography. Arch. Dermatol. Res. 2001;293:191–199. doi: 10.1007/s004030100212. [DOI] [PubMed] [Google Scholar]
- 7.Holleran W.M., Man M.Q., Gao W.N., Menon G.K., Elias P.M. Sphingolipids are required for mammalian epidermal barrier function. Inhibition of sphingolipid synthesis delays barrier recovery after acute perturbation. J. Clin. Invest. 1991;88:1338–1345. doi: 10.1172/JCI115439. [DOI] [PMC free article] [PubMed] [Google Scholar]
- 8.Feingold K.R., Man M.Q., Menon G.K., Cho S.S., Brown B.E. Cholesterol synthesis is required for cutaneous barrier function in mice. J. Clin. Invest. 1990;86:1738–1745. doi: 10.1172/JCI114899. [DOI] [PMC free article] [PubMed] [Google Scholar]
- 9.Mao-Qiang M., Elias P.M., Feingold K.R. Fatty acids are required for epidermal permeability barrier function. J. Clin. Invest. 1993;92:791–798. doi: 10.1172/JCI116652. [DOI] [PMC free article] [PubMed] [Google Scholar]
- 10.Höltje M., Förster T., Brandt B., Engels T., von Rybinski W. Molecular dynamics simulations of stratum corneum lipid models: fatty acids and cholesterol. Biochim. Biophys. Acta. 2001;1511:156–167. doi: 10.1016/s0005-2736(01)00270-x. [DOI] [PubMed] [Google Scholar]
- 11.Pandit S.A., Scott H.L. Molecular-dynamics simulation of a ceramide bilayer. J. Chem. Phys. 2006;124:014708. doi: 10.1063/1.2140689. [DOI] [PubMed] [Google Scholar]
- 12.Notman R., den Otter W.K., Noro M.G., Briels W.J., Anwar J. The permeability enhancing mechanism of DMSO in ceramide bilayers simulated by molecular dynamics. Biophys. J. 2007;93:2056–2068. doi: 10.1529/biophysj.107.104703. [DOI] [PMC free article] [PubMed] [Google Scholar]
- 13.Farwanah H., Wohlrab J., Neubert R.H.H., Raith K. Profiling of human stratum corneum ceramides by means of normal phase LC/APCI-MS. Anal. Bioanal. Chem. 2005;383:632–637. doi: 10.1007/s00216-005-0044-3. [DOI] [PubMed] [Google Scholar]
- 14.Norlén L., Nicander I., Lundsjö A., Cronholm T., Forslind B. A new HPLC-based method for the quantitative analysis of inner stratum corneum lipids with special reference to the free fatty acid fraction. Arch. Dermatol. Res. 1998;290:508–516. doi: 10.1007/s004030050344. [DOI] [PubMed] [Google Scholar]
- 15.McIntosh T.J. Organization of skin stratum corneum extracellular lamellae: diffraction evidence for asymmetric distribution of cholesterol. Biophys. J. 2003;85:1675–1681. doi: 10.1016/S0006-3495(03)74597-4. [DOI] [PMC free article] [PubMed] [Google Scholar]
- 16.Bouwstra J.A., Gooris G.S., Dubbelaar F.E.R., Weerheim A.M., IJzerman A.P. Role of ceramide 1 in the molecular organization of the stratum corneum lipids. J. Lipid Res. 1998;39:186–196. [PubMed] [Google Scholar]
- 17.Norlén L. Skin barrier structure and function: the single gel phase model. J. Invest. Dermatol. 2001;117:830–836. doi: 10.1038/jid.2001.1. [DOI] [PubMed] [Google Scholar]
- 18.Bouwstra J.A., Pilgram G.S.K., Ponec M. Does the single gel phase exist in stratum corneum? J. Invest. Dermatol. 2002;118:897–898. doi: 10.1046/j.1523-1747.2002.17384.x. [DOI] [PubMed] [Google Scholar]
- 19.Schätzlein A., Cevc G. Non-uniform cellular packing of the stratum corneum and permeability barrier function of intact skin: a high-resolution confocal laser scanning microscopy study using highly deformable vesicles (Transfersomes) Br. J. Dermatol. 1998;138:583–592. doi: 10.1046/j.1365-2133.1998.02166.x. [DOI] [PubMed] [Google Scholar]
- 20.Warner R., Myers M., Taylor D. Electron probe analysis of human skin: determination of the water concentration profile. J. Invest. Dermatol. 1988;90:218–224. doi: 10.1111/1523-1747.ep12462252. [DOI] [PubMed] [Google Scholar]
- 21.Bernstein J. Dermatologic aspects of mineral water. Clin. Dermatol. 1996;14:567–569. doi: 10.1016/s0738-081x(96)00086-7. [DOI] [PubMed] [Google Scholar]
- 22.Jorgensen W., Tirado-Rives J. The OPLS potential functions for proteins, energy minimizations for crystals of cyclic peptides and crambin. J. Am. Chem. Soc. 1988;110:1657–1666. doi: 10.1021/ja00214a001. [DOI] [PubMed] [Google Scholar]
- 23.Chiu S., Clark M., Balaji V., Subramaniam S., Scott H. Incorporation of surface tension into molecular dynamics simulation of an interphase: a fluid phase lipid bilayer membrane. Biophys. J. 1995;69:1230–1245. doi: 10.1016/S0006-3495(95)80005-6. [DOI] [PMC free article] [PubMed] [Google Scholar]
- 24.Berger O., Edholm O., Jähnig F. Molecular dynamics simulations of a fluid bilayer of dipalmitoylphosphatidylcholine at full hydration, constant pressure, and constant temperature. Biophys. J. 1997;72:2002–2013. doi: 10.1016/S0006-3495(97)78845-3. [DOI] [PMC free article] [PubMed] [Google Scholar]
- 25.Ryckaert J.-P., Bellemans A. Molecular dynamics of n-butane near its boiling point. Chem. Phys. Lett. 1975;30:123–125. [Google Scholar]
- 26.Berendsen H., Postma J., van Gunsteren W., Hermans J. Interaction models for water in relation to protein hydration. In: Pullman B., editor. Intermolecular Forces. Reidel, Dordrecht; The Netherlands: 1981. [Google Scholar]
- 27.Berendsen H.J.C., van der Spoel D., van Drunen R. GROMACS: a message-passing parallel molecular dynamics implementation. Comput. Phys. Commun. 1995;91:43–56. [Google Scholar]
- 28.van der Spoel D., Lindahl E., Hess B., Groenhof G., Mark A.E. GROMACS: fast, flexible and free. J. Comput. Chem. 2005;26:1701–1718. doi: 10.1002/jcc.20291. [DOI] [PubMed] [Google Scholar]
- 29.van der Spoel, D., E. Lindahl, B. Hess, A. R. van Buuren, E. Apol, et al. 2005. GROMACS User Manual, Ver. 3.3. www.gromacs.org.
- 30.Wohlert J., Edholm O. The range and shielding of dipole-dipole interactions in phospholipid bilayers. Biophys. J. 2004;87:2433–2445. doi: 10.1529/biophysj.104.044222. [DOI] [PMC free article] [PubMed] [Google Scholar]
- 31.Hanson K.M., Behne M.J., Barry N.P., Mauro T.M., Gratton E. Two-photon fluorescence lifetime imaging of the skin stratum corneum pH gradient. Biophys. J. 2002;83:1682–1690. doi: 10.1016/S0006-3495(02)73936-2. [DOI] [PMC free article] [PubMed] [Google Scholar]
- 32.Ouimet J., Croft S., Paré C., Katsaras J., Lafleur M. Modulation of the polymorphism of the palmitic acid / cholesterol system by the pH. Langmuir. 2003;19:1089–1097. [Google Scholar]
- 33.Lieckfeldt R., Villalaín J., Gómez-Fernández J.-C., Lee G. Apparent pKa of the fatty acids within ordered mixtures of model human stratum corneum lipids. Pharm. Res. 1995;12:1614–1617. doi: 10.1023/a:1016280714593. [DOI] [PubMed] [Google Scholar]
- 34.Norlén L., Gil I.P., Simonsen A., Descouts P. Human stratum corneum lipid organization as observed by atomic force microscopy on Langmuir-Blodgett films. J. Struct. Biol. 2007;158:386–400. doi: 10.1016/j.jsb.2006.12.006. [DOI] [PubMed] [Google Scholar]
- 35.Dahlén B., Pascher I. Molecular arrangements in sphingolipids. Thermotropic phase behavior of tetracosanoylphytosphingosine. Chem. Phys. Lipids. 1979;24:119–133. [Google Scholar]
- 36.Allen M., Tildesley D. Clarendon Press; Oxford, UK: 1987. Computer Simulation of Liquids. [Google Scholar]
- 37.Seelig J., Niederberger W. Deuterium-labeled lipids as structural probes in liquid crystalline bilayers. Deuterium magnetic resonance study. J. Am. Chem. Soc. 1974;96:2069–2072. [Google Scholar]
- 38.Schofield P., Henderson J. Statistical mechanics of inhomogeneous fluids. Proc. R. Soc. Lond. A Math. Phys. Sci. 1982;379:231–246. [Google Scholar]
- 39.Lindahl E., Edholm O. Spatial and energetic-entropic decomposition of surface tension in lipid bilayers from molecular dynamics simulations. J. Chem. Phys. 2000;1113:3882–3893. [Google Scholar]
- 40.Sirota E.B., King H.E., Singer D.M., Shao H.H. Rotator phases of the normal alkanes: an x-ray scattering study. J. Chem. Phys. 1993;98:5809–5824. [Google Scholar]
- 41.Rawicz W., Olbrich K., McIntosh T., Needham D., Evans E. Effect of chain length and unsaturation on elasticity of lipid bilayers. Biophys. J. 2000;79:328–339. doi: 10.1016/S0006-3495(00)76295-3. [DOI] [PMC free article] [PubMed] [Google Scholar]
- 42.Lindahl E., Olle E. Mesoscopic undulations and thickness fluctuations in lipid bilayers from molecular dynamic simulations. Biophys. J. 2000;79:426–433. doi: 10.1016/S0006-3495(00)76304-1. [DOI] [PMC free article] [PubMed] [Google Scholar]
- 43.Radhakrishnan A., McConnell H. Condensed complexes of cholesterol and phospholipids. Biophys. J. 1999;77:1507–1517. doi: 10.1016/S0006-3495(99)76998-5. [DOI] [PMC free article] [PubMed] [Google Scholar]
- 44.Liu F., Sugar I., Chong P. Cholesterol and ergosterol superlattices in three-component liquid crystalline lipid bilayers as revealed by dehydroergosterol fluorescence. Biophys. J. 1997;72:2243–2254. doi: 10.1016/S0006-3495(97)78868-4. [DOI] [PMC free article] [PubMed] [Google Scholar]
Associated Data
This section collects any data citations, data availability statements, or supplementary materials included in this article.