

Abstract
All-atom molecular dynamics simulations of the ion current through OmpF, the major porin in the outer membrane of Escherichia coli, were performed. Starting from the crystal structure, the all-atom modeling allows us to calculate a parameter-free ion conductance in semiquantitative agreement with experiment. Discrepancies between modeling and experiment occur, e.g., at salt concentrations above 1 M KCl or at high temperatures. At lower salt concentrations, the ions have separate pathways along the channel surface. The constriction zone in the channel contains, on one side, a series of positively charges (R42, R82, R132), and on the opposite side, two negatively charged residues (D113, E117). Mutations generated in the constriction zone by removing cationic residues enhance the otherwise small cation selectivity, whereas removing the anionic residues reverses the selectivity. Reduction of the negatively charged residues decreases the conductance by half, whereas cationic residues enhance the conductance. Experiments on mutants confirm the results of the molecular-level simulations.
Introduction
The outer membrane porin OmpF is the major channel in Escherichia coli and allows the permeation of small hydrophilic molecules through the outer cell wall. For more than a decade, the crystal structure of OmpF has been known (1,2), and consequently, intensive investigations have been performed in experiments and computer simulations. For example, the channel served as a model for ion conductance (3–8) and solute translocation (9–12). Continuum models such as the Poisson-Nernst-Planck theory (13–15), Brownian dynamics (13,15), and Monte Carlo simulations (16) were performed to calculate the conductance of OmpF. The recent improvements in computational performance and the development of new algorithms allowed large-scale molecular dynamics (MD) simulations of biological pores (17–19).
It is now possible to compute channel conductance (20) using all-atom MD simulation and analyze the behavior of single protein residues and ions. In contrast to standard MD simulations, ion conductance calculations require application of an external electric field. In the simplest approach, the electric field is assumed to be homogeneous, and the voltage drops linearly over the simulation box (21–24); but the validity of this approximation needs to be further investigated (18,25,26). For example, Roux (27) recently reported an extensive investigation of this problem and confirmed the validity of the constant external electric field approximation. At the same time, more precise and computationally more demanding methods to simulate external electric fields were suggested. Sachs et al. (28) used a twin bilayer system to create, explicitly, two water phases with different ion concentrations. Our goal here is to understand the effect of the channel wall on the ion permeation. Subsequently, the results will have to be compared to bulk conductivity data. For the bulk concentration dependence a theoretical model is, for example, given by the Kohlrausch law (29). However, this theoretical approach cannot be applied in our case, since it is only applicable at very low salt concentrations.
OmpF is a slightly cation-selective trimer with a total length of ∼5 nm having an asymmetric geometry for each of its monomers (1). Every monomer consists of 340 residues ordered into 16 β-sheets forming a β-barrel. The β-sheets are connected with each other via loops on the extracellular side of the OmpF porin and turns on the periplasmic side. The L3 loop is folded into the pore, and narrows the channel width at the constriction zone, leading to an hourglass shape for the pore. In Fig. 1, an OmpF trimer is shown with its constriction zone highlighted.
Figure 1.
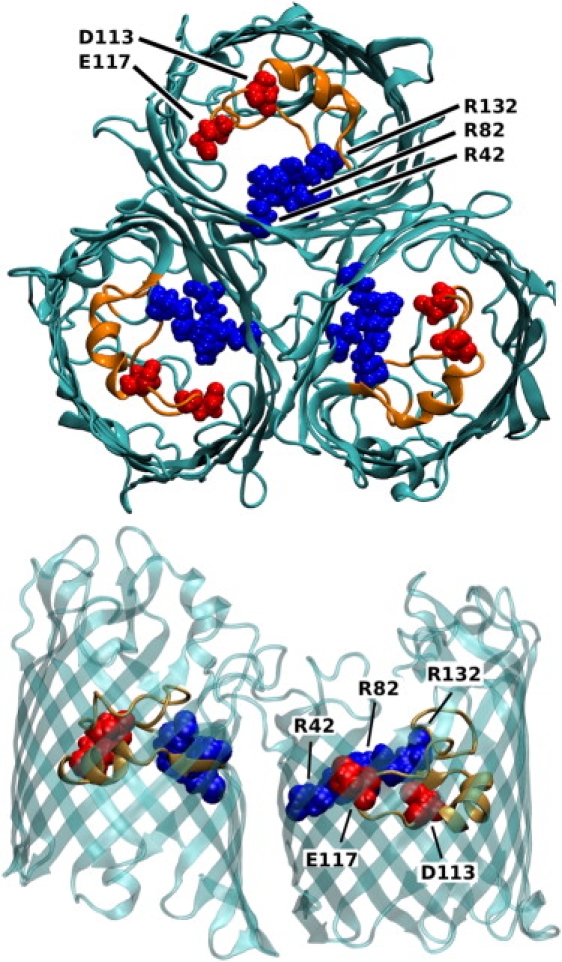
Top view of the OmpF trimer and side view of two of the monomers with highlighted constriction zone (red, negatively charged residues D113 and E117; blue, positively charged residues R42, R82, and R132; and orange, loop L3). The figure was generated using VMD (41).
Within this constriction zone, the bases R42, R82, and R132 face the acids D113 and E117 on the L3 loop, and this arrangement is therefore responsible for a strong transversal electric field. This field can orient molecules in the channel (4,30) as well as separate the ion fluxes along the surfaces of the pores (4,31,32). It is important to note, however, that performing point mutations may cause structural changes (33,34) that have a strong influence on the ion flux and selectivity (35–37). For example, Miedema et al. recently created a Ca2+-selective OmpF channel by point-mutating charged residues in the constriction zone (14,37,38), and other porins, such as the monomeric porin OmpG, have also been modified (39). To eliminate the spontaneous gating activities in this porin, MD simulations were employed to identify regions of OmpG taking part in the gating that were then eliminated by site-directed mutagenesis. For OmpF, we previously combined MD modeling with conductance measurements on single reconstituted channels and investigated the number of ion pairs formed at high salt concentration (40). In this article, we focus mainly on the accuracy of the MD simulations and on the effect of mutations.
Methods
Setup of the simulations
For a complete picture of ion transport and to benchmark the agreement between theory and experiment, bulk conductivity was simulated in a cubic box with a side length of 4.2 nm, filled with water molecules and potassium (K+) and chloride (Cl−) ions. This system size is large enough for the purpose of this study, as was tested previously (22). Within this box, ∼2500 water molecules are present. To obtain, e.g., a 1 M KCl solution, 45 K+ and 45 Cl− ions were added.
For the conductance simulations, the OmpF trimer was built out of monomers (crystal structure by Cowan et al. (1), Protein Data Bank code 2OMF) with protonation states of the residues in the channel chosen according to Im and Roux (4). The protein was embedded into a POPE membrane, which was constructed from preequilibrated patches using VMD (41). During this procedure, the membrane was located in the x-y plane and centered in z direction. In a first step, the simulation box was chosen to have a hexagonal profile in the x-y plane with a side length of the hexagon of 73 Å and 80 Å in z direction. This system contained ∼112,000 atoms. To reduce the computational time, a smaller system was used in a second step. The smaller size did not influence the accuracy of the results. In this case, the length of the hexagon was 63 Å in x-y direction and 79 Å in z direction. This system contained ∼85,000 atoms. To obtain a 1 M KCl solution having ∼15,000 water molecules (small setup), ∼520 ions (potassium and chloride) had to be added. To neutralize the highly charged pore, additionally, 30 potassium counterions were added.
Molecular dynamics simulations
The dynamics of all atoms in this systems is treated classically, i.e., using MD simulations. In these calculations, the ionic conductance through OmpF is determined using the general method described in Aksimentiev and Schulten (22). The MD simulations described below were performed using NAMD 2.6 (42) together with the CHARMM27 force field (43) and the TIP3P water model (44). Periodic boundary conditions are employed and the electrostatic is calculated with the particle mesh Ewald method (PME). The van der Waals potentials are evaluated with a cutoff of 12 Å and a switching distance of 10 Å. The nonbonded forces were evaluated every second time step and the electrostatic forces every fourth time step. Temperature control is gained by Langevin dynamics, which acts on a selection of atoms. For the bulk simulation, this selection contained only the oxygen atoms of the water molecules with a damping constant of 0.2 ps−1, whereas in the membrane simulations, only the heavy atoms of the lipids were selected with a damping constant of 1.0 ps−1, using the procedure in Aksimentiev and Schulten (22). A homogeneous external field E is applied in z direction proportional to the voltage V,
with the system length in z direction Lz. The field was applied using the build-in function of NAMD 2.6 (42). To give more flexibility to the hydrogen bonds, bond constraints are not applied, and therefore the time step is set to 1 fs in NAMD as, e.g., in Aksimentiev and Schulten (22) and in Sotomayor et al. (24).
The system was equilibrated for 1 ns in a NpT ensemble, followed by a 1-ns equilibration run in an NVT ensemble with an electrical field corresponding to an applied voltage of 1 V. For the simulation of I/V characteristics, different voltages ranging from −1 V to 1 V were applied. Since the system is periodic ions that leave the simulation box will reenter from the opposite side of the simulation box. This prevents the system from getting partially charged. For the bulk simulations, trajectories of 3–4 ns with an applied external field were produced and then analyzed. For these simulations, a voltage of 0.4 V was applied. In the case of membrane simulations, the corresponding trajectories have a length of 10 ns.
Due to the atomic details of the simulations, the pathways of ions and molecules through the pore could be tracked. The ionic current is determined by summing up the movement of the charges projected on z direction via (21,22)
| (1) |
A time step Δt of 10 ps for evaluating this expression is sufficient. The results are independent of the time step Δt. In addition, the current was also determined by counting the number of ions that cross a surface in the x-y plane in a certain time span. The results are rather similar to the results of Eq. 1, but lead to higher standard deviations over the duration of one trajectory. The advantage of the procedure from Eq. 1 is that it gives a means to calculate the error of the current value by assuming a Poisson distribution for permeation events (24). The underlying physical assumption for this Poisson distribution is the statistical independence of the individual ion crossings. The error of a single trajectory is then calculated using , where Nc is the number of crossing events. The drift of the center of mass is taken into account in the determination of the current. The potassium and chloride currents are compared to each other to obtain a measure for the selectivity.
Whereas in experiment, a voltage of ±1 V applied for a few microseconds destroys the membrane, in simulations, a smaller voltage leads to bad statistics that have to be compensated for by longer simulation times. Higher voltages (>±2 V) destroy the membrane even in simulations. In experiments, 50 mV is used so that one can use the same membrane in a complete series of measurement without destroying it.
Setup of the experiments
Ion conductance of a reconstituted OmpF trimer was measured in the temperature range from 0°C to 90°C as previously described in Chimerel et al. (40). Briefly, a single OmpF nanopore is reconstituted into an electric-insulating lipid bilayer connecting two electrolyte solutions (45). When a voltage is applied across the lipid bilayer and implicitly across the nanopore, an ion current is detected. Single-channel insertion was achieved by adding OmpF to the aqueous phase at the cis side of the membrane while stirring. Lipid bilayers are formed according to the method by Montal and Mueller (46). The following key steps are important for experimental study at different temperatures: the use of squalene as a prepainting solution; and the use of holes with up to 50-μm diameter in a 25-μm-thick Teflon foil. The squalene does not freeze at low temperatures and it is thus well suited for such a study in a broad temperature range. Furthermore, the small apertures in the Teflon film increases the lipid bilayer stability for high temperatures. Evaporation for high temperatures is reduced by using a thin layer of mineral oil on the surface of the solvent. Further details of the setup and the selectivity measurements are presented in the Supporting Material. For example, Fig. S1 in the Supporting Material shows measured ion current traces for different temperatures.
Results
Modeling of KCl conductivity in bulk water
As a first step, the concentration and temperature dependence of KCl in bulk water is modeled starting with a similar approach previously reported in Aksimentiev and Schulten (22). As a control on the underlying interactions, the temperature dependence was calculated and compared to the experimental values. The temperature dependence from 2 to 90°C of the bulk conductivity is shown in Fig. 2. Modeling and experimental results are given for the three different KCl concentrations 0.5, 1.0, and 1.5 M. The agreement between experiment and theory is best for the 0.5 M concentration with only a slight difference between the experimental and theoretical slopes. Larger differences become visible at 1.0 M and more pronounced for 1.5 M KCl. Higher temperatures cause larger deviations. It is not too surprising that the best agreement between experimental and theoretical data is in the temperature range between 20 and 40°C, since the employed force-field parameters were fitted temperature-independently to data obtained roughly at room temperature.
Figure 2.
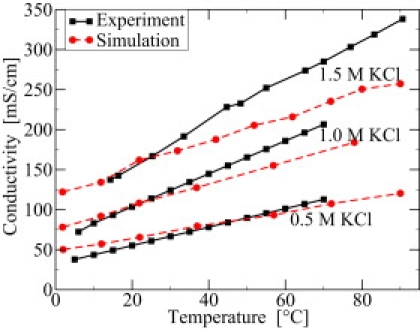
Bulk conductivity versus temperature for different salt concentrations in experiment (solid lines) and simulation (dashed lines).
To elucidate the agreement and disagreement in more detail, in Fig. 3 the concentration dependence of the conductivity is shown at a fixed temperature of 37°C. Obviously the agreement between experimental and theoretical data is very good for concentrations <1 M. For concentrations above 1 M, the deviations increase rapidly, since the theoretical conductivity saturates while the experimental data show a rather linear behavior in the studied concentration regime up to 4 M. Subsequently, we reduce ourselves to the range 0.5 M–1 M KCl solutions.
Figure 3.
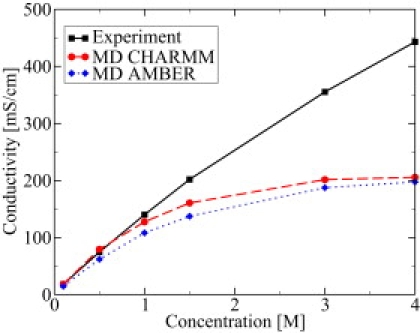
Bulk conductivity versus ion concentration at a fixed temperature of 37°C for experiment and MD simulation with CHARMM and improved AMBER force fields.
As detailed in Methods, all simulations described in this article are performed using the CHARMM force fields. Nevertheless, test calculations with AMBER force fields (GAFF 94) were performed and showed heavy clustering of the K+ and Cl− ions. This behavior has also been reported recently by Chen and Pappu (47) and by Auffinger et al. (48), together with some proposed enhancement. The problem with the original AMBER force fields are inaccurate van der Waals parameters for the potassium ions. These parameters were improved to obtain more realistic results (47). Using these improved AMBER parameters, clustering is prevented, and as shown in Fig. 3, similar results for the bulk conductivity compared with those obtained with the CHARMM force fields can be achieved.
Conductance of KCl through OmpF
Each simulation for the OmpF system covered ∼10 ns. After an equilibration period, the external electric field was applied (see Methods) to calculate the current through the OmpF trimer. In Fig. S2, the cumulative current is displayed, and from its slope, the current is deduced, which is equivalent to using Eq. 1. Furthermore, the conductance is calculated as the ratio of current and applied voltage.
In Fig. 4 we compare the measured conductance with modeling. Using 0.5 M and 1 M KCl solutions as electrolyte, an external voltage of 1 V was applied for simulations whereas the black lipid membrane experiments were performed at 50 mV. Since the conductance is shown, experiment and simulation are directly comparable, assuming a linear I/V characteristic (see below). The experiments show a rather linear behavior of conductance versus temperature for both salt concentrations. Nevertheless, the increase is slightly faster than linear. Compared to the experiments, the calculated curves show more fluctuations; these are due to the uncertainty in the simulation data, as discussed below. The general trend of the slope is rather similar to the experimental one but the absolute values are too small.
Figure 4.
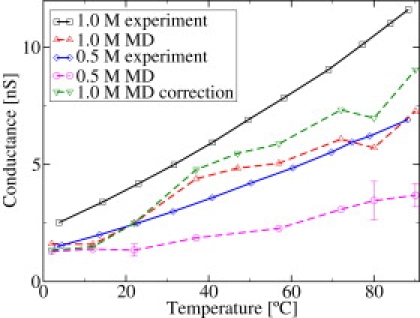
Conductance versus temperature for simulations with 1 V and experiments with 50 mV applied voltage for two different salt concentrations. Simulation results, corrected for the bulk deficiencies, are also shown for the 1 M KCl solution.
As obtained by repeated measurements, the error for the experimental measurement is within the point size. To get a handle on the errors that come with the MD simulations, two different kinds of error analysis are performed. Assuming independent permeation events (see Methods), the error in the current can be estimated as . This leads to an error of 13% at maximum. As a second method, an error analysis was performed by repeating the simulations for identical configurations several times and calculating the standard deviation. For 0.5 M and 80 as well as 90°C, the simulations were repeated four times and for 23°C, nine times. Because of the large computational costs, the error analysis is performed only for these temperatures, and not for all the temperatures shown in Fig. 4. The relative error obtained using this method were 20, 24, and 14% for 23, 80, and 90°C, respectively. Especially at 80°C, it can clearly be seen that the error obtained using the latter method is much larger than the first approach, which implied uncorrelated permeation events. This is a clear indicator of the fact that the ion transport through the pore is a highly correlated process. By inspecting the trajectories more closely, it can be seen that some of the ions get stuck for rather long times—several nanoseconds, for example, at the corresponding countercharges at the inner channel surface, especially near the constriction zone. This can result in a significant current fluctuation. In the subsequent discussions of results, it will be assumed that the error in the current is 20%. The simulation parameters and results are also presented in Table S1 in the Supporting Material.
In a further step, this data is corrected by introducing a temperature-dependent correction factor deduced from the ratio of simulated and experimental bulk conductivity. A similar correction was introduced in Sotomayor et al. (24) for the voltage dependence. This corrects for some of the force-field deficiencies that already occur in the bulk simulations. The results for the 1 M concentration including correction are shown in Fig. 4. One can see that with the correction, the slope of the experimental and simulated conductance are quite similar. The correction is not applied here for the 0.5 M simulation, since, in that case, the correction factor is close to unity.
Fig. 5 shows cuts of the electrostatic potential map for ±1 V in the y-z plane through the center of one of the pores. As previously suggested for α-hemolysin (22) and the MScS channel (23,24), these plots have been obtained by averaging the electrostatic field of all atoms as well as the external electrostatic field over a complete trajectory. Therefore, these reflect an overlay of external field, membrane and protein charges, and averaged ion positions. The pore is in the middle of these cuts and the ions are driven by the electrical field through this pore. The resulting electric field is, of course, influenced by the pore and by the lipids. In Fig. 5, the lipids are located at z positions between ±20 Å and have a large positive potential difference between bulk and lipid. As one can see, the lipids constitute an electrostatic barrier while the potential in the water regions above and below the membrane is more or less constant. The gradient of the membrane potential, and especially the absence of peaks in the headgroup area, are typical for CHARMM force fields (49). There is, basically, no potential change in the water above and below the membrane, but only within the membrane and protein region.
Figure 5.
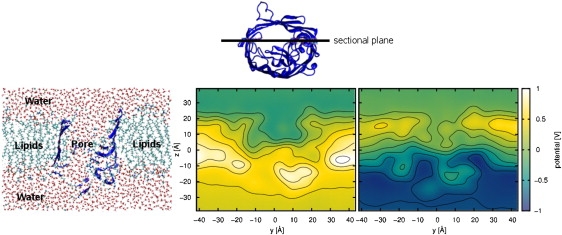
Electrostatic potential maps for V = ±1 V in the y-z plane (as shown on the left-hand side) at an x position corresponding to the middle of one of the three pores (as shown in the top panel). The graphs have been calculated using a modified PMEPot plug-in for VMD (22,24).
In Fig. 4, the experimental and theoretical conductance data are compared assuming a linear I/V characteristics. The I/V curve of OmpF in a 1 M KCl solution is shown in Fig. 6. Within the experimentally available voltages an almost linear relation is obtained. The theoretical curve is nonlinear. At large voltage, the slope of the I/V curve is in reasonable agreement with the slope from the experimental data. At low voltages in the simulations, the current is much smaller than in experiment. This might be due to several reasons, including the protonation states of some channel residues that are more important at smaller external fields, and the bad statistics in the MD results due to the finite simulation time of 10 ns.
Figure 6.
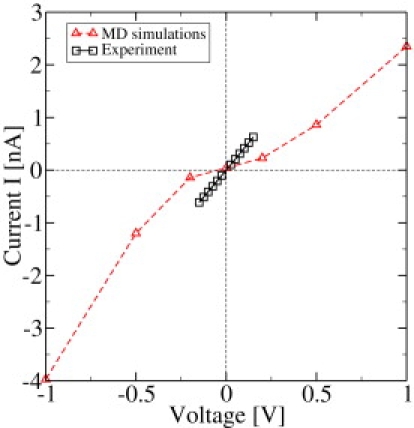
I/V curve for experiment and simulation at room temperature.
Perturbing the ion flux and selectivity by mutations in the constriction zone
Starting with the wild-type (wt) configuration, the ion flux is perturbed by introducing mutations in the constriction zone. To understand the influence of the charged residues, five different combinations were mutated. The generated mutants are:
-
1.
NQAAA (note that this notation indicates the final residue configuration): All charged residues in the constriction zone were neutralized (D113N, E117Q, R42A, R82A, and R132A).
-
2.
NQRRR: All negatively charged residues in the constriction zone were neutralized (D113N and E117Q).
-
3.
DEAAA: All positively charged residues in the constriction zone were neutralized (R42A, R82A, and R132A).
-
4.
RRRRR+EE: All negatively charged residues in the constriction zone mutated into positively charged, and two additional positively charged residues at the extracellular vestibule mutated into negatively charged residues (D113R and E117R; and R167E and R168E).
-
5.
DEERE: Two positively charged residues in the constriction zone mutated into negatively charged residues (R42E and R132E).
The mutation RRRRR+EE has the same net charge as the wt but the positions of the charged residues have been altered. An increased Ca2+ over Cl− selectivity has been introduced with the mutation DEERE (14). In the NQRRR, the RRRRR+EE, and the DEERE mutations, the mutated amino acids have approximately the same size as those in the wt, i.e., the size of the constriction zone is approximately preserved, but with some local rearrangements due to charge modifications. Since alanine is smaller than arginine, the size is changed as well for the mutants NQAAA and DEAAA. In the simulations, the wt system was equilibrated in a NpT ensemble, then the mutated variant was equilibrated. The applied voltage simulations lasted for 10 ns and the stability of the systems was checked using the root mean-square deviation. In addition, the mutants NQRRR and DEAAA were created experimentally using point mutagenesis and their KCl conductance and selectivity were measured.
In the cases of NQAAA, the neutral constriction zone, the current is approximately the same as that of the wt as shown in Table 1. Since most conductance values have been determined by a single trajectory, the uncertainty is rather high, and therefore all conductance values within a range of ±20% are assumed the same. Mutating just the negatively charged residues (NQRRR) leads to a decrease of the conductance by almost a factor of two. In the experiments as well, a decrease of the conductance was observed. In the RRRRR+EE mutation, this effect is even enhanced. On the other hand, mutating the positively charged residues (DEAAA) will lead to an increased conductance as it does for the DEERE mutation. For the DEAAA mutant, a higher conductance was measured in experiment as well, although the increase was not as large as in the simulations.
Table 1.
Conductance G from MD simulation and from experiment; the theoretical ratio of the partial currents ; the selectivity S from experiment; and the estimated selectivity from simulation at 22°C for 1 M KCl wt and for different mutants
| Acronym | Mutated residues | GMD [nS] | Gexp [nS] | Sexp | Sest | ||
|---|---|---|---|---|---|---|---|
| wt | — | 3.0 | 4.0 | 1.2 | 3.5 ± 0.2 | 3.5 | |
| NQAAA | Negative and positive neutralized | 3.4 | 3.6 | 10.5 | |||
| NQRRR | Negative neutralized | 1.9 | 1.8 | 0.7 | 2.9 ± 0.2 | 2.0 | |
| DEAAA | Positive neutralized | 4.7 | 4.2 | 4.5 | 14.1 ± 1.4 | 13.1 | |
| RRRRR+EE | Negative to positive and positive to negative | 1.2 | 0.1 | 0.3 | |||
| DEERE | Positive to negative | 4.1 | 5.6 | 16.3 |
The second row shows which charges in the constriction zone have been neutralized or changed in sign (RRRRR+EE and DEERE).
A second important quantity is the selectivity. Usually the selectivity of ion channels is characterized in the framework of the Goldman-Hodgkin-Katz voltage equation (50) defined by the permeability ratio of two ion sorts. It is well known (51) that wt OmpF is slightly cation-selective, and in agreement with this, the current ratio has a value of 1.2 (see Table 1). This value nicely agrees with the value earlier obtained by PNP and Brownian dynamics simulations by Im and Roux (13). Im and Roux also extracted the selectivity from their simulations either by determining the current ratio at zero applied voltage or at the reversal potential. (Note that both are not easily possible for the present MD simulations.) Using some approximations and special considerations for the case of OmpF, Im and Roux (13) even showed the approximate equivalence between permeability and current ratios. To estimate the selectivity for mutants, we assume the current ratio of 1.2 to correspond to a selectivity of 3.5 as measured for the wt. Subsequently, we multiply the current ratios of the mutants by the corresponding factor of 3.5:1.2 to obtain an estimate for the selectivity. This estimate is denoted Sest in Table 1 and for the wt OmpF it is, by definition, equal to the experimental value.
Concerning the selectivity there is a significant change in the current ratio in almost all studied mutations. As expected, removing negative charges (NQRRR) leads to more anions than cations passing the pore. Removing positive charges in the constriction zone (DEAAA and DEERE) has the opposite effect. Already the single mutation R82Q has a clearly visible effect beyond the numerical uncertainties (not shown in Table 1). When all positive residues in the constriction zone are mutated into neutral ones (DEAAA), the ratio IK/ICl is approximately four times as large as for the wt. Interestingly, the result for neutralizing all charges (NQAAA) is quite similar to that of only neutralizing the positive charges (DEAAA). In Fig. 7, the selectivity and the conductance are shown as function of the charged residues in the constriction zone. Interestingly, one finds an almost linear dependence of the conductance on the net charge in the constriction zone. However, one also finds the specific arrangement of the charges plays an important role and that the conductance of the DEERE mutant is smaller than that of the DEAAA mutant. The arrangement of the charges in the constriction zone also has an important influence on the selectivity which, for example, increases by a factor of three when going from the wt to the NQAAA mutant. In the latter mutant, there are no charges within the constriction zone, whereas in the wt, five charges result in a net charge of only one.
Figure 7.
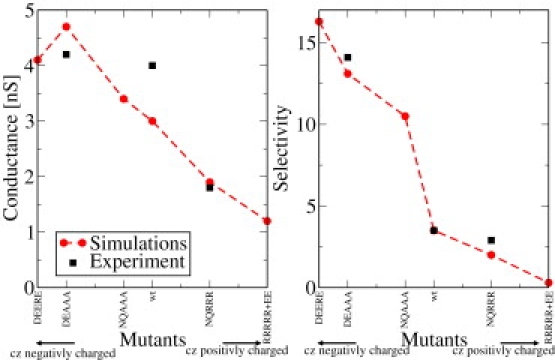
Dependence of the conductance and ion current ratio on the net charge in the constriction zone (cz) for different mutations.
Table 1 not only shows the simulated conductances and selectivities for wt OmpF and five mutants but also the measured conductances and selectivities for the wt and two mutants. In simulations and experiments, the selectivity of the NQRRR mutant decreases, whereas for the DEAAA mutant, in both cases, the selectivity increases by approximately a factor of four. This agreement between theory and measurements further strengthens the validity of these MD simulations.
Discussion
Motivated by the agreement between modeling and experiment for α-hemolysin (22), we focused on the underlying molecular mechanism of ion conductance through OmpF. To elucidate the influence of the channel wall, we first tested the bulk conductivity in all-atom MD simulations. For salt concentrations up to 1 M, the agreement between experiment and theory is rather encouraging, although the force fields used (i.e., the CHARMM parameterization) were created in a temperature-independent way. Already in the case of bulk simulations, there is an increasing difference between theory and experiment for larger salt concentrations.
In the case of OmpF simulations, the theoretical conductance-temperature curve shows some fluctuation that clearly displays the limitations of our MD simulations. These are caused by the heavy numerical calculations involved. In the best case, one would do an extensive sampling, i.e., run the same simulation repeatedly with different initial positions and velocities possible for the experimental setup. This is computationally not feasible, as, already, the determination of even one conductance value needs a 10-ns simulation of the full system. To estimate the error, three values were computed several times, and from this we estimated an error of ∼20% for these values. This error is, of course, much larger than in the bulk simulations, because the ions now have to pass through the three narrow pores of the trimer, and therefore, the ion-counting statistics become much worse. Therefore, it is also problematic to perform calculations with low salt concentrations such as 100 mM, since the number of ions in the system is then reduced by a factor of 10 and longer simulation times would be needed for a decent statistical measure.
Several coarse-grained simulations, especially Brownian dynamics simulations and continuum models such as the Nernst-Planck formalism (8,13–15), have been performed for OmpF. Such calculations have an advantage, in that they do not suffer from the sampling problem to the extent that our MD simulations do. However, these theories involve several more or less severe approximations. One can, of course, try to determine the parameters for these simplified formalisms from all-atoms simulations as performed by Im and Roux (4) and others (23,24). Such a hierarchy of models is certainly needed at some point (52), but is also not without its problems. Diffusion constants, for example, are normally needed in such models, but would have to be fitted as temperature-dependent for a study such as ours. In addition, ion-ion interaction or the hydration shells are much more difficult, or even impossible, to handle. Molecular details such as ion pairing (40) do need an all-atom representation to enable us to catch the most important facts.
The conductance and the selectivity of a nanopore can be engineered using mutations. The present results of the simulations and the experimental data show good qualitative agreement. The measured values of the reversal potential, and therefore, the selectivity for wild-type OmpF, are similar to those previously reported in the literature (5,6,53,54). The value for the reversal potential, in the case of the mutant DEAAA, is in good agreement with experimental data by Miedema et al. (14), and the difference in the pH value between these studies supports data by Aguilella-Arzo et al. suggesting a plateau for the reversal potential in the range of pH 6–8 (8). For the NQRRR mutant, note that a decrease in the cationic selectivity was also reported for CaCl2 (55). Applying Brownian dynamics simulations, Phale et al. (36) have shown that in the case of this mutant in a NaCl solution, the ion conductance is reduced by a factor of two compared to the wt, and that the selectivity (PNa/PCl) is changing from 4.5 (wild-type) to 1.0 (NQRRR). Furthermore, Phale et al. (36) studied the same fivefold mutation as in Table 1 (NQAAA), and observed an increase of the selectivity from 4.5 (wt) to 12.3 (NQAAA), which is in good agreement with the threefold increased ratio IK/ICl observed for KCl in this investigation. Using Brownian dynamics and PNP approaches, conductances and selectivities for mutants not studied here were obtained by others (8,13), which support our main conclusions.
Using Brownian dynamics, Schirmer and Phale (32) as well as Im and Roux (13) analyzed the average ion density in the channel. They found two separate pathways for the chlorine and potassium ions while passing the pore. As expected, the positive potassium ions tend to be located close to negative residues at the inner pore surface, whereas the negative chlorine ions are near to the positive residues, as also found in this study and displayed in Fig. 8. If one compares the iso-surfaces of the ion density of the mutated pores with those of the wild-type, it can be seen that the densities change considerably. For the mutation NQAAA, the chloride ion density is drastically reduced close to the constriction zone. This is in accordance with the enlarged ratio IK/ICl and the experimental measured selectivity as given in Table 1; therefore, the change in selectivity can be nicely correlated with the iso-density plots. For the third case in Fig. 8, the mutation NQRRR, one can observe a reduced potassium iso-density, whereas the chloride density looks similar to that of the wt. Consequently and in accordance with Table 1, not only is the potassium selectivity changed into that of a chloride, but the total current is also reduced.
Figure 8.
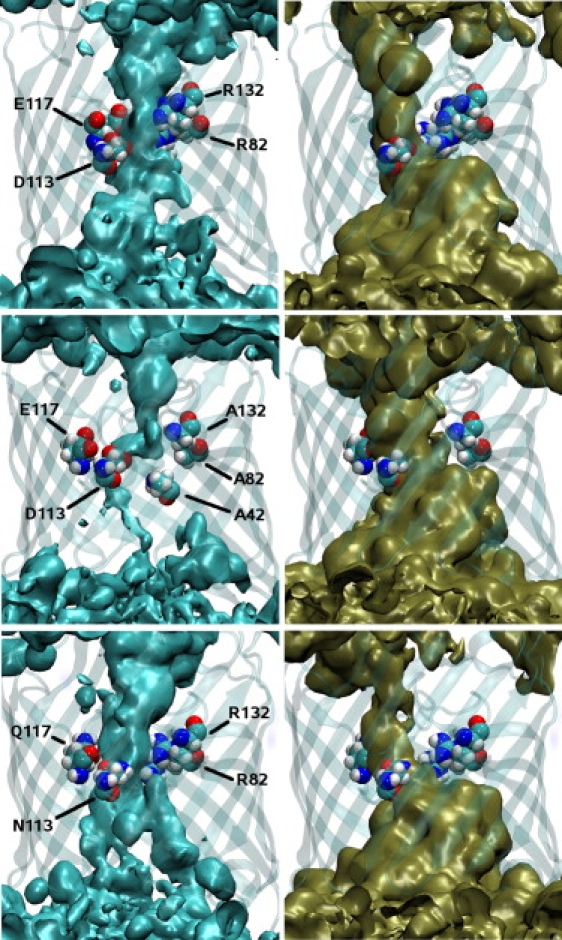
Iso-density surfaces of the Cl− (left) and K+ densities (right) averaged over the full trajectory. The top row displays the wt, the middle row the protein with all bases in the constriction zone mutated to neutral ones (DEAAA), and the bottom row with all acidic residues to neutral ones (NQRRR). The shown iso-surfaces in all subfigures have all the same iso-value. In addition, the charged/mutated residues in the constriction zone are highlighted. The figures were generated using VMD (41).
Conclusions
Although our all-atom simulations are already rather CPU-time-demanding, there are several points that can certainly be improved. There is some uncertainty in the protonation states of some of the residues; especially important are those in the constriction zone (4,7,56,57). It has been shown here both numerically as well as experimentally, that mutating the charge of just one residue within the constriction zone can have a clearly visible effect on the transport properties of the channel. The role of polarization effects could also be significant. Furthermore, it is assumed that simulations with improved water models and polarizable force fields would improve the results.
Understanding and modifying the details of ion transport through OmpF would make it possible to alter the function of OmpF. Recently, for example, it has been reported that OmpF can be made Ca2+-selective by a few mutations in the constriction zone (37), and that the charge selectivity in α-hemolysin has been modified by using noncovalent molecular adapters (58). The ion conductance can also be used as a probe for the opening degree of channels such as TolC (59).
Channels such as OmpF are not only an interesting membrane protein concerning ion transport but may be much more important concerning the translocation of substrate molecules and especially of antibiotics (9,11). This is a field of intensive investigations both experimentally (9,12) and theoretically (10,30,60,61). In the experiments, the translocation of molecules is indirectly measured, monitoring the blockage of the channel and the resulting drop in ion conductance. For a complete simulation of the experimental setup, a combined study of ion transport and substrate translocation is needed. Work in this direction is in progress.
Supporting Material
Details of the experimental setup as well as one table and two figures are available at http://www.biophysj.org/biophysj/supplemental/S0006-3495(09)01240-5.
Supporting Material
Acknowledgments
We acknowledge financial support through grant No. MRTN-CT-2005-019335 (Translocation).
References
- 1.Cowan S.W., Garavito R.M., Jansonius J.N., Jenkins J.A., Karlsson R. The structure of OmpF porin in a tetragonal crystal form. Structure. 1995;3:1041–1050. doi: 10.1016/s0969-2126(01)00240-4. [DOI] [PubMed] [Google Scholar]
- 2.Watanabe M., Rosenbusch J., Schirmer T., Karplus M. Computer simulations of the OmpF porin from the outer membrane of Escherichia coli. Biophys. J. 1997;72:2094–2102. doi: 10.1016/S0006-3495(97)78852-0. [DOI] [PMC free article] [PubMed] [Google Scholar]
- 3.Karshikoff A., Spassov V., Cowan S.W., Ladenstein R., Schirmer T. Electrostatic properties of two porin channels from Escherichia coli. J. Mol. Biol. 1994;240:372–374. doi: 10.1006/jmbi.1994.1451. [DOI] [PubMed] [Google Scholar]
- 4.Im W., Roux B. Ions and counterions in a biological channel: a molecular dynamics simulation of OmpF porin from Escherichia coli in an explicit membrane with 1 M KCl aqueous salt solution. J. Mol. Biol. 2002;319:1177–1197. doi: 10.1016/S0022-2836(02)00380-7. [DOI] [PubMed] [Google Scholar]
- 5.Danelon C., Suenaga A., Winterhalter M., Yamato I. Molecular origin of the cation selectivity in OmpF porin: single channel conductances vs. free energy calculation. Biophys. Chem. 2003;104:591–603. doi: 10.1016/s0301-4622(03)00062-0. [DOI] [PubMed] [Google Scholar]
- 6.Nestorovich E.M., Rostovtseva T.K., Bezrukov S.M. Residue ionization and ion transport through OmpF channels. Biophys. J. 2003;85:3718–3719. doi: 10.1016/S0006-3495(03)74788-2. [DOI] [PMC free article] [PubMed] [Google Scholar]
- 7.Alcaraz A., Nestorovich E.M., Aguilella-Arzo M., Aguilella V.M., Bezrukov S.M. Salting out the ionic selectivity of a wide channel: the asymmetry of OmpF. Biophys. J. 2004;87:943–947. doi: 10.1529/biophysj.104/043414. [DOI] [PMC free article] [PubMed] [Google Scholar]
- 8.Aguilella-Arzo M., Garcia-Celma J.J., Cervera J., Alcaraz A., Aguilella V.M. Electrostatic properties and macroscopic electrodiffusion in OmpF porin and mutants. Bioelectrochemistry. 2006;70:320–327. doi: 10.1016/j.bioelechem.2006.04.005. [DOI] [PubMed] [Google Scholar]
- 9.Nestorovich E.M., Danelon C., Winterhalter M., Bezrukov S.M. Designed to penetrate: time-resolved interaction of single antibiotic molecules with bacterial pores. Proc. Natl. Acad. Sci. USA. 2002;99:9789–9794. doi: 10.1073/pnas.152206799. [DOI] [PMC free article] [PubMed] [Google Scholar]
- 10.Ceccarelli M., Danelon C., Laio A., Parrinello M. Microscopic mechanism of antibiotics translocation through a porin. Biophys. J. 2004;87:58–64. doi: 10.1529/biophysj.103.037283. [DOI] [PMC free article] [PubMed] [Google Scholar]
- 11.Danelon C., Nestorovich E.M., Winterhalter M., Ceccarelli M., Bezrukov S.M. Interaction of zwitterionic penicillins with the OmpF channel facilitates their translocation. Biophys. J. 2006;90:1617–1627. doi: 10.1529/biophysj.105.075192. [DOI] [PMC free article] [PubMed] [Google Scholar]
- 12.Pages J.M., James C.E., Winterhalter M. The porin and the permeating antibiotic: a selective diffusion barrier in Gram-negative bacteria. Nat. Rev. Microbiol. 2008;6:893–903. doi: 10.1038/nrmicro1994. [DOI] [PubMed] [Google Scholar]
- 13.Im W., Roux B. Ion permeation and selectivity of OmpF porin: a theoretical study based on molecular dynamics, Brownian dynamics, and continuum electrodiffusion theory. J. Mol. Biol. 2002;322:851–859. doi: 10.1016/s0022-2836(02)00778-7. [DOI] [PubMed] [Google Scholar]
- 14.Miedema H., Meter-Arkema A., Wierenga J., Tang J., Eisenberg B. Permeation properties of an engineered bacterial OmpF porin containing the EEEE-locus of Ca2+ channels. Biophys. J. 2004;87:3137–3147. doi: 10.1529/biophysj.104.041384. [DOI] [PMC free article] [PubMed] [Google Scholar]
- 15.Chung S.H., Corry B. Three computational methods for studying permeation, selectivity and dynamics in biological ion channels. Soft Matter. 2005;1:417–427. doi: 10.1039/b512455g. [DOI] [PubMed] [Google Scholar]
- 16.Lee K.-I., Park Y.J., van der Straaten T., Kathawala G., Ravaioli U. Simulation of ion conduction in the OmpF porin channel using BioMOCA. J. Comp. Elec. 2005;4:157–160. [Google Scholar]
- 17.Bond P.J., Sansom M.S. The simulation approach to bacterial outer membrane proteins. Mol. Membr. Biol. 2004;21:151–161. doi: 10.1080/0968760410001699169. [DOI] [PubMed] [Google Scholar]
- 18.Roux B., Allen T., Berneche S., Im W. Theoretical and computational models of biological ion channels. Q. Rev. Biophys. 2004;37:15–103. doi: 10.1017/s0033583504003968. [DOI] [PubMed] [Google Scholar]
- 19.Tieleman D.P. Computer simulations of transport through membranes: passive diffusion, pores, channels and transporters. Clin. Exp. Pharmacol. Physiol. 2006;33:893–903. doi: 10.1111/j.1440-1681.2006.04461.x. [DOI] [PubMed] [Google Scholar]
- 20.Anishkin A., Sukharev S. Explicit channel conductance: can it be computed? Biophys. J. 2005;88:3742–3743. doi: 10.1529/biophysj.105.060996. [DOI] [PMC free article] [PubMed] [Google Scholar]
- 21.Crozier P.S., Henderson D., Rowley R.L., Busath D.D. Model channel ion currents in NaCl-extended simple point charge water solution with applied-field molecular dynamics. Biophys. J. 2001;81:3077–3079. doi: 10.1016/S0006-3495(01)75946-2. [DOI] [PMC free article] [PubMed] [Google Scholar]
- 22.Aksimentiev A., Schulten K. Imaging α-hemolysin with molecular dynamics: ionic conductance, osmotic permeability, and the electrostatic potential map. Biophys. J. 2005;88:3745–3751. doi: 10.1529/biophysj.104.058727. [DOI] [PMC free article] [PubMed] [Google Scholar]
- 23.Sotomayor M., van der Straaten T.A., Ravaioli U., Schulten K. Electrostatic properties of the mechanosensitive channel of small conductance MscS. Biophys. J. 2006;90:3496–3500. doi: 10.1529/biophysj.105.080069. [DOI] [PMC free article] [PubMed] [Google Scholar]
- 24.Sotomayor M., Vasquez V., Perozo E., Schulten K. Ion conduction through MscS as determined by electrophysiology and simulation. Biophys. J. 2007;92:886–902. doi: 10.1529/biophysj.106.095232. [DOI] [PMC free article] [PubMed] [Google Scholar]
- 25.Delemotte L., Dehez F., Treptow W., Tarek M. Modeling membranes under a transmembrane potential. J. Phys. Chem. B. 2008;112:5547–5550. doi: 10.1021/jp710846y. [DOI] [PubMed] [Google Scholar]
- 26.Böckmann R.A., de Groot B.L., Kakorin S., Neumann E., Grubmüller H. Kinetics, statistics, and energetics of lipid membrane electroporation studied by molecular dynamics simulations. Biophys. J. 2008;95:1837–1840. doi: 10.1529/biophysj.108.129437. [DOI] [PMC free article] [PubMed] [Google Scholar]
- 27.Roux B. The membrane potential and its representation by a constant electric field in computer simulations. Biophys. J. 2008;95:4205–4216. doi: 10.1529/biophysj.108.136499. [DOI] [PMC free article] [PubMed] [Google Scholar]
- 28.Sachs J.N., Crozier P.S., Woolf T.B. Atomistic simulations of biologically realistic transmembrane potential gradients. J. Chem. Phys. 2004;121:10847–10851. doi: 10.1063/1.1826056. [DOI] [PubMed] [Google Scholar]
- 29.Atkins P.W., de Paula J. 7th Ed. Oxford University Press; Oxford, UK: 2004. Physical Chemistry. [Google Scholar]
- 30.Robertson K.M., Tieleman D.P. Orientation and interactions of dipolar molecules during transport through OmpF porin. FEBS Lett. 2002;528:53–57. doi: 10.1016/s0014-5793(02)03173-3. [DOI] [PubMed] [Google Scholar]
- 31.Tieleman D.P., Berendsen H.J. A molecular dynamics study of the pores formed by Escherichia coli OmpF porin in a fully hydrated palmitoyloleoylphosphatidylcholine bilayer. Biophys. J. 1998;74:2786–2791. doi: 10.1016/S0006-3495(98)77986-X. [DOI] [PMC free article] [PubMed] [Google Scholar]
- 32.Schirmer T., Phale P.S. Brownian dynamics simulation of ion flow through porin channels. J. Mol. Biol. 1999;294:1159–1167. doi: 10.1006/jmbi.1999.3326. [DOI] [PubMed] [Google Scholar]
- 33.Jeanteur D., Schirmer T., Fourel D., Simonet V., Rummel G. Structural and functional alterations of a colicin-resistant mutant of OmpF porin from Escherichia coli. Proc. Natl. Acad. Sci. USA. 1994;91:10675–10679. doi: 10.1073/pnas.91.22.10675. [DOI] [PMC free article] [PubMed] [Google Scholar]
- 34.Phale P.S., Philippsen A., Kiefhaber T., Koebnik R., Phale V.P. Stability of trimeric OmpF porin: the contributions of the latching loop L2. Biochemistry. 1998;37:15663–15670. doi: 10.1021/bi981215c. [DOI] [PubMed] [Google Scholar]
- 35.Phale P.S., Schirmer T., Prilipov A., Lou K.L., Hardmeyer A. Voltage gating of Escherichia coli porin channels: role of the constriction loop. Proc. Natl. Acad. Sci. USA. 1997;94:6741–6745. doi: 10.1073/pnas.94.13.6741. [DOI] [PMC free article] [PubMed] [Google Scholar]
- 36.Phale P.S., Philippsen A., Widmer C., Phale V.P., Rosenbusch J.P. Role of charged residues at the OmpF porin channel constriction probed by mutagenesis and simulation. Biochemistry. 2001;40:6319–6325. doi: 10.1021/bi010046k. [DOI] [PubMed] [Google Scholar]
- 37.Miedema H., Vrouenraets M., Wierenga J., Gillespie D., Eisenberg B. Ca2+ selectivity of a chemically modified OmpF with reduced pore volume. Biophys. J. 2006;91:4392–4400. doi: 10.1529/biophysj.106.087114. [DOI] [PMC free article] [PubMed] [Google Scholar]
- 38.Miedema H., Vrouenraets M., Wierenga J., Eisenberg B., Schirmer T. Conductance and selectivity fluctuations in D127 mutants of the bacterial porin OmpF. Eur. Biophys. J. 2006;36:13–22. doi: 10.1007/s00249-006-0084-4. [DOI] [PubMed] [Google Scholar]
- 39.Chen M., Khalid S., Sansom M.S.P., Bayley H. Outer membrane protein G: engineering a quiet pore for biosensing. Proc. Natl. Acad. Sci. USA. 2008;105:6272–6277. doi: 10.1073/pnas.0711561105. [DOI] [PMC free article] [PubMed] [Google Scholar]
- 40.Chimerel C., Movileanu L., Pezeshki S., Winterhalter M., Kleinekathöfer U. Transport at the nanoscale: temperature dependence of ion conductance. Eur. Biophys. J. 2008;38:121–125. doi: 10.1007/s00249-008-0366-0. [DOI] [PubMed] [Google Scholar]
- 41.Humphrey W.F., Dalke A., Schulten K. VMD—visual molecular dynamics. J. Mol. Graph. 1996;14:33–38. doi: 10.1016/0263-7855(96)00018-5. [DOI] [PubMed] [Google Scholar]
- 42.Phillips J.C., Braun R., Wang W., Gumbart J., Tajkhorshid E. Scalable molecular dynamics with NAMD. J. Comput. Chem. 2005;26:1781–1782. doi: 10.1002/jcc.20289. [DOI] [PMC free article] [PubMed] [Google Scholar]
- 43.MacKerell A., Bashford D., Bellott M., Dunbrack R., Evanseck J. All-atom empirical potential for molecular modeling and dynamics studies of proteins. J. Phys. Chem. B. 1998;102:3586–3616. doi: 10.1021/jp973084f. [DOI] [PubMed] [Google Scholar]
- 44.Jorgensen W.L., Chandrasekhar J., Madura J.D., Impey R.W., Klein M.L. Comparison of simple potential functions for simulating liquid water. J. Chem. Phys. 1983;79:926–935. [Google Scholar]
- 45.Van Gelder P., Dumas F., Winterhalter M. Understanding the function of bacterial outer membrane channels by reconstitution into black lipid membranes. Biophys. Chem. 2000;85:153–167. doi: 10.1016/s0301-4622(99)00153-2. [DOI] [PubMed] [Google Scholar]
- 46.Montal M., Mueller P. Formation of bimolecular membranes from lipid monolayers and a study of their electrical properties. Proc. Natl. Acad. Sci. USA. 1972;69:3561–3566. doi: 10.1073/pnas.69.12.3561. [DOI] [PMC free article] [PubMed] [Google Scholar]
- 47.Chen A.A., Pappu R.V. Parameters of monovalent ions in the AMBER-99 force field: assessment of inaccuracies and proposed improvements. J. Phys. Chem. B. 2007;111:11884–11887. doi: 10.1021/jp0765392. [DOI] [PubMed] [Google Scholar]
- 48.Auffinger P., Cheatam T.E., Vaiana A.C. Spontaneous formation of KCl aggregates in biomolecular simulations: a force field issue? J. Chem. Theory Comput. 2007;3:1851–1859. doi: 10.1021/ct700143s. [DOI] [PubMed] [Google Scholar]
- 49.Siu S.W., Vacha R., Jungwirth P., Böckmann R.A. Biomolecular simulations of membranes: physical properties from different force fields. J. Chem. Phys. 2008;128:125103. doi: 10.1063/1.2897760. [DOI] [PubMed] [Google Scholar]
- 50.Hille B. 3rd ed. Sinauer; Sunderland, MA: 2001. Ion Channels of Excitable Membranes. [Google Scholar]
- 51.Benz R., Schmid A., Hancock R.E. Ion selectivity of Gram-negative bacterial porins. J. Bacteriol. 1985;162:722–727. doi: 10.1128/jb.162.2.722-727.1985. [DOI] [PMC free article] [PubMed] [Google Scholar]
- 52.Saraniti M., Aboud S., Eisenberg R. The simulation of ionic charge transport in biological ion channels: an introduction to numerical methods. Rev. Comp. Chem. 2006;22:229–294. [Google Scholar]
- 53.Benz R., Janko K., Lauger P. Ionic selectivity of pores formed by the matrix protein (porin) of Escherichia coli. Biochim. Biophys. Acta. 1979;551:238–247. doi: 10.1016/0005-2736(89)90002-3. [DOI] [PubMed] [Google Scholar]
- 54.Saint N., Lou K.L., Widmer C., Luckey M., Schirmer T. Structural and functional characterization of OmpF porin mutants selected for larger pore size. II. Functional characterization. J. Biol. Chem. 1996;271:20676–20680. [PubMed] [Google Scholar]
- 55.Alcaraz A., Nestorovich E.M., Lopez M.L., Garcia-Gimenez E., Bezrukov S.M. Diffusion, exclusion, and specific binding in a large channel: a study of OmpF selectivity inversion. Biophys. J. 2009;96:56–66. doi: 10.1016/j.bpj.2008.09.024. [DOI] [PMC free article] [PubMed] [Google Scholar]
- 56.Varma S., Jakobsson E. Ionization states of residues in OmpF and mutants: effects of dielectric constant and interactions between residues. Biophys. J. 2004;86:690–704. doi: 10.1016/S0006-3495(04)74148-X. [DOI] [PMC free article] [PubMed] [Google Scholar]
- 57.Varma S., Chiu S.W., Jakobsson E. The influence of amino acid protonation states on molecular dynamics simulations of the bacterial porin OmpF. Biophys. J. 2006;90:112–113. doi: 10.1529/biophysj.105.059329. [DOI] [PMC free article] [PubMed] [Google Scholar]
- 58.Gu L.-Q., Serra M.D., Vincent J.B., Vigh G., Cheley S. Reversal of charge selectivity in transmembrane protein pores by using noncovalent molecular adapters. Proc. Natl. Acad. Sci. USA. 2000;97:3959–3964. doi: 10.1073/pnas.97.8.3959. [DOI] [PMC free article] [PubMed] [Google Scholar]
- 59.Schulz R., Kleinekathöfer U. Transitions between closed and open conformations of TolC: the effects of ions in simulations. Biophys. J. 2009;96:3116–3125. doi: 10.1016/j.bpj.2009.01.021. [DOI] [PMC free article] [PubMed] [Google Scholar]
- 60.Fernandes F., Neves P., Gameiro P., Loura L.M., Prieto M. Ciprofloxacin interactions with bacterial protein OmpF: modeling of FRET from a multi-tryptophan protein trimer. Biochim. Biophys. Acta. 2007;1768:2822–2830. doi: 10.1016/j.bbamem.2007.07.016. [DOI] [PubMed] [Google Scholar]
- 61.Ceccarelli M., Ruggerone P. Physical insights into permeation of and resistance to antibiotics in bacteria. Curr. Drug Targets. 2008;9:779–788. doi: 10.2174/138945008785747770. [DOI] [PubMed] [Google Scholar]
Associated Data
This section collects any data citations, data availability statements, or supplementary materials included in this article.